Air Pollution in Quanzi: Real-time Air Quality Index and smog alert.
Pollution and air quality forecast for Quanzi. Today is Tuesday, June 16, 2026. The following air pollution values have been recorded for Quanzi:- particulate matter (PM10) suspended dust - 53 (Unhealthy for Sensitive Groups)
- ozone (O3) - 0 (Good)
- particulate matter (PM2.5) dust - 7 (Good)
- sulfur dioxide (SO2) - 18 (Good)
- nitrogen dioxide (NO2) - 3 (Good)
- carbon monoxide (CO) - 1 (Good)

What is the air quality in Quanzi today? Is the air polluted in Quanzi?. Is there smog?
What is the level of PM10 today in Quanzi? (particulate matter (PM10) suspended dust)
The current level of particulate matter PM10 in Quanzi is:
53 (Unhealthy for Sensitive Groups)
The highest PM10 values usually occur in month: 198 (January 2019).
The lowest value of particulate matter PM10 pollution in Quanzi is usually recorded in: August (53).
How is the O3 level today in Quanzi? (ozone (O3))
0 (Good)
What is the current level of PM2.5 in Quanzi? (particulate matter (PM2.5) dust)
Today's PM2.5 level is:
7 (Good)
For comparison, the highest level of PM2.5 in Quanzi in the last 7 days was: 21 (Friday, May 27, 2022) and the lowest: 21 (Friday, May 27, 2022).
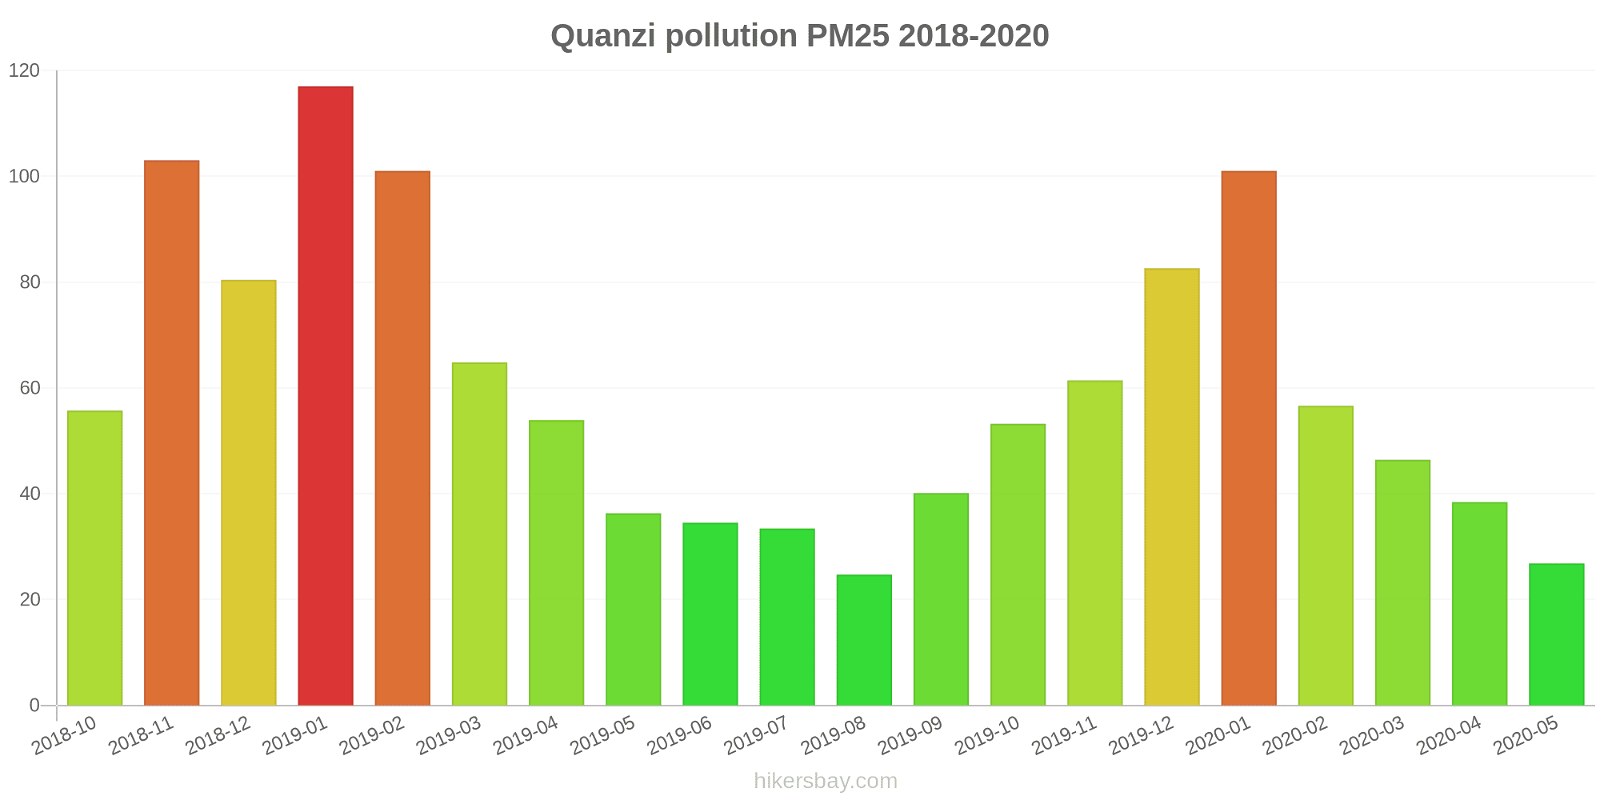
The highest PM2.5 values were recorded: 117 (January 2019).
The lowest level of particulate matter PM2.5 pollution occurs in month: August (25).
What is the level of SO2 pollution? (sulfur dioxide (SO2))
18 (Good)
How high is the level of NO2? (nitrogen dioxide (NO2))
3 (Good)
How high is the CO level? (carbon monoxide (CO))
1 (Good)
Current data Friday, May 27, 2022, 12:00 PM
PM10 53 (Unhealthy for Sensitive Groups)
O3 0 (Good)
PM2,5 7 (Good)
SO2 18 (Good)
NO2 3 (Good)
CO 1 (Good)
Data on air pollution from recent days in Quanzi
index
2022-05-27
pm10
51
Unhealthy for Sensitive Groups
o3
0
Good
pm25
21
Moderate
so2
10
Good
no2
0
Good
co
1
Good
data source »
Air pollution in Quanzi from October 2018 to May 2020
index
2020-05
2020-04
2020-03
2020-02
2020-01
2019-12
2019-11
2019-10
2019-09
2019-08
2019-07
2019-06
2019-05
2019-04
2019-03
2019-02
2019-01
2018-12
2018-11
2018-10
pm25
27 (Moderate)
38 (Unhealthy for Sensitive Groups)
46 (Unhealthy for Sensitive Groups)
57 (Unhealthy)
101 (Very Unhealthy)
83 (Very Unhealthy)
61 (Unhealthy)
53 (Unhealthy for Sensitive Groups)
40 (Unhealthy for Sensitive Groups)
25 (Moderate)
33 (Moderate)
35 (Moderate)
36 (Unhealthy for Sensitive Groups)
54 (Unhealthy for Sensitive Groups)
65 (Unhealthy)
101 (Very Unhealthy)
117 (Very bad Hazardous)
80 (Very Unhealthy)
103 (Very Unhealthy)
56 (Unhealthy)
co
981 (Good)
876 (Good)
1 (Good)
1 (Good)
1 (Good)
1 (Good)
1 (Good)
1 (Good)
937 (Good)
848 (Good)
1 (Good)
770 (Good)
734 (Good)
822 (Good)
926 (Good)
1 (Good)
1 (Good)
1 (Good)
1 (Good)
851 (Good)
no2
21 (Good)
35 (Good)
32 (Good)
23 (Good)
36 (Good)
48 (Moderate)
46 (Moderate)
42 (Moderate)
40 (Moderate)
26 (Good)
25 (Good)
26 (Good)
37 (Good)
38 (Good)
40 (Moderate)
47 (Moderate)
59 (Moderate)
52 (Moderate)
53 (Moderate)
49 (Moderate)
o3
150 (Unhealthy)
130 (Unhealthy for Sensitive Groups)
112 (Moderate)
91 (Moderate)
73 (Moderate)
61 (Good)
87 (Moderate)
122 (Unhealthy for Sensitive Groups)
176 (Unhealthy)
134 (Unhealthy for Sensitive Groups)
193 (Very Unhealthy)
219 (Very Unhealthy)
174 (Unhealthy)
143 (Unhealthy for Sensitive Groups)
127 (Unhealthy for Sensitive Groups)
99 (Moderate)
66 (Good)
59 (Good)
86 (Moderate)
110 (Moderate)
pm10
61 (Unhealthy for Sensitive Groups)
94 (Unhealthy)
108 (Unhealthy)
83 (Unhealthy)
144 (Very Unhealthy)
129 (Very Unhealthy)
135 (Very Unhealthy)
120 (Very Unhealthy)
87 (Unhealthy)
53 (Unhealthy for Sensitive Groups)
65 (Unhealthy for Sensitive Groups)
78 (Unhealthy for Sensitive Groups)
101 (Unhealthy)
106 (Unhealthy)
133 (Very Unhealthy)
154 (Very bad Hazardous)
198 (Very bad Hazardous)
155 (Very bad Hazardous)
189 (Very bad Hazardous)
123 (Very Unhealthy)
so2
12 (Good)
15 (Good)
13 (Good)
12 (Good)
19 (Good)
21 (Good)
15 (Good)
12 (Good)
12 (Good)
11 (Good)
10 (Good)
15 (Good)
16 (Good)
18 (Good)
20 (Good)
26 (Good)
33 (Good)
19 (Good)
15 (Good)
13 (Good)
data source »
泰兴公司(启用170519)
Friday, May 27, 2022, 12:00 PM
PM10 53 (Unhealthy for Sensitive Groups)
particulate matter (PM10) suspended dust
O3 0.02 (Good)
ozone (O3)
PM2,5 6.6 (Good)
particulate matter (PM2.5) dust
SO2 18 (Good)
sulfur dioxide (SO2)
NO2 3 (Good)
nitrogen dioxide (NO2)
CO 1.3 (Good)
carbon monoxide (CO)
泰兴公司(启用170519)
index
2022-05-27
pm10
51
o3
0.02
pm25
21
so2
9.6
no2
0.38
co
0.64
泰兴公司
2018-10 2020-05
index
2020-05
2020-04
2020-03
2020-02
2020-01
2019-12
2019-11
2019-10
2019-09
2019-08
2019-07
2019-06
2019-05
2019-04
2019-03
2019-02
2019-01
2018-12
2018-11
2018-10
pm25
27
38
46
57
101
83
61
53
40
25
33
35
36
54
65
101
117
80
103
56
co
981
876
1
1
1
1
1
1
937
848
1
770
734
822
926
1
1
1
1
851
no2
21
35
32
23
36
48
46
42
40
26
25
26
37
38
40
47
59
52
53
49
o3
150
130
112
91
73
61
87
122
176
134
193
219
174
143
127
99
66
59
86
110
pm10
61
94
108
83
144
129
135
120
87
53
65
78
101
106
133
154
198
155
189
123
so2
12
15
13
12
19
21
15
12
12
11
10
15
16
18
20
26
33
19
15
13
* Pollution data source:
https://openaq.org
(ChinaAQIData)
The data is licensed under CC-By 4.0
PM10 53 (Unhealthy for Sensitive Groups)
O3 0 (Good)
PM2,5 7 (Good)
SO2 18 (Good)
NO2 3 (Good)
CO 1 (Good)
Data on air pollution from recent days in Quanzi
| index | 2022-05-27 |
|---|---|
| pm10 | 51 Unhealthy for Sensitive Groups |
| o3 | 0 Good |
| pm25 | 21 Moderate |
| so2 | 10 Good |
| no2 | 0 Good |
| co | 1 Good |

| index | 2020-05 | 2020-04 | 2020-03 | 2020-02 | 2020-01 | 2019-12 | 2019-11 | 2019-10 | 2019-09 | 2019-08 | 2019-07 | 2019-06 | 2019-05 | 2019-04 | 2019-03 | 2019-02 | 2019-01 | 2018-12 | 2018-11 | 2018-10 |
|---|---|---|---|---|---|---|---|---|---|---|---|---|---|---|---|---|---|---|---|---|
| pm25 | 27 (Moderate) | 38 (Unhealthy for Sensitive Groups) | 46 (Unhealthy for Sensitive Groups) | 57 (Unhealthy) | 101 (Very Unhealthy) | 83 (Very Unhealthy) | 61 (Unhealthy) | 53 (Unhealthy for Sensitive Groups) | 40 (Unhealthy for Sensitive Groups) | 25 (Moderate) | 33 (Moderate) | 35 (Moderate) | 36 (Unhealthy for Sensitive Groups) | 54 (Unhealthy for Sensitive Groups) | 65 (Unhealthy) | 101 (Very Unhealthy) | 117 (Very bad Hazardous) | 80 (Very Unhealthy) | 103 (Very Unhealthy) | 56 (Unhealthy) |
| co | 981 (Good) | 876 (Good) | 1 (Good) | 1 (Good) | 1 (Good) | 1 (Good) | 1 (Good) | 1 (Good) | 937 (Good) | 848 (Good) | 1 (Good) | 770 (Good) | 734 (Good) | 822 (Good) | 926 (Good) | 1 (Good) | 1 (Good) | 1 (Good) | 1 (Good) | 851 (Good) |
| no2 | 21 (Good) | 35 (Good) | 32 (Good) | 23 (Good) | 36 (Good) | 48 (Moderate) | 46 (Moderate) | 42 (Moderate) | 40 (Moderate) | 26 (Good) | 25 (Good) | 26 (Good) | 37 (Good) | 38 (Good) | 40 (Moderate) | 47 (Moderate) | 59 (Moderate) | 52 (Moderate) | 53 (Moderate) | 49 (Moderate) |
| o3 | 150 (Unhealthy) | 130 (Unhealthy for Sensitive Groups) | 112 (Moderate) | 91 (Moderate) | 73 (Moderate) | 61 (Good) | 87 (Moderate) | 122 (Unhealthy for Sensitive Groups) | 176 (Unhealthy) | 134 (Unhealthy for Sensitive Groups) | 193 (Very Unhealthy) | 219 (Very Unhealthy) | 174 (Unhealthy) | 143 (Unhealthy for Sensitive Groups) | 127 (Unhealthy for Sensitive Groups) | 99 (Moderate) | 66 (Good) | 59 (Good) | 86 (Moderate) | 110 (Moderate) |
| pm10 | 61 (Unhealthy for Sensitive Groups) | 94 (Unhealthy) | 108 (Unhealthy) | 83 (Unhealthy) | 144 (Very Unhealthy) | 129 (Very Unhealthy) | 135 (Very Unhealthy) | 120 (Very Unhealthy) | 87 (Unhealthy) | 53 (Unhealthy for Sensitive Groups) | 65 (Unhealthy for Sensitive Groups) | 78 (Unhealthy for Sensitive Groups) | 101 (Unhealthy) | 106 (Unhealthy) | 133 (Very Unhealthy) | 154 (Very bad Hazardous) | 198 (Very bad Hazardous) | 155 (Very bad Hazardous) | 189 (Very bad Hazardous) | 123 (Very Unhealthy) |
| so2 | 12 (Good) | 15 (Good) | 13 (Good) | 12 (Good) | 19 (Good) | 21 (Good) | 15 (Good) | 12 (Good) | 12 (Good) | 11 (Good) | 10 (Good) | 15 (Good) | 16 (Good) | 18 (Good) | 20 (Good) | 26 (Good) | 33 (Good) | 19 (Good) | 15 (Good) | 13 (Good) |
PM10 53 (Unhealthy for Sensitive Groups)
particulate matter (PM10) suspended dustO3 0.02 (Good)
ozone (O3)PM2,5 6.6 (Good)
particulate matter (PM2.5) dustSO2 18 (Good)
sulfur dioxide (SO2)NO2 3 (Good)
nitrogen dioxide (NO2)CO 1.3 (Good)
carbon monoxide (CO)泰兴公司(启用170519)
| index | 2022-05-27 |
|---|---|
| pm10 | 51 |
| o3 | 0.02 |
| pm25 | 21 |
| so2 | 9.6 |
| no2 | 0.38 |
| co | 0.64 |
泰兴公司

| index | 2020-05 | 2020-04 | 2020-03 | 2020-02 | 2020-01 | 2019-12 | 2019-11 | 2019-10 | 2019-09 | 2019-08 | 2019-07 | 2019-06 | 2019-05 | 2019-04 | 2019-03 | 2019-02 | 2019-01 | 2018-12 | 2018-11 | 2018-10 |
|---|---|---|---|---|---|---|---|---|---|---|---|---|---|---|---|---|---|---|---|---|
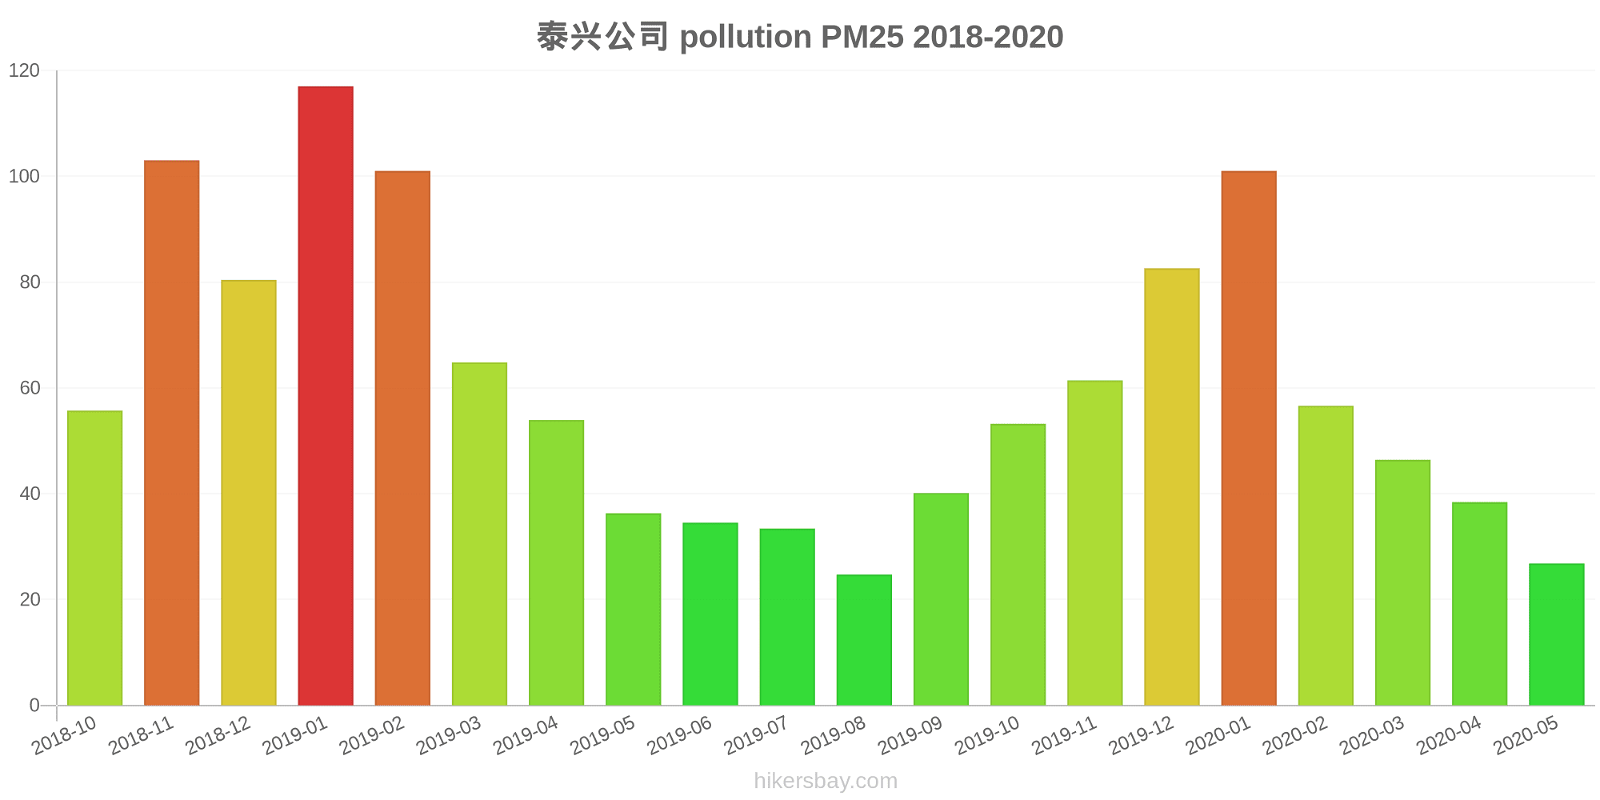
| pm25 | 27 | 38 | 46 | 57 | 101 | 83 | 61 | 53 | 40 | 25 | 33 | 35 | 36 | 54 | 65 | 101 | 117 | 80 | 103 | 56 |
| co | 981 | 876 | 1 | 1 | 1 | 1 | 1 | 1 | 937 | 848 | 1 | 770 | 734 | 822 | 926 | 1 | 1 | 1 | 1 | 851 |
| no2 | 21 | 35 | 32 | 23 | 36 | 48 | 46 | 42 | 40 | 26 | 25 | 26 | 37 | 38 | 40 | 47 | 59 | 52 | 53 | 49 |
| o3 | 150 | 130 | 112 | 91 | 73 | 61 | 87 | 122 | 176 | 134 | 193 | 219 | 174 | 143 | 127 | 99 | 66 | 59 | 86 | 110 |
| pm10 | 61 | 94 | 108 | 83 | 144 | 129 | 135 | 120 | 87 | 53 | 65 | 78 | 101 | 106 | 133 | 154 | 198 | 155 | 189 | 123 |
| so2 | 12 | 15 | 13 | 12 | 19 | 21 | 15 | 12 | 12 | 11 | 10 | 15 | 16 | 18 | 20 | 26 | 33 | 19 | 15 | 13 |