Air Pollution in Zhongzhuang: Real-time Air Quality Index and smog alert.
Pollution and air quality forecast for Zhongzhuang. Today is Tuesday, June 16, 2026. The following air pollution values have been recorded for Zhongzhuang:- particulate matter (PM10) suspended dust - 179 (Very bad Hazardous)
- particulate matter (PM2.5) dust - 35 (Unhealthy for Sensitive Groups)
- ozone (O3) - 0 (Good)
- nitrogen dioxide (NO2) - 0 (Good)
- sulfur dioxide (SO2) - 0 (Good)

What is the air quality in Zhongzhuang today? Is the air polluted in Zhongzhuang?. Is there smog?
What is the level of PM10 today in Zhongzhuang? (particulate matter (PM10) suspended dust)
The current level of particulate matter PM10 in Zhongzhuang is:
179 (Very bad Hazardous)
The highest PM10 values usually occur in month: 169 (January 2019).
The lowest value of particulate matter PM10 pollution in Zhongzhuang is usually recorded in: August (57).
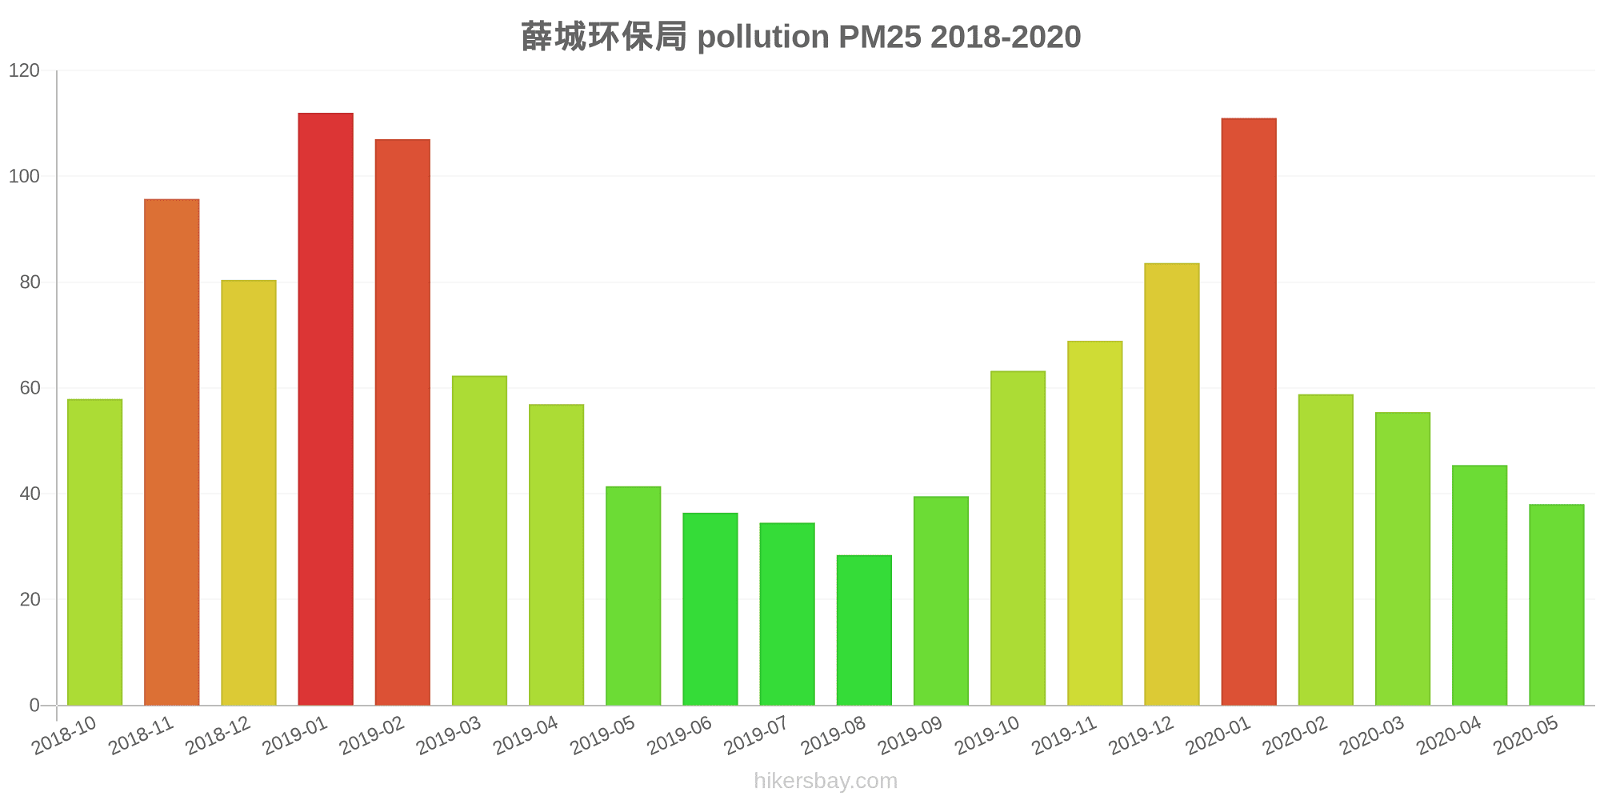
What is the current level of PM2.5 in Zhongzhuang? (particulate matter (PM2.5) dust)
Today's PM2.5 level is:
35 (Unhealthy for Sensitive Groups)
For comparison, the highest level of PM2.5 in Zhongzhuang in the last 7 days was: 56 (Friday, May 27, 2022) and the lowest: 56 (Friday, May 27, 2022).
The highest PM2.5 values were recorded: 112 (January 2019).
The lowest level of particulate matter PM2.5 pollution occurs in month: August (28).
How is the O3 level today in Zhongzhuang? (ozone (O3))
0 (Good)
How high is the level of NO2? (nitrogen dioxide (NO2))
0 (Good)
What is the level of SO2 pollution? (sulfur dioxide (SO2))
0 (Good)
Current data Friday, May 27, 2022, 12:00 PM
PM10 179 (Very bad Hazardous)
PM2,5 35 (Unhealthy for Sensitive Groups)
O3 0 (Good)
NO2 0 (Good)
SO2 0 (Good)
Data on air pollution from recent days in Zhongzhuang
index
2022-05-27
pm10
56
Unhealthy for Sensitive Groups
pm25
56
Unhealthy
o3
0
Good
no2
0
Good
so2
0
Good
data source »
Air pollution in Zhongzhuang from October 2018 to May 2020

index
2020-05
2020-04
2020-03
2020-02
2020-01
2019-12
2019-11
2019-10
2019-09
2019-08
2019-07
2019-06
2019-05
2019-04
2019-03
2019-02
2019-01
2018-12
2018-11
2018-10
pm25
38 (Unhealthy for Sensitive Groups)
45 (Unhealthy for Sensitive Groups)
55 (Unhealthy)
59 (Unhealthy)
111 (Very bad Hazardous)
84 (Very Unhealthy)
69 (Unhealthy)
63 (Unhealthy)
40 (Unhealthy for Sensitive Groups)
28 (Moderate)
35 (Moderate)
36 (Unhealthy for Sensitive Groups)
41 (Unhealthy for Sensitive Groups)
57 (Unhealthy)
62 (Unhealthy)
107 (Very Unhealthy)
112 (Very bad Hazardous)
80 (Very Unhealthy)
96 (Very Unhealthy)
58 (Unhealthy)
co
345 (Good)
361 (Good)
885 (Good)
815 (Good)
1 (Good)
1 (Good)
731 (Good)
680 (Good)
524 (Good)
438 (Good)
734 (Good)
557 (Good)
681 (Good)
709 (Good)
610 (Good)
796 (Good)
1 (Good)
775 (Good)
662 (Good)
516 (Good)
no2
17 (Good)
32 (Good)
35 (Good)
22 (Good)
40 (Moderate)
47 (Moderate)
48 (Moderate)
51 (Moderate)
39 (Good)
32 (Good)
30 (Good)
30 (Good)
39 (Good)
39 (Good)
48 (Moderate)
42 (Moderate)
56 (Moderate)
50 (Moderate)
53 (Moderate)
48 (Moderate)
o3
139 (Unhealthy for Sensitive Groups)
146 (Unhealthy for Sensitive Groups)
106 (Moderate)
92 (Moderate)
77 (Moderate)
66 (Good)
93 (Moderate)
125 (Unhealthy for Sensitive Groups)
180 (Very Unhealthy)
150 (Unhealthy)
188 (Very Unhealthy)
211 (Very Unhealthy)
179 (Unhealthy)
141 (Unhealthy for Sensitive Groups)
129 (Unhealthy for Sensitive Groups)
96 (Moderate)
77 (Moderate)
56 (Good)
92 (Moderate)
114 (Moderate)
pm10
82 (Unhealthy)
100 (Unhealthy)
102 (Unhealthy)
78 (Unhealthy for Sensitive Groups)
137 (Very Unhealthy)
121 (Very Unhealthy)
141 (Very Unhealthy)
127 (Very Unhealthy)
81 (Unhealthy)
57 (Unhealthy for Sensitive Groups)
67 (Unhealthy for Sensitive Groups)
87 (Unhealthy)
98 (Unhealthy)
111 (Very Unhealthy)
133 (Very Unhealthy)
160 (Very bad Hazardous)
169 (Very bad Hazardous)
142 (Very Unhealthy)
154 (Very bad Hazardous)
120 (Very Unhealthy)
so2
17 (Good)
23 (Good)
17 (Good)
12 (Good)
21 (Good)
21 (Good)
22 (Good)
21 (Good)
20 (Good)
16 (Good)
13 (Good)
17 (Good)
16 (Good)
15 (Good)
22 (Good)
26 (Good)
31 (Good)
22 (Good)
22 (Good)
23 (Good)
data source »
薛城环保局
Friday, May 27, 2022, 12:00 PM
PM10 179 (Very bad Hazardous)
particulate matter (PM10) suspended dust
PM2,5 35 (Unhealthy for Sensitive Groups)
particulate matter (PM2.5) dust
O3 0.04 (Good)
ozone (O3)
NO2 0 (Good)
nitrogen dioxide (NO2)
SO2 0 (Good)
sulfur dioxide (SO2)
薛城环保局
index
2022-05-27
pm10
56
pm25
56
o3
0.03
no2
0
so2
0
薛城环保局
2018-10 2020-05
index
2020-05
2020-04
2020-03
2020-02
2020-01
2019-12
2019-11
2019-10
2019-09
2019-08
2019-07
2019-06
2019-05
2019-04
2019-03
2019-02
2019-01
2018-12
2018-11
2018-10
pm25
38
45
55
59
111
84
69
63
40
28
35
36
41
57
62
107
112
80
96
58
co
345
361
885
815
1
1
731
680
524
438
734
557
681
709
610
796
1
775
662
516
no2
17
32
35
22
40
47
48
51
39
32
30
30
39
39
48
42
56
50
53
48
o3
139
146
106
92
77
66
93
125
180
150
188
211
179
141
129
96
77
56
92
114
pm10
82
100
102
78
137
121
141
127
81
57
67
87
98
111
133
160
169
142
154
120
so2
17
23
17
12
21
21
22
21
20
16
13
17
16
15
22
26
31
22
22
23
* Pollution data source:
https://openaq.org
(ChinaAQIData)
The data is licensed under CC-By 4.0
PM10 179 (Very bad Hazardous)
PM2,5 35 (Unhealthy for Sensitive Groups)
O3 0 (Good)
NO2 0 (Good)
SO2 0 (Good)
Data on air pollution from recent days in Zhongzhuang
| index | 2022-05-27 |
|---|---|
| pm10 | 56 Unhealthy for Sensitive Groups |
| pm25 | 56 Unhealthy |
| o3 | 0 Good |
| no2 | 0 Good |
| so2 | 0 Good |

| index | 2020-05 | 2020-04 | 2020-03 | 2020-02 | 2020-01 | 2019-12 | 2019-11 | 2019-10 | 2019-09 | 2019-08 | 2019-07 | 2019-06 | 2019-05 | 2019-04 | 2019-03 | 2019-02 | 2019-01 | 2018-12 | 2018-11 | 2018-10 |
|---|---|---|---|---|---|---|---|---|---|---|---|---|---|---|---|---|---|---|---|---|
| pm25 | 38 (Unhealthy for Sensitive Groups) | 45 (Unhealthy for Sensitive Groups) | 55 (Unhealthy) | 59 (Unhealthy) | 111 (Very bad Hazardous) | 84 (Very Unhealthy) | 69 (Unhealthy) | 63 (Unhealthy) | 40 (Unhealthy for Sensitive Groups) | 28 (Moderate) | 35 (Moderate) | 36 (Unhealthy for Sensitive Groups) | 41 (Unhealthy for Sensitive Groups) | 57 (Unhealthy) | 62 (Unhealthy) | 107 (Very Unhealthy) | 112 (Very bad Hazardous) | 80 (Very Unhealthy) | 96 (Very Unhealthy) | 58 (Unhealthy) |
| co | 345 (Good) | 361 (Good) | 885 (Good) | 815 (Good) | 1 (Good) | 1 (Good) | 731 (Good) | 680 (Good) | 524 (Good) | 438 (Good) | 734 (Good) | 557 (Good) | 681 (Good) | 709 (Good) | 610 (Good) | 796 (Good) | 1 (Good) | 775 (Good) | 662 (Good) | 516 (Good) |
| no2 | 17 (Good) | 32 (Good) | 35 (Good) | 22 (Good) | 40 (Moderate) | 47 (Moderate) | 48 (Moderate) | 51 (Moderate) | 39 (Good) | 32 (Good) | 30 (Good) | 30 (Good) | 39 (Good) | 39 (Good) | 48 (Moderate) | 42 (Moderate) | 56 (Moderate) | 50 (Moderate) | 53 (Moderate) | 48 (Moderate) |
| o3 | 139 (Unhealthy for Sensitive Groups) | 146 (Unhealthy for Sensitive Groups) | 106 (Moderate) | 92 (Moderate) | 77 (Moderate) | 66 (Good) | 93 (Moderate) | 125 (Unhealthy for Sensitive Groups) | 180 (Very Unhealthy) | 150 (Unhealthy) | 188 (Very Unhealthy) | 211 (Very Unhealthy) | 179 (Unhealthy) | 141 (Unhealthy for Sensitive Groups) | 129 (Unhealthy for Sensitive Groups) | 96 (Moderate) | 77 (Moderate) | 56 (Good) | 92 (Moderate) | 114 (Moderate) |
| pm10 | 82 (Unhealthy) | 100 (Unhealthy) | 102 (Unhealthy) | 78 (Unhealthy for Sensitive Groups) | 137 (Very Unhealthy) | 121 (Very Unhealthy) | 141 (Very Unhealthy) | 127 (Very Unhealthy) | 81 (Unhealthy) | 57 (Unhealthy for Sensitive Groups) | 67 (Unhealthy for Sensitive Groups) | 87 (Unhealthy) | 98 (Unhealthy) | 111 (Very Unhealthy) | 133 (Very Unhealthy) | 160 (Very bad Hazardous) | 169 (Very bad Hazardous) | 142 (Very Unhealthy) | 154 (Very bad Hazardous) | 120 (Very Unhealthy) |
| so2 | 17 (Good) | 23 (Good) | 17 (Good) | 12 (Good) | 21 (Good) | 21 (Good) | 22 (Good) | 21 (Good) | 20 (Good) | 16 (Good) | 13 (Good) | 17 (Good) | 16 (Good) | 15 (Good) | 22 (Good) | 26 (Good) | 31 (Good) | 22 (Good) | 22 (Good) | 23 (Good) |
PM10 179 (Very bad Hazardous)
particulate matter (PM10) suspended dustPM2,5 35 (Unhealthy for Sensitive Groups)
particulate matter (PM2.5) dustO3 0.04 (Good)
ozone (O3)NO2 0 (Good)
nitrogen dioxide (NO2)SO2 0 (Good)
sulfur dioxide (SO2)薛城环保局
| index | 2022-05-27 |
|---|---|
| pm10 | 56 |
| pm25 | 56 |
| o3 | 0.03 |
| no2 | 0 |
| so2 | 0 |
薛城环保局

| index | 2020-05 | 2020-04 | 2020-03 | 2020-02 | 2020-01 | 2019-12 | 2019-11 | 2019-10 | 2019-09 | 2019-08 | 2019-07 | 2019-06 | 2019-05 | 2019-04 | 2019-03 | 2019-02 | 2019-01 | 2018-12 | 2018-11 | 2018-10 |
|---|---|---|---|---|---|---|---|---|---|---|---|---|---|---|---|---|---|---|---|---|
| pm25 | 38 | 45 | 55 | 59 | 111 | 84 | 69 | 63 | 40 | 28 | 35 | 36 | 41 | 57 | 62 | 107 | 112 | 80 | 96 | 58 |
| co | 345 | 361 | 885 | 815 | 1 | 1 | 731 | 680 | 524 | 438 | 734 | 557 | 681 | 709 | 610 | 796 | 1 | 775 | 662 | 516 |
| no2 | 17 | 32 | 35 | 22 | 40 | 47 | 48 | 51 | 39 | 32 | 30 | 30 | 39 | 39 | 48 | 42 | 56 | 50 | 53 | 48 |
| o3 | 139 | 146 | 106 | 92 | 77 | 66 | 93 | 125 | 180 | 150 | 188 | 211 | 179 | 141 | 129 | 96 | 77 | 56 | 92 | 114 |
| pm10 | 82 | 100 | 102 | 78 | 137 | 121 | 141 | 127 | 81 | 57 | 67 | 87 | 98 | 111 | 133 | 160 | 169 | 142 | 154 | 120 |
| so2 | 17 | 23 | 17 | 12 | 21 | 21 | 22 | 21 | 20 | 16 | 13 | 17 | 16 | 15 | 22 | 26 | 31 | 22 | 22 | 23 |