Air Pollution in Chailin: Real-time Air Quality Index and smog alert.
Pollution and air quality forecast for Chailin. Today is Tuesday, June 16, 2026. The following air pollution values have been recorded for Chailin:- particulate matter (PM10) suspended dust - 179 (Very bad Hazardous)
- particulate matter (PM2.5) dust - 35 (Unhealthy for Sensitive Groups)
- ozone (O3) - 0 (Good)
- nitrogen dioxide (NO2) - 0 (Good)
- sulfur dioxide (SO2) - 0 (Good)

What is the air quality in Chailin today? Is the air polluted in Chailin?. Is there smog?
What is the level of PM10 today in Chailin? (particulate matter (PM10) suspended dust)
The current level of particulate matter PM10 in Chailin is:
179 (Very bad Hazardous)
The highest PM10 values usually occur in month: 157 (January 2019).
The lowest value of particulate matter PM10 pollution in Chailin is usually recorded in: August (48).
What is the current level of PM2.5 in Chailin? (particulate matter (PM2.5) dust)
Today's PM2.5 level is:
35 (Unhealthy for Sensitive Groups)
For comparison, the highest level of PM2.5 in Chailin in the last 7 days was: 56 (Friday, May 27, 2022) and the lowest: 56 (Friday, May 27, 2022).
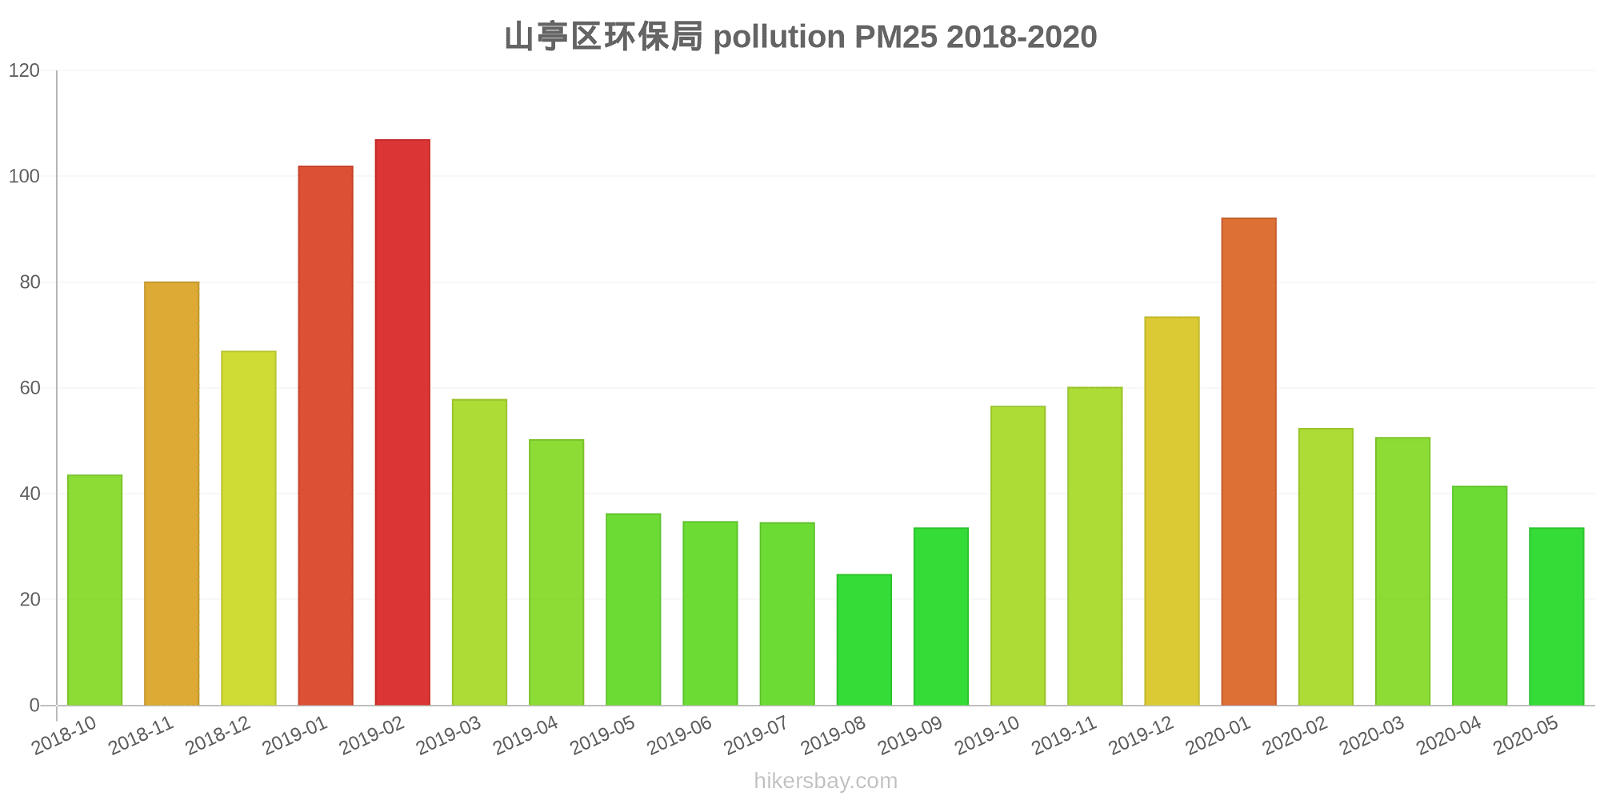
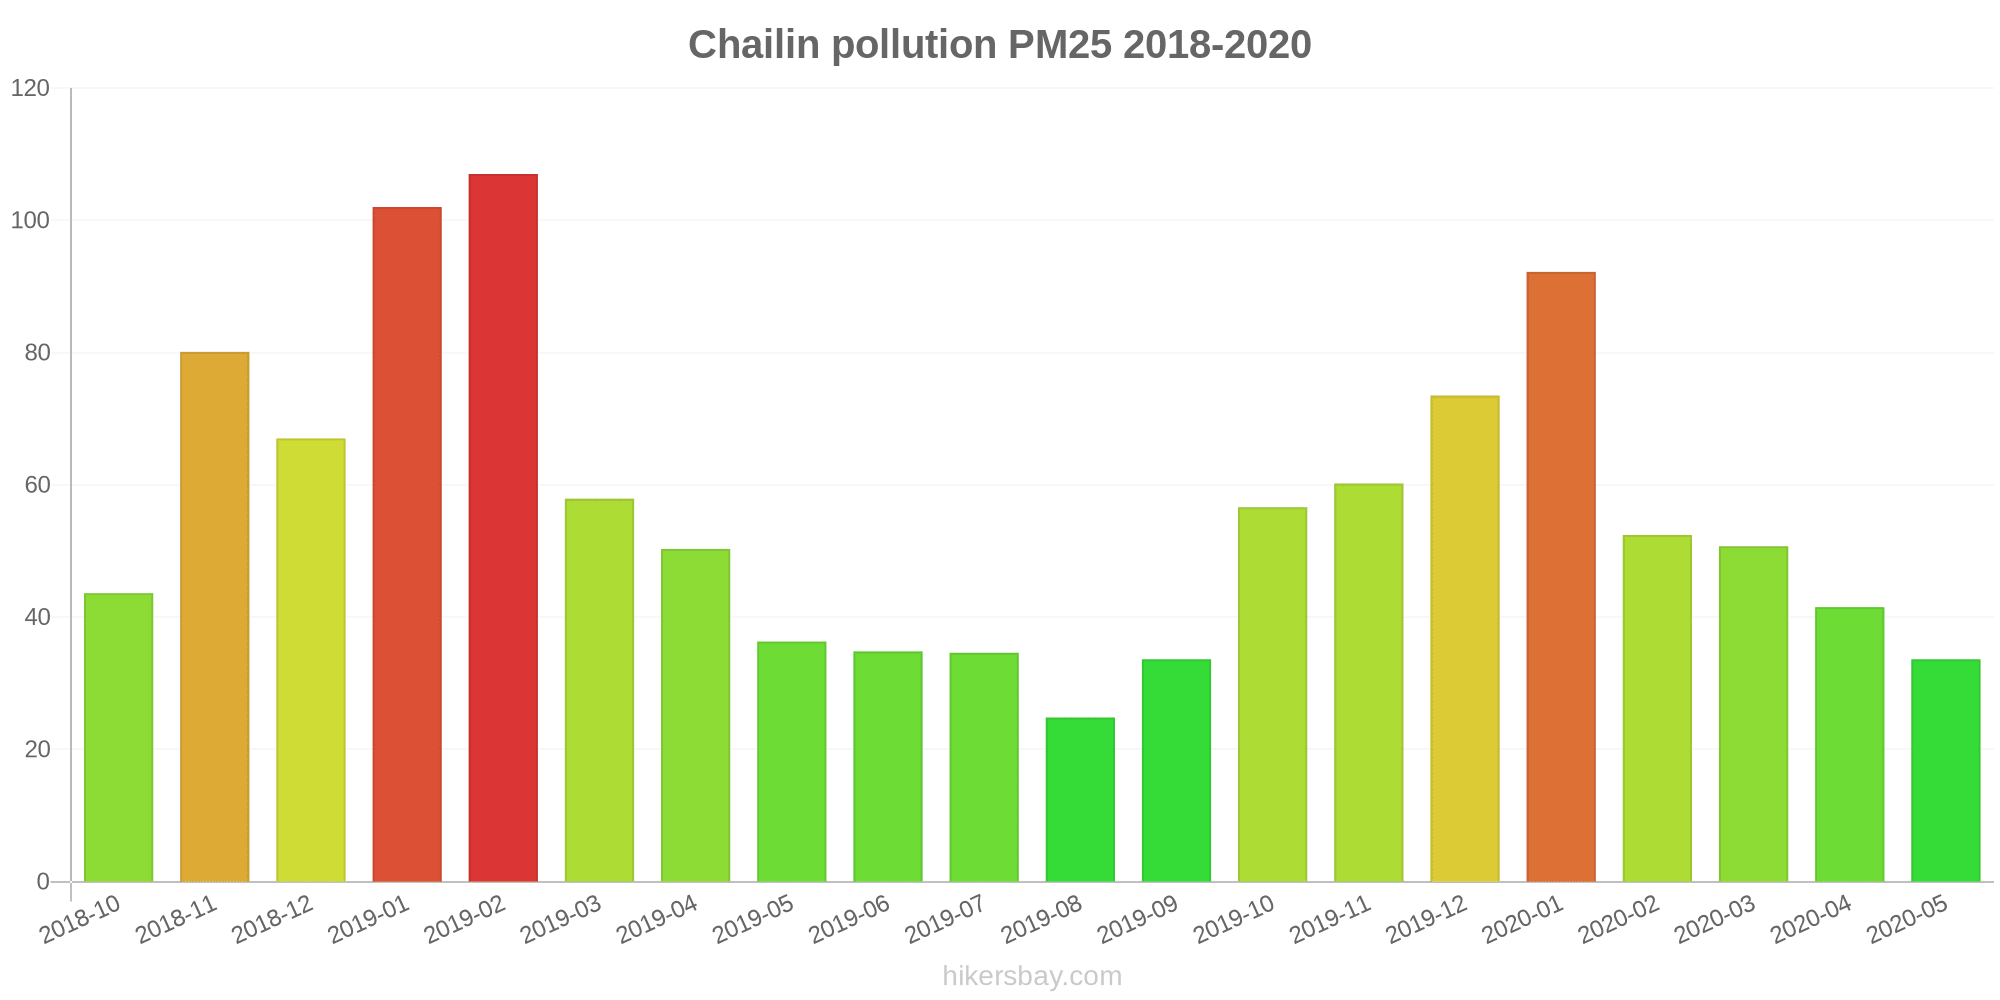
The highest PM2.5 values were recorded: 107 (February 2019).
The lowest level of particulate matter PM2.5 pollution occurs in month: August (25).
How is the O3 level today in Chailin? (ozone (O3))
0 (Good)
How high is the level of NO2? (nitrogen dioxide (NO2))
0 (Good)
What is the level of SO2 pollution? (sulfur dioxide (SO2))
0 (Good)
Current data Friday, May 27, 2022, 12:00 PM
PM10 179 (Very bad Hazardous)
PM2,5 35 (Unhealthy for Sensitive Groups)
O3 0 (Good)
NO2 0 (Good)
SO2 0 (Good)
Data on air pollution from recent days in Chailin
index
2022-05-27
pm10
56
Unhealthy for Sensitive Groups
pm25
56
Unhealthy
o3
0
Good
no2
0
Good
so2
0
Good
data source »
Air pollution in Chailin from October 2018 to May 2020

index
2020-05
2020-04
2020-03
2020-02
2020-01
2019-12
2019-11
2019-10
2019-09
2019-08
2019-07
2019-06
2019-05
2019-04
2019-03
2019-02
2019-01
2018-12
2018-11
2018-10
pm25
34 (Moderate)
42 (Unhealthy for Sensitive Groups)
51 (Unhealthy for Sensitive Groups)
52 (Unhealthy for Sensitive Groups)
92 (Very Unhealthy)
74 (Unhealthy)
60 (Unhealthy)
57 (Unhealthy)
34 (Moderate)
25 (Moderate)
35 (Moderate)
35 (Moderate)
36 (Unhealthy for Sensitive Groups)
50 (Unhealthy for Sensitive Groups)
58 (Unhealthy)
107 (Very Unhealthy)
102 (Very Unhealthy)
67 (Unhealthy)
80 (Very Unhealthy)
44 (Unhealthy for Sensitive Groups)
co
551 (Good)
479 (Good)
687 (Good)
848 (Good)
1 (Good)
945 (Good)
681 (Good)
684 (Good)
528 (Good)
527 (Good)
628 (Good)
778 (Good)
739 (Good)
704 (Good)
791 (Good)
1 (Good)
1 (Good)
774 (Good)
786 (Good)
493 (Good)
no2
11 (Good)
23 (Good)
25 (Good)
18 (Good)
29 (Good)
37 (Good)
26 (Good)
23 (Good)
17 (Good)
11 (Good)
13 (Good)
16 (Good)
21 (Good)
22 (Good)
31 (Good)
29 (Good)
44 (Moderate)
39 (Good)
34 (Good)
28 (Good)
o3
151 (Unhealthy)
140 (Unhealthy for Sensitive Groups)
115 (Moderate)
99 (Moderate)
85 (Moderate)
76 (Moderate)
106 (Moderate)
134 (Unhealthy for Sensitive Groups)
173 (Unhealthy)
144 (Unhealthy for Sensitive Groups)
184 (Very Unhealthy)
215 (Very Unhealthy)
167 (Unhealthy)
144 (Unhealthy for Sensitive Groups)
127 (Unhealthy for Sensitive Groups)
110 (Moderate)
81 (Moderate)
71 (Moderate)
107 (Moderate)
151 (Unhealthy)
pm10
72 (Unhealthy for Sensitive Groups)
85 (Unhealthy)
90 (Unhealthy)
70 (Unhealthy for Sensitive Groups)
122 (Very Unhealthy)
106 (Unhealthy)
118 (Very Unhealthy)
102 (Unhealthy)
64 (Unhealthy for Sensitive Groups)
48 (Moderate)
61 (Unhealthy for Sensitive Groups)
81 (Unhealthy)
90 (Unhealthy)
98 (Unhealthy)
115 (Very Unhealthy)
150 (Very bad Hazardous)
157 (Very bad Hazardous)
117 (Very Unhealthy)
139 (Very Unhealthy)
93 (Unhealthy)
so2
12 (Good)
16 (Good)
16 (Good)
12 (Good)
22 (Good)
22 (Good)
16 (Good)
14 (Good)
11 (Good)
9.5 (Good)
12 (Good)
15 (Good)
14 (Good)
14 (Good)
17 (Good)
19 (Good)
24 (Good)
15 (Good)
14 (Good)
14 (Good)
data source »
山亭区环保局
Friday, May 27, 2022, 12:00 PM
PM10 179 (Very bad Hazardous)
particulate matter (PM10) suspended dust
PM2,5 35 (Unhealthy for Sensitive Groups)
particulate matter (PM2.5) dust
O3 0.04 (Good)
ozone (O3)
NO2 0 (Good)
nitrogen dioxide (NO2)
SO2 0 (Good)
sulfur dioxide (SO2)
山亭区环保局
index
2022-05-27
pm10
56
pm25
56
o3
0.03
no2
0
so2
0
山亭区环保局
2018-10 2020-05
index
2020-05
2020-04
2020-03
2020-02
2020-01
2019-12
2019-11
2019-10
2019-09
2019-08
2019-07
2019-06
2019-05
2019-04
2019-03
2019-02
2019-01
2018-12
2018-11
2018-10
pm25
34
42
51
52
92
74
60
57
34
25
35
35
36
50
58
107
102
67
80
44
co
551
479
687
848
1
945
681
684
528
527
628
778
739
704
791
1
1
774
786
493
no2
11
23
25
18
29
37
26
23
17
11
13
16
21
22
31
29
44
39
34
28
o3
151
140
115
99
85
76
106
134
173
144
184
215
167
144
127
110
81
71
107
151
pm10
72
85
90
70
122
106
118
102
64
48
61
81
90
98
115
150
157
117
139
93
so2
12
16
16
12
22
22
16
14
11
9.5
12
15
14
14
17
19
24
15
14
14
* Pollution data source:
https://openaq.org
(ChinaAQIData)
The data is licensed under CC-By 4.0
PM10 179 (Very bad Hazardous)
PM2,5 35 (Unhealthy for Sensitive Groups)
O3 0 (Good)
NO2 0 (Good)
SO2 0 (Good)
Data on air pollution from recent days in Chailin
| index | 2022-05-27 |
|---|---|
| pm10 | 56 Unhealthy for Sensitive Groups |
| pm25 | 56 Unhealthy |
| o3 | 0 Good |
| no2 | 0 Good |
| so2 | 0 Good |
| index | 2020-05 | 2020-04 | 2020-03 | 2020-02 | 2020-01 | 2019-12 | 2019-11 | 2019-10 | 2019-09 | 2019-08 | 2019-07 | 2019-06 | 2019-05 | 2019-04 | 2019-03 | 2019-02 | 2019-01 | 2018-12 | 2018-11 | 2018-10 |
|---|---|---|---|---|---|---|---|---|---|---|---|---|---|---|---|---|---|---|---|---|
| pm25 | 34 (Moderate) | 42 (Unhealthy for Sensitive Groups) | 51 (Unhealthy for Sensitive Groups) | 52 (Unhealthy for Sensitive Groups) | 92 (Very Unhealthy) | 74 (Unhealthy) | 60 (Unhealthy) | 57 (Unhealthy) | 34 (Moderate) | 25 (Moderate) | 35 (Moderate) | 35 (Moderate) | 36 (Unhealthy for Sensitive Groups) | 50 (Unhealthy for Sensitive Groups) | 58 (Unhealthy) | 107 (Very Unhealthy) | 102 (Very Unhealthy) | 67 (Unhealthy) | 80 (Very Unhealthy) | 44 (Unhealthy for Sensitive Groups) |
| co | 551 (Good) | 479 (Good) | 687 (Good) | 848 (Good) | 1 (Good) | 945 (Good) | 681 (Good) | 684 (Good) | 528 (Good) | 527 (Good) | 628 (Good) | 778 (Good) | 739 (Good) | 704 (Good) | 791 (Good) | 1 (Good) | 1 (Good) | 774 (Good) | 786 (Good) | 493 (Good) |
| no2 | 11 (Good) | 23 (Good) | 25 (Good) | 18 (Good) | 29 (Good) | 37 (Good) | 26 (Good) | 23 (Good) | 17 (Good) | 11 (Good) | 13 (Good) | 16 (Good) | 21 (Good) | 22 (Good) | 31 (Good) | 29 (Good) | 44 (Moderate) | 39 (Good) | 34 (Good) | 28 (Good) |
| o3 | 151 (Unhealthy) | 140 (Unhealthy for Sensitive Groups) | 115 (Moderate) | 99 (Moderate) | 85 (Moderate) | 76 (Moderate) | 106 (Moderate) | 134 (Unhealthy for Sensitive Groups) | 173 (Unhealthy) | 144 (Unhealthy for Sensitive Groups) | 184 (Very Unhealthy) | 215 (Very Unhealthy) | 167 (Unhealthy) | 144 (Unhealthy for Sensitive Groups) | 127 (Unhealthy for Sensitive Groups) | 110 (Moderate) | 81 (Moderate) | 71 (Moderate) | 107 (Moderate) | 151 (Unhealthy) |
| pm10 | 72 (Unhealthy for Sensitive Groups) | 85 (Unhealthy) | 90 (Unhealthy) | 70 (Unhealthy for Sensitive Groups) | 122 (Very Unhealthy) | 106 (Unhealthy) | 118 (Very Unhealthy) | 102 (Unhealthy) | 64 (Unhealthy for Sensitive Groups) | 48 (Moderate) | 61 (Unhealthy for Sensitive Groups) | 81 (Unhealthy) | 90 (Unhealthy) | 98 (Unhealthy) | 115 (Very Unhealthy) | 150 (Very bad Hazardous) | 157 (Very bad Hazardous) | 117 (Very Unhealthy) | 139 (Very Unhealthy) | 93 (Unhealthy) |
| so2 | 12 (Good) | 16 (Good) | 16 (Good) | 12 (Good) | 22 (Good) | 22 (Good) | 16 (Good) | 14 (Good) | 11 (Good) | 9.5 (Good) | 12 (Good) | 15 (Good) | 14 (Good) | 14 (Good) | 17 (Good) | 19 (Good) | 24 (Good) | 15 (Good) | 14 (Good) | 14 (Good) |
PM10 179 (Very bad Hazardous)
particulate matter (PM10) suspended dustPM2,5 35 (Unhealthy for Sensitive Groups)
particulate matter (PM2.5) dustO3 0.04 (Good)
ozone (O3)NO2 0 (Good)
nitrogen dioxide (NO2)SO2 0 (Good)
sulfur dioxide (SO2)山亭区环保局
| index | 2022-05-27 |
|---|---|
| pm10 | 56 |
| pm25 | 56 |
| o3 | 0.03 |
| no2 | 0 |
| so2 | 0 |
山亭区环保局

| index | 2020-05 | 2020-04 | 2020-03 | 2020-02 | 2020-01 | 2019-12 | 2019-11 | 2019-10 | 2019-09 | 2019-08 | 2019-07 | 2019-06 | 2019-05 | 2019-04 | 2019-03 | 2019-02 | 2019-01 | 2018-12 | 2018-11 | 2018-10 |
|---|---|---|---|---|---|---|---|---|---|---|---|---|---|---|---|---|---|---|---|---|
| pm25 | 34 | 42 | 51 | 52 | 92 | 74 | 60 | 57 | 34 | 25 | 35 | 35 | 36 | 50 | 58 | 107 | 102 | 67 | 80 | 44 |
| co | 551 | 479 | 687 | 848 | 1 | 945 | 681 | 684 | 528 | 527 | 628 | 778 | 739 | 704 | 791 | 1 | 1 | 774 | 786 | 493 |
| no2 | 11 | 23 | 25 | 18 | 29 | 37 | 26 | 23 | 17 | 11 | 13 | 16 | 21 | 22 | 31 | 29 | 44 | 39 | 34 | 28 |
| o3 | 151 | 140 | 115 | 99 | 85 | 76 | 106 | 134 | 173 | 144 | 184 | 215 | 167 | 144 | 127 | 110 | 81 | 71 | 107 | 151 |
| pm10 | 72 | 85 | 90 | 70 | 122 | 106 | 118 | 102 | 64 | 48 | 61 | 81 | 90 | 98 | 115 | 150 | 157 | 117 | 139 | 93 |
| so2 | 12 | 16 | 16 | 12 | 22 | 22 | 16 | 14 | 11 | 9.5 | 12 | 15 | 14 | 14 | 17 | 19 | 24 | 15 | 14 | 14 |