Air Pollution in Chuzhuang: Real-time Air Quality Index and smog alert.
Pollution and air quality forecast for Chuzhuang. Today is Tuesday, June 16, 2026. The following air pollution values have been recorded for Chuzhuang:- particulate matter (PM10) suspended dust - 179 (Very bad Hazardous)
- particulate matter (PM2.5) dust - 35 (Unhealthy for Sensitive Groups)
- ozone (O3) - 0 (Good)
- nitrogen dioxide (NO2) - 0 (Good)
- sulfur dioxide (SO2) - 0 (Good)

What is the air quality in Chuzhuang today? Is the air polluted in Chuzhuang?. Is there smog?
What is the level of PM10 today in Chuzhuang? (particulate matter (PM10) suspended dust)
The current level of particulate matter PM10 in Chuzhuang is:
179 (Very bad Hazardous)
The highest PM10 values usually occur in month: 189 (December 2018).
The lowest value of particulate matter PM10 pollution in Chuzhuang is usually recorded in: August (56).
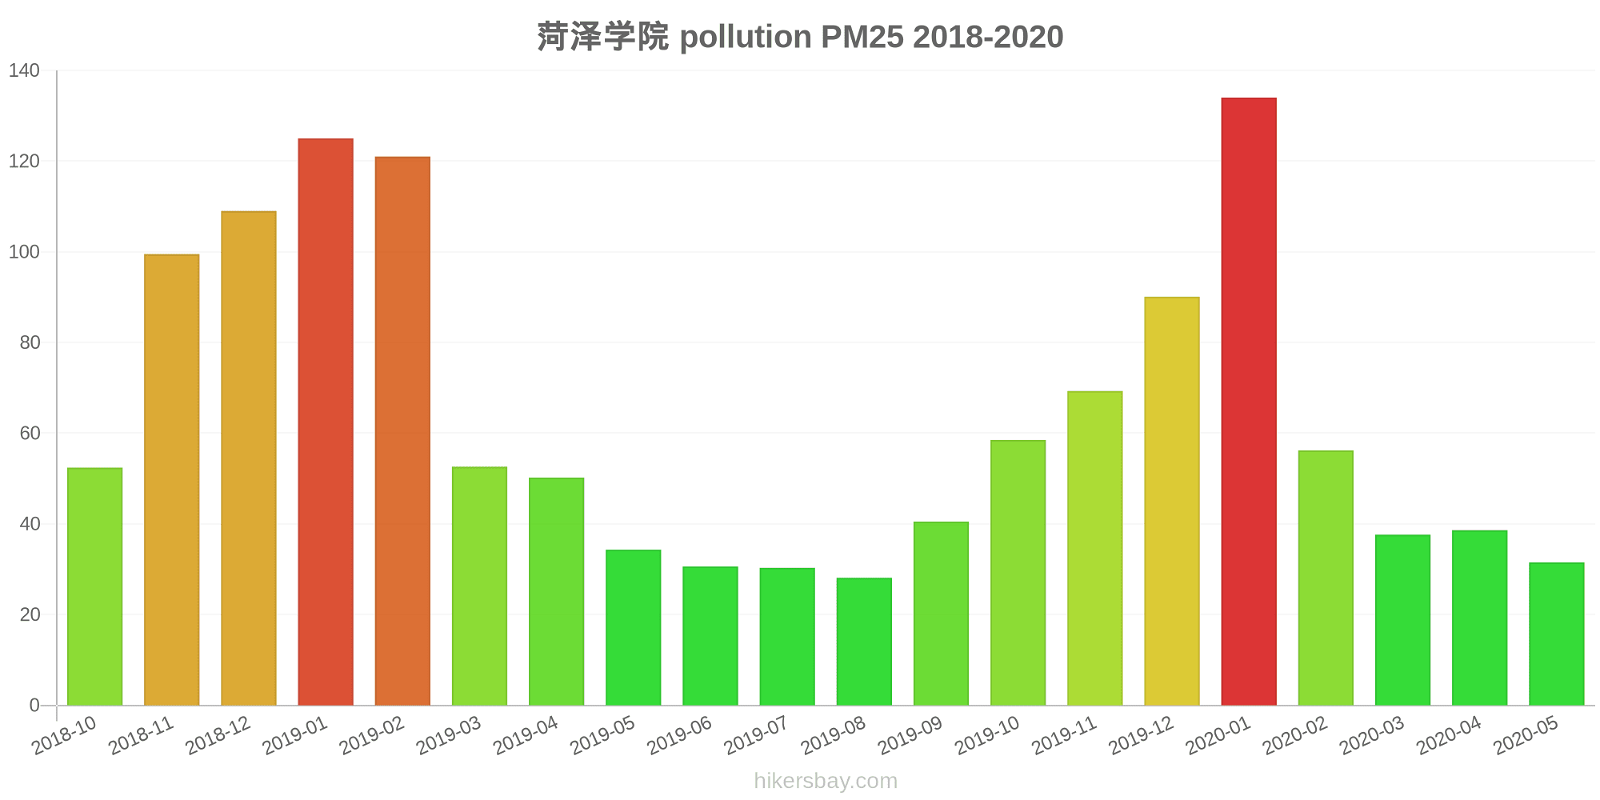
What is the current level of PM2.5 in Chuzhuang? (particulate matter (PM2.5) dust)
Today's PM2.5 level is:
35 (Unhealthy for Sensitive Groups)
For comparison, the highest level of PM2.5 in Chuzhuang in the last 7 days was: 56 (Friday, May 27, 2022) and the lowest: 56 (Friday, May 27, 2022).
The highest PM2.5 values were recorded: 134 (January 2020).
The lowest level of particulate matter PM2.5 pollution occurs in month: August (28).
How is the O3 level today in Chuzhuang? (ozone (O3))
0 (Good)
How high is the level of NO2? (nitrogen dioxide (NO2))
0 (Good)
What is the level of SO2 pollution? (sulfur dioxide (SO2))
0 (Good)
Current data Friday, May 27, 2022, 12:00 PM
PM10 179 (Very bad Hazardous)
PM2,5 35 (Unhealthy for Sensitive Groups)
O3 0 (Good)
NO2 0 (Good)
SO2 0 (Good)
Data on air pollution from recent days in Chuzhuang
index
2022-05-27
pm10
56
Unhealthy for Sensitive Groups
pm25
56
Unhealthy
o3
0
Good
no2
0
Good
so2
0
Good
data source »
Air pollution in Chuzhuang from October 2018 to May 2020

index
2020-05
2020-04
2020-03
2020-02
2020-01
2019-12
2019-11
2019-10
2019-09
2019-08
2019-07
2019-06
2019-05
2019-04
2019-03
2019-02
2019-01
2018-12
2018-11
2018-10
pm25
32 (Moderate)
39 (Unhealthy for Sensitive Groups)
38 (Unhealthy for Sensitive Groups)
56 (Unhealthy)
134 (Very bad Hazardous)
90 (Very Unhealthy)
69 (Unhealthy)
59 (Unhealthy)
41 (Unhealthy for Sensitive Groups)
28 (Moderate)
30 (Moderate)
31 (Moderate)
34 (Moderate)
50 (Unhealthy for Sensitive Groups)
53 (Unhealthy for Sensitive Groups)
121 (Very bad Hazardous)
125 (Very bad Hazardous)
109 (Very Unhealthy)
100 (Very Unhealthy)
52 (Unhealthy for Sensitive Groups)
co
494 (Good)
429 (Good)
505 (Good)
663 (Good)
1 (Good)
972 (Good)
675 (Good)
736 (Good)
765 (Good)
764 (Good)
725 (Good)
639 (Good)
613 (Good)
695 (Good)
809 (Good)
1 (Good)
1 (Good)
1 (Good)
1 (Good)
949 (Good)
no2
20 (Good)
26 (Good)
26 (Good)
15 (Good)
37 (Good)
41 (Moderate)
42 (Moderate)
41 (Moderate)
29 (Good)
22 (Good)
16 (Good)
19 (Good)
24 (Good)
23 (Good)
29 (Good)
26 (Good)
48 (Moderate)
54 (Moderate)
46 (Moderate)
53 (Moderate)
o3
144 (Unhealthy for Sensitive Groups)
127 (Unhealthy for Sensitive Groups)
103 (Moderate)
85 (Moderate)
68 (Good)
56 (Good)
91 (Moderate)
122 (Unhealthy for Sensitive Groups)
165 (Unhealthy)
147 (Unhealthy for Sensitive Groups)
185 (Very Unhealthy)
178 (Unhealthy)
155 (Unhealthy)
123 (Unhealthy for Sensitive Groups)
121 (Unhealthy for Sensitive Groups)
95 (Moderate)
70 (Moderate)
49 (Good)
85 (Moderate)
112 (Moderate)
pm10
95 (Unhealthy)
94 (Unhealthy)
100 (Unhealthy)
81 (Unhealthy)
172 (Very bad Hazardous)
125 (Very Unhealthy)
147 (Very Unhealthy)
126 (Very Unhealthy)
87 (Unhealthy)
56 (Unhealthy for Sensitive Groups)
62 (Unhealthy for Sensitive Groups)
88 (Unhealthy)
99 (Unhealthy)
112 (Very Unhealthy)
138 (Very Unhealthy)
166 (Very bad Hazardous)
184 (Very bad Hazardous)
189 (Very bad Hazardous)
162 (Very bad Hazardous)
110 (Very Unhealthy)
so2
14 (Good)
15 (Good)
12 (Good)
8.1 (Good)
13 (Good)
14 (Good)
17 (Good)
12 (Good)
11 (Good)
9.4 (Good)
9.6 (Good)
11 (Good)
13 (Good)
16 (Good)
14 (Good)
15 (Good)
17 (Good)
17 (Good)
12 (Good)
18 (Good)
data source »
菏泽学院
Friday, May 27, 2022, 12:00 PM
PM10 179 (Very bad Hazardous)
particulate matter (PM10) suspended dust
PM2,5 35 (Unhealthy for Sensitive Groups)
particulate matter (PM2.5) dust
O3 0.04 (Good)
ozone (O3)
NO2 0 (Good)
nitrogen dioxide (NO2)
SO2 0 (Good)
sulfur dioxide (SO2)
菏泽学院
index
2022-05-27
pm10
56
pm25
56
o3
0.03
no2
0
so2
0
菏泽学院
2018-10 2020-05
index
2020-05
2020-04
2020-03
2020-02
2020-01
2019-12
2019-11
2019-10
2019-09
2019-08
2019-07
2019-06
2019-05
2019-04
2019-03
2019-02
2019-01
2018-12
2018-11
2018-10
pm25
32
39
38
56
134
90
69
59
41
28
30
31
34
50
53
121
125
109
100
52
co
494
429
505
663
1
972
675
736
765
764
725
639
613
695
809
1
1
1
1
949
no2
20
26
26
15
37
41
42
41
29
22
16
19
24
23
29
26
48
54
46
53
o3
144
127
103
85
68
56
91
122
165
147
185
178
155
123
121
95
70
49
85
112
pm10
95
94
100
81
172
125
147
126
87
56
62
88
99
112
138
166
184
189
162
110
so2
14
15
12
8.1
13
14
17
12
11
9.4
9.6
11
13
16
14
15
17
17
12
18
* Pollution data source:
https://openaq.org
(ChinaAQIData)
The data is licensed under CC-By 4.0
PM10 179 (Very bad Hazardous)
PM2,5 35 (Unhealthy for Sensitive Groups)
O3 0 (Good)
NO2 0 (Good)
SO2 0 (Good)
Data on air pollution from recent days in Chuzhuang
| index | 2022-05-27 |
|---|---|
| pm10 | 56 Unhealthy for Sensitive Groups |
| pm25 | 56 Unhealthy |
| o3 | 0 Good |
| no2 | 0 Good |
| so2 | 0 Good |

| index | 2020-05 | 2020-04 | 2020-03 | 2020-02 | 2020-01 | 2019-12 | 2019-11 | 2019-10 | 2019-09 | 2019-08 | 2019-07 | 2019-06 | 2019-05 | 2019-04 | 2019-03 | 2019-02 | 2019-01 | 2018-12 | 2018-11 | 2018-10 |
|---|---|---|---|---|---|---|---|---|---|---|---|---|---|---|---|---|---|---|---|---|
| pm25 | 32 (Moderate) | 39 (Unhealthy for Sensitive Groups) | 38 (Unhealthy for Sensitive Groups) | 56 (Unhealthy) | 134 (Very bad Hazardous) | 90 (Very Unhealthy) | 69 (Unhealthy) | 59 (Unhealthy) | 41 (Unhealthy for Sensitive Groups) | 28 (Moderate) | 30 (Moderate) | 31 (Moderate) | 34 (Moderate) | 50 (Unhealthy for Sensitive Groups) | 53 (Unhealthy for Sensitive Groups) | 121 (Very bad Hazardous) | 125 (Very bad Hazardous) | 109 (Very Unhealthy) | 100 (Very Unhealthy) | 52 (Unhealthy for Sensitive Groups) |
| co | 494 (Good) | 429 (Good) | 505 (Good) | 663 (Good) | 1 (Good) | 972 (Good) | 675 (Good) | 736 (Good) | 765 (Good) | 764 (Good) | 725 (Good) | 639 (Good) | 613 (Good) | 695 (Good) | 809 (Good) | 1 (Good) | 1 (Good) | 1 (Good) | 1 (Good) | 949 (Good) |
| no2 | 20 (Good) | 26 (Good) | 26 (Good) | 15 (Good) | 37 (Good) | 41 (Moderate) | 42 (Moderate) | 41 (Moderate) | 29 (Good) | 22 (Good) | 16 (Good) | 19 (Good) | 24 (Good) | 23 (Good) | 29 (Good) | 26 (Good) | 48 (Moderate) | 54 (Moderate) | 46 (Moderate) | 53 (Moderate) |
| o3 | 144 (Unhealthy for Sensitive Groups) | 127 (Unhealthy for Sensitive Groups) | 103 (Moderate) | 85 (Moderate) | 68 (Good) | 56 (Good) | 91 (Moderate) | 122 (Unhealthy for Sensitive Groups) | 165 (Unhealthy) | 147 (Unhealthy for Sensitive Groups) | 185 (Very Unhealthy) | 178 (Unhealthy) | 155 (Unhealthy) | 123 (Unhealthy for Sensitive Groups) | 121 (Unhealthy for Sensitive Groups) | 95 (Moderate) | 70 (Moderate) | 49 (Good) | 85 (Moderate) | 112 (Moderate) |
| pm10 | 95 (Unhealthy) | 94 (Unhealthy) | 100 (Unhealthy) | 81 (Unhealthy) | 172 (Very bad Hazardous) | 125 (Very Unhealthy) | 147 (Very Unhealthy) | 126 (Very Unhealthy) | 87 (Unhealthy) | 56 (Unhealthy for Sensitive Groups) | 62 (Unhealthy for Sensitive Groups) | 88 (Unhealthy) | 99 (Unhealthy) | 112 (Very Unhealthy) | 138 (Very Unhealthy) | 166 (Very bad Hazardous) | 184 (Very bad Hazardous) | 189 (Very bad Hazardous) | 162 (Very bad Hazardous) | 110 (Very Unhealthy) |
| so2 | 14 (Good) | 15 (Good) | 12 (Good) | 8.1 (Good) | 13 (Good) | 14 (Good) | 17 (Good) | 12 (Good) | 11 (Good) | 9.4 (Good) | 9.6 (Good) | 11 (Good) | 13 (Good) | 16 (Good) | 14 (Good) | 15 (Good) | 17 (Good) | 17 (Good) | 12 (Good) | 18 (Good) |
PM10 179 (Very bad Hazardous)
particulate matter (PM10) suspended dustPM2,5 35 (Unhealthy for Sensitive Groups)
particulate matter (PM2.5) dustO3 0.04 (Good)
ozone (O3)NO2 0 (Good)
nitrogen dioxide (NO2)SO2 0 (Good)
sulfur dioxide (SO2)菏泽学院
| index | 2022-05-27 |
|---|---|
| pm10 | 56 |
| pm25 | 56 |
| o3 | 0.03 |
| no2 | 0 |
| so2 | 0 |
菏泽学院

| index | 2020-05 | 2020-04 | 2020-03 | 2020-02 | 2020-01 | 2019-12 | 2019-11 | 2019-10 | 2019-09 | 2019-08 | 2019-07 | 2019-06 | 2019-05 | 2019-04 | 2019-03 | 2019-02 | 2019-01 | 2018-12 | 2018-11 | 2018-10 |
|---|---|---|---|---|---|---|---|---|---|---|---|---|---|---|---|---|---|---|---|---|
| pm25 | 32 | 39 | 38 | 56 | 134 | 90 | 69 | 59 | 41 | 28 | 30 | 31 | 34 | 50 | 53 | 121 | 125 | 109 | 100 | 52 |
| co | 494 | 429 | 505 | 663 | 1 | 972 | 675 | 736 | 765 | 764 | 725 | 639 | 613 | 695 | 809 | 1 | 1 | 1 | 1 | 949 |
| no2 | 20 | 26 | 26 | 15 | 37 | 41 | 42 | 41 | 29 | 22 | 16 | 19 | 24 | 23 | 29 | 26 | 48 | 54 | 46 | 53 |
| o3 | 144 | 127 | 103 | 85 | 68 | 56 | 91 | 122 | 165 | 147 | 185 | 178 | 155 | 123 | 121 | 95 | 70 | 49 | 85 | 112 |
| pm10 | 95 | 94 | 100 | 81 | 172 | 125 | 147 | 126 | 87 | 56 | 62 | 88 | 99 | 112 | 138 | 166 | 184 | 189 | 162 | 110 |
| so2 | 14 | 15 | 12 | 8.1 | 13 | 14 | 17 | 12 | 11 | 9.4 | 9.6 | 11 | 13 | 16 | 14 | 15 | 17 | 17 | 12 | 18 |