Air Pollution in Yangmei Cun: Real-time Air Quality Index and smog alert.
Pollution and air quality forecast for Yangmei Cun. Today is Tuesday, June 16, 2026. The following air pollution values have been recorded for Yangmei Cun:- particulate matter (PM10) suspended dust - 7 (Good)
- particulate matter (PM2.5) dust - 2 (Good)
- carbon monoxide (CO) - 100 (Good)
- nitrogen dioxide (NO2) - 8 (Good)
- ozone (O3) - 0 (Good)
- sulfur dioxide (SO2) - 9 (Good)

What is the air quality in Yangmei Cun today? Is the air polluted in Yangmei Cun?. Is there smog?
What is the level of PM10 today in Yangmei Cun? (particulate matter (PM10) suspended dust)
The current level of particulate matter PM10 in Yangmei Cun is:
7 (Good)
The highest PM10 values usually occur in month: 120 (January 2019).
The lowest value of particulate matter PM10 pollution in Yangmei Cun is usually recorded in: August (54).
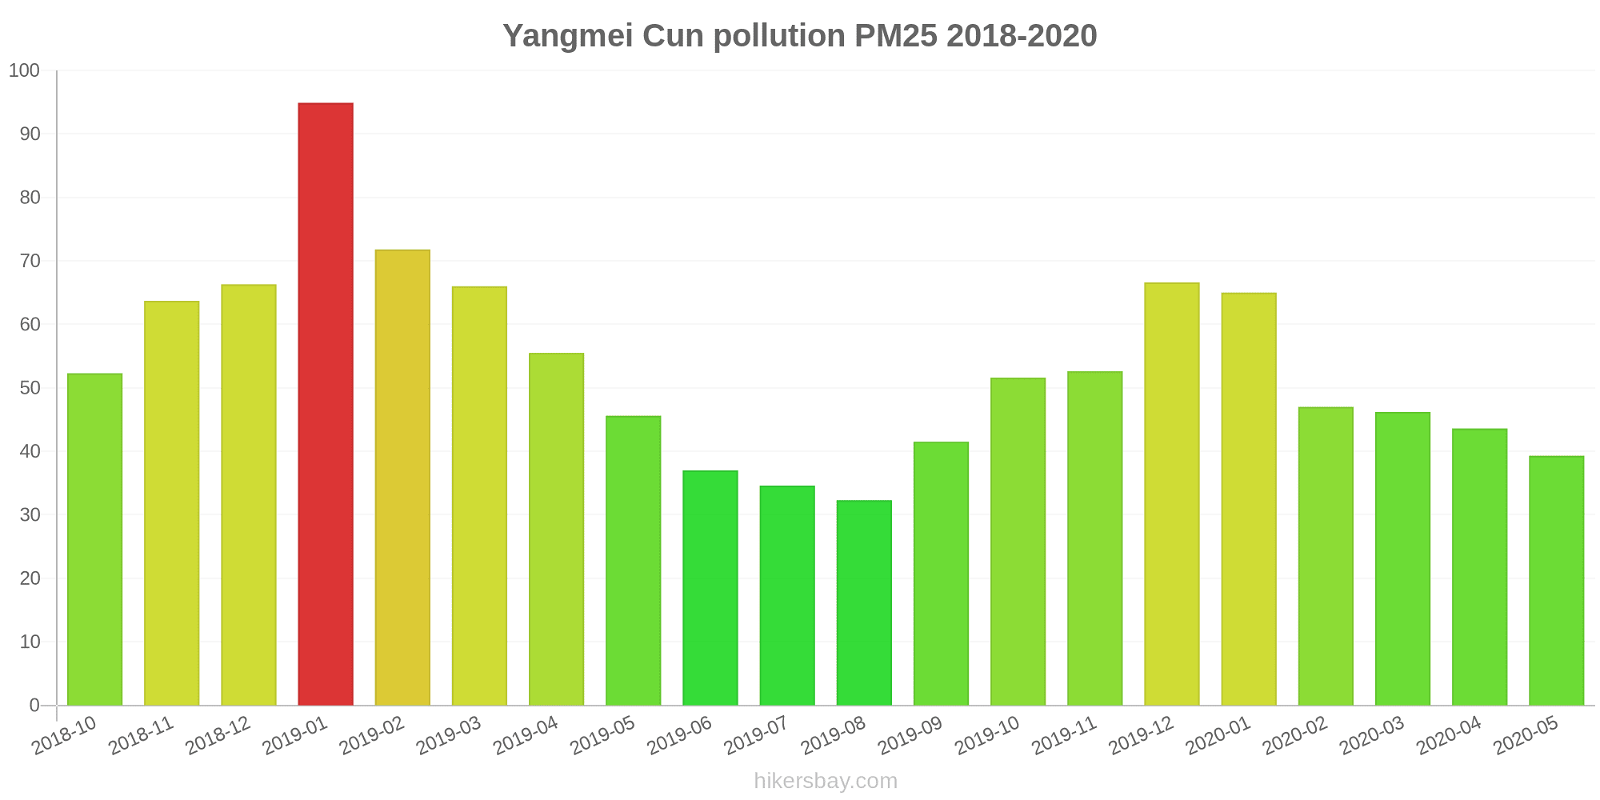
What is the current level of PM2.5 in Yangmei Cun? (particulate matter (PM2.5) dust)
Today's PM2.5 level is:
2 (Good)
For comparison, the highest level of PM2.5 in Yangmei Cun in the last 7 days was: 24 (Friday, May 27, 2022) and the lowest: 24 (Friday, May 27, 2022).
The highest PM2.5 values were recorded: 95 (January 2019).
The lowest level of particulate matter PM2.5 pollution occurs in month: August (32).
How high is the CO level? (carbon monoxide (CO))
100 (Good)
How high is the level of NO2? (nitrogen dioxide (NO2))
8 (Good)
How is the O3 level today in Yangmei Cun? (ozone (O3))
0 (Good)
What is the level of SO2 pollution? (sulfur dioxide (SO2))
9 (Good)
Current data Friday, May 27, 2022, 12:00 PM
PM10 7 (Good)
PM2,5 2 (Good)
CO 100 (Good)
NO2 8 (Good)
O3 0 (Good)
SO2 9 (Good)
Data on air pollution from recent days in Yangmei Cun
index
2022-05-27
pm10
32
Moderate
pm25
24
Moderate
co
468
Good
no2
21
Good
o3
32
Good
so2
5
Good
data source »
Air pollution in Yangmei Cun from October 2018 to May 2020
index
2020-05
2020-04
2020-03
2020-02
2020-01
2019-12
2019-11
2019-10
2019-09
2019-08
2019-07
2019-06
2019-05
2019-04
2019-03
2019-02
2019-01
2018-12
2018-11
2018-10
pm25
39 (Unhealthy for Sensitive Groups)
44 (Unhealthy for Sensitive Groups)
46 (Unhealthy for Sensitive Groups)
47 (Unhealthy for Sensitive Groups)
65 (Unhealthy)
67 (Unhealthy)
53 (Unhealthy for Sensitive Groups)
52 (Unhealthy for Sensitive Groups)
42 (Unhealthy for Sensitive Groups)
32 (Moderate)
35 (Moderate)
37 (Unhealthy for Sensitive Groups)
46 (Unhealthy for Sensitive Groups)
56 (Unhealthy)
66 (Unhealthy)
72 (Unhealthy)
95 (Very Unhealthy)
66 (Unhealthy)
64 (Unhealthy)
52 (Unhealthy for Sensitive Groups)
co
996 (Good)
877 (Good)
819 (Good)
921 (Good)
1 (Good)
1 (Good)
938 (Good)
679 (Good)
718 (Good)
792 (Good)
780 (Good)
931 (Good)
860 (Good)
1 (Good)
1 (Good)
1 (Good)
1 (Good)
1 (Good)
1 (Good)
986 (Good)
no2
17 (Good)
45 (Moderate)
37 (Good)
25 (Good)
34 (Good)
61 (Moderate)
40 (Good)
33 (Good)
23 (Good)
18 (Good)
21 (Good)
19 (Good)
27 (Good)
33 (Good)
38 (Good)
30 (Good)
50 (Moderate)
44 (Moderate)
41 (Moderate)
31 (Good)
o3
143 (Unhealthy for Sensitive Groups)
134 (Unhealthy for Sensitive Groups)
102 (Moderate)
86 (Moderate)
55 (Good)
62 (Good)
103 (Moderate)
119 (Moderate)
176 (Unhealthy)
172 (Unhealthy)
136 (Unhealthy for Sensitive Groups)
122 (Unhealthy for Sensitive Groups)
128 (Unhealthy for Sensitive Groups)
105 (Moderate)
92 (Moderate)
51 (Good)
48 (Good)
46 (Good)
72 (Moderate)
92 (Moderate)
pm10
69 (Unhealthy for Sensitive Groups)
84 (Unhealthy)
75 (Unhealthy for Sensitive Groups)
64 (Unhealthy for Sensitive Groups)
80 (Unhealthy)
97 (Unhealthy)
99 (Unhealthy)
102 (Unhealthy)
72 (Unhealthy for Sensitive Groups)
54 (Unhealthy for Sensitive Groups)
56 (Unhealthy for Sensitive Groups)
62 (Unhealthy for Sensitive Groups)
80 (Unhealthy)
87 (Unhealthy)
98 (Unhealthy)
88 (Unhealthy)
120 (Very Unhealthy)
92 (Unhealthy)
92 (Unhealthy)
87 (Unhealthy)
so2
16 (Good)
21 (Good)
18 (Good)
19 (Good)
15 (Good)
18 (Good)
22 (Good)
27 (Good)
23 (Good)
26 (Good)
27 (Good)
25 (Good)
27 (Good)
25 (Good)
26 (Good)
20 (Good)
24 (Good)
16 (Good)
15 (Good)
15 (Good)
data source »
Tongling Shi Gong Lu Ju
Friday, May 27, 2022, 12:00 PM
PM10 6.7 (Good)
particulate matter (PM10) suspended dust
PM2,5 1.7 (Good)
particulate matter (PM2.5) dust
CO 100 (Good)
carbon monoxide (CO)
NO2 7.6 (Good)
nitrogen dioxide (NO2)
O3 0.02 (Good)
ozone (O3)
SO2 8.6 (Good)
sulfur dioxide (SO2)
Tongling Shi Gong Lu Ju
index
2022-05-27
pm10
32
pm25
24
co
468
no2
21
o3
32
so2
4.6
市公路局
2018-10 2020-05

index
2020-05
2020-04
2020-03
2020-02
2020-01
2019-12
2019-11
2019-10
2019-09
2019-08
2019-07
2019-06
2019-05
2019-04
2019-03
2019-02
2019-01
2018-12
2018-11
2018-10
pm25
39
44
46
47
65
67
53
52
42
32
35
37
46
56
66
72
95
66
64
52
co
996
877
819
921
1
1
938
679
718
792
780
931
860
1
1
1
1
1
1
986
no2
17
45
37
25
34
61
40
33
23
18
21
19
27
33
38
30
50
44
41
31
o3
143
134
102
86
55
62
103
119
176
172
136
122
128
105
92
51
48
46
72
92
pm10
69
84
75
64
80
97
99
102
72
54
56
62
80
87
98
88
120
92
92
87
so2
16
21
18
19
15
18
22
27
23
26
27
25
27
25
26
20
24
16
15
15
* Pollution data source:
https://openaq.org
(ChinaAQIData)
The data is licensed under CC-By 4.0
PM10 7 (Good)
PM2,5 2 (Good)
CO 100 (Good)
NO2 8 (Good)
O3 0 (Good)
SO2 9 (Good)
Data on air pollution from recent days in Yangmei Cun
| index | 2022-05-27 |
|---|---|
| pm10 | 32 Moderate |
| pm25 | 24 Moderate |
| co | 468 Good |
| no2 | 21 Good |
| o3 | 32 Good |
| so2 | 5 Good |

| index | 2020-05 | 2020-04 | 2020-03 | 2020-02 | 2020-01 | 2019-12 | 2019-11 | 2019-10 | 2019-09 | 2019-08 | 2019-07 | 2019-06 | 2019-05 | 2019-04 | 2019-03 | 2019-02 | 2019-01 | 2018-12 | 2018-11 | 2018-10 |
|---|---|---|---|---|---|---|---|---|---|---|---|---|---|---|---|---|---|---|---|---|
| pm25 | 39 (Unhealthy for Sensitive Groups) | 44 (Unhealthy for Sensitive Groups) | 46 (Unhealthy for Sensitive Groups) | 47 (Unhealthy for Sensitive Groups) | 65 (Unhealthy) | 67 (Unhealthy) | 53 (Unhealthy for Sensitive Groups) | 52 (Unhealthy for Sensitive Groups) | 42 (Unhealthy for Sensitive Groups) | 32 (Moderate) | 35 (Moderate) | 37 (Unhealthy for Sensitive Groups) | 46 (Unhealthy for Sensitive Groups) | 56 (Unhealthy) | 66 (Unhealthy) | 72 (Unhealthy) | 95 (Very Unhealthy) | 66 (Unhealthy) | 64 (Unhealthy) | 52 (Unhealthy for Sensitive Groups) |
| co | 996 (Good) | 877 (Good) | 819 (Good) | 921 (Good) | 1 (Good) | 1 (Good) | 938 (Good) | 679 (Good) | 718 (Good) | 792 (Good) | 780 (Good) | 931 (Good) | 860 (Good) | 1 (Good) | 1 (Good) | 1 (Good) | 1 (Good) | 1 (Good) | 1 (Good) | 986 (Good) |
| no2 | 17 (Good) | 45 (Moderate) | 37 (Good) | 25 (Good) | 34 (Good) | 61 (Moderate) | 40 (Good) | 33 (Good) | 23 (Good) | 18 (Good) | 21 (Good) | 19 (Good) | 27 (Good) | 33 (Good) | 38 (Good) | 30 (Good) | 50 (Moderate) | 44 (Moderate) | 41 (Moderate) | 31 (Good) |
| o3 | 143 (Unhealthy for Sensitive Groups) | 134 (Unhealthy for Sensitive Groups) | 102 (Moderate) | 86 (Moderate) | 55 (Good) | 62 (Good) | 103 (Moderate) | 119 (Moderate) | 176 (Unhealthy) | 172 (Unhealthy) | 136 (Unhealthy for Sensitive Groups) | 122 (Unhealthy for Sensitive Groups) | 128 (Unhealthy for Sensitive Groups) | 105 (Moderate) | 92 (Moderate) | 51 (Good) | 48 (Good) | 46 (Good) | 72 (Moderate) | 92 (Moderate) |
| pm10 | 69 (Unhealthy for Sensitive Groups) | 84 (Unhealthy) | 75 (Unhealthy for Sensitive Groups) | 64 (Unhealthy for Sensitive Groups) | 80 (Unhealthy) | 97 (Unhealthy) | 99 (Unhealthy) | 102 (Unhealthy) | 72 (Unhealthy for Sensitive Groups) | 54 (Unhealthy for Sensitive Groups) | 56 (Unhealthy for Sensitive Groups) | 62 (Unhealthy for Sensitive Groups) | 80 (Unhealthy) | 87 (Unhealthy) | 98 (Unhealthy) | 88 (Unhealthy) | 120 (Very Unhealthy) | 92 (Unhealthy) | 92 (Unhealthy) | 87 (Unhealthy) |
| so2 | 16 (Good) | 21 (Good) | 18 (Good) | 19 (Good) | 15 (Good) | 18 (Good) | 22 (Good) | 27 (Good) | 23 (Good) | 26 (Good) | 27 (Good) | 25 (Good) | 27 (Good) | 25 (Good) | 26 (Good) | 20 (Good) | 24 (Good) | 16 (Good) | 15 (Good) | 15 (Good) |
PM10 6.7 (Good)
particulate matter (PM10) suspended dustPM2,5 1.7 (Good)
particulate matter (PM2.5) dustCO 100 (Good)
carbon monoxide (CO)NO2 7.6 (Good)
nitrogen dioxide (NO2)O3 0.02 (Good)
ozone (O3)SO2 8.6 (Good)
sulfur dioxide (SO2)Tongling Shi Gong Lu Ju
| index | 2022-05-27 |
|---|---|
| pm10 | 32 |
| pm25 | 24 |
| co | 468 |
| no2 | 21 |
| o3 | 32 |
| so2 | 4.6 |
市公路局

| index | 2020-05 | 2020-04 | 2020-03 | 2020-02 | 2020-01 | 2019-12 | 2019-11 | 2019-10 | 2019-09 | 2019-08 | 2019-07 | 2019-06 | 2019-05 | 2019-04 | 2019-03 | 2019-02 | 2019-01 | 2018-12 | 2018-11 | 2018-10 |
|---|---|---|---|---|---|---|---|---|---|---|---|---|---|---|---|---|---|---|---|---|
| pm25 | 39 | 44 | 46 | 47 | 65 | 67 | 53 | 52 | 42 | 32 | 35 | 37 | 46 | 56 | 66 | 72 | 95 | 66 | 64 | 52 |
| co | 996 | 877 | 819 | 921 | 1 | 1 | 938 | 679 | 718 | 792 | 780 | 931 | 860 | 1 | 1 | 1 | 1 | 1 | 1 | 986 |
| no2 | 17 | 45 | 37 | 25 | 34 | 61 | 40 | 33 | 23 | 18 | 21 | 19 | 27 | 33 | 38 | 30 | 50 | 44 | 41 | 31 |
| o3 | 143 | 134 | 102 | 86 | 55 | 62 | 103 | 119 | 176 | 172 | 136 | 122 | 128 | 105 | 92 | 51 | 48 | 46 | 72 | 92 |
| pm10 | 69 | 84 | 75 | 64 | 80 | 97 | 99 | 102 | 72 | 54 | 56 | 62 | 80 | 87 | 98 | 88 | 120 | 92 | 92 | 87 |
| so2 | 16 | 21 | 18 | 19 | 15 | 18 | 22 | 27 | 23 | 26 | 27 | 25 | 27 | 25 | 26 | 20 | 24 | 16 | 15 | 15 |