Air Pollution in Xiliu Yougou: Real-time Air Quality Index and smog alert.
Pollution and air quality forecast for Xiliu Yougou. Today is Tuesday, June 16, 2026. The following air pollution values have been recorded for Xiliu Yougou:- particulate matter (PM10) suspended dust - 179 (Very bad Hazardous)
- particulate matter (PM2.5) dust - 35 (Unhealthy for Sensitive Groups)
- ozone (O3) - 0 (Good)
- nitrogen dioxide (NO2) - 0 (Good)
- sulfur dioxide (SO2) - 0 (Good)

What is the air quality in Xiliu Yougou today? Is the air polluted in Xiliu Yougou?. Is there smog?
What is the level of PM10 today in Xiliu Yougou? (particulate matter (PM10) suspended dust)
The current level of particulate matter PM10 in Xiliu Yougou is:
179 (Very bad Hazardous)
The highest PM10 values usually occur in month: 140 (January 2019).
The lowest value of particulate matter PM10 pollution in Xiliu Yougou is usually recorded in: August (43).
What is the current level of PM2.5 in Xiliu Yougou? (particulate matter (PM2.5) dust)
Today's PM2.5 level is:
35 (Unhealthy for Sensitive Groups)
For comparison, the highest level of PM2.5 in Xiliu Yougou in the last 7 days was: 56 (Friday, May 27, 2022) and the lowest: 56 (Friday, May 27, 2022).
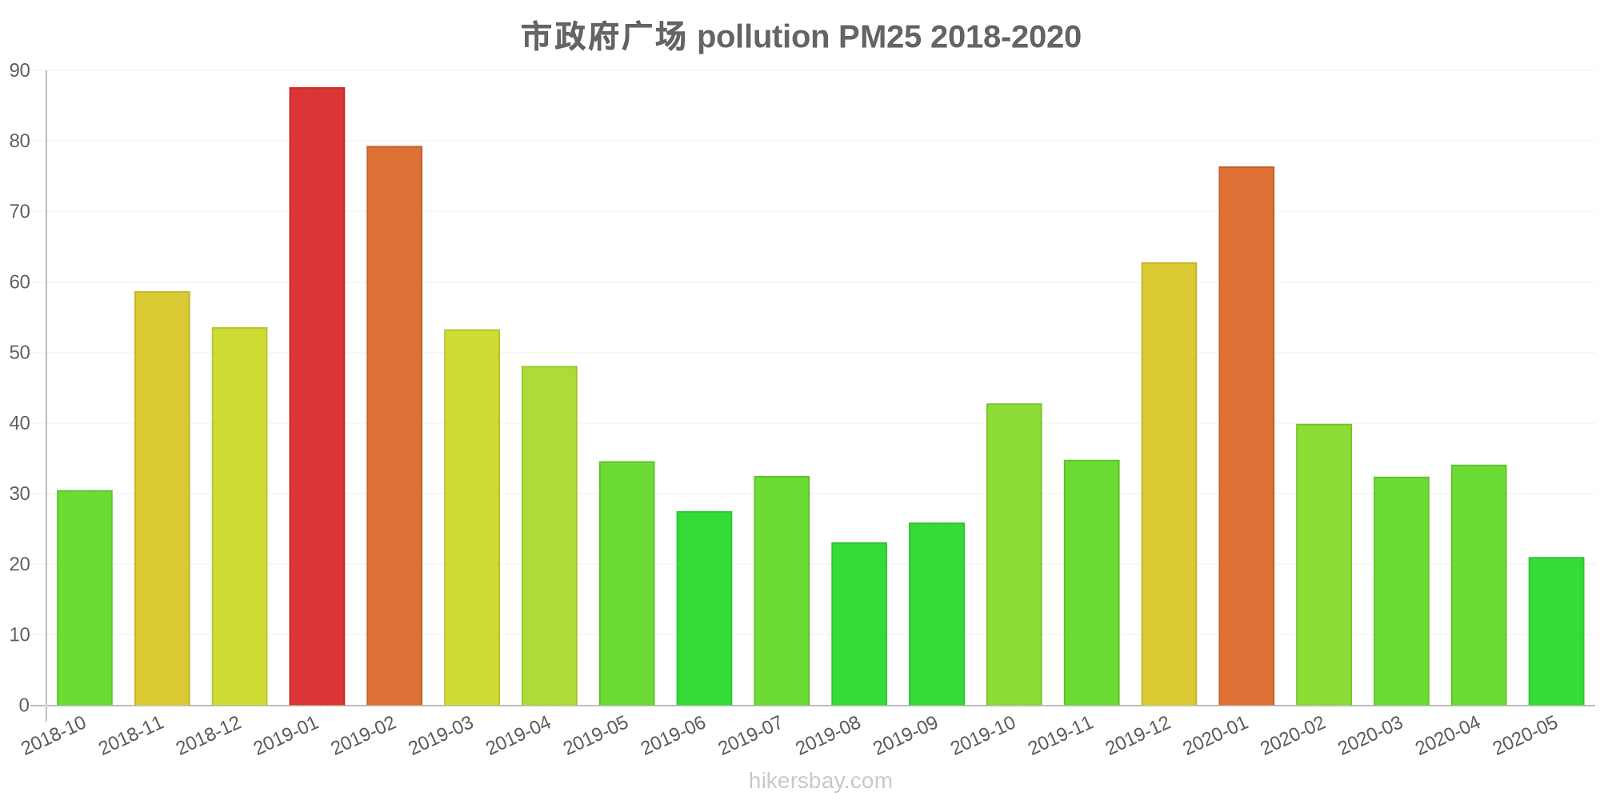
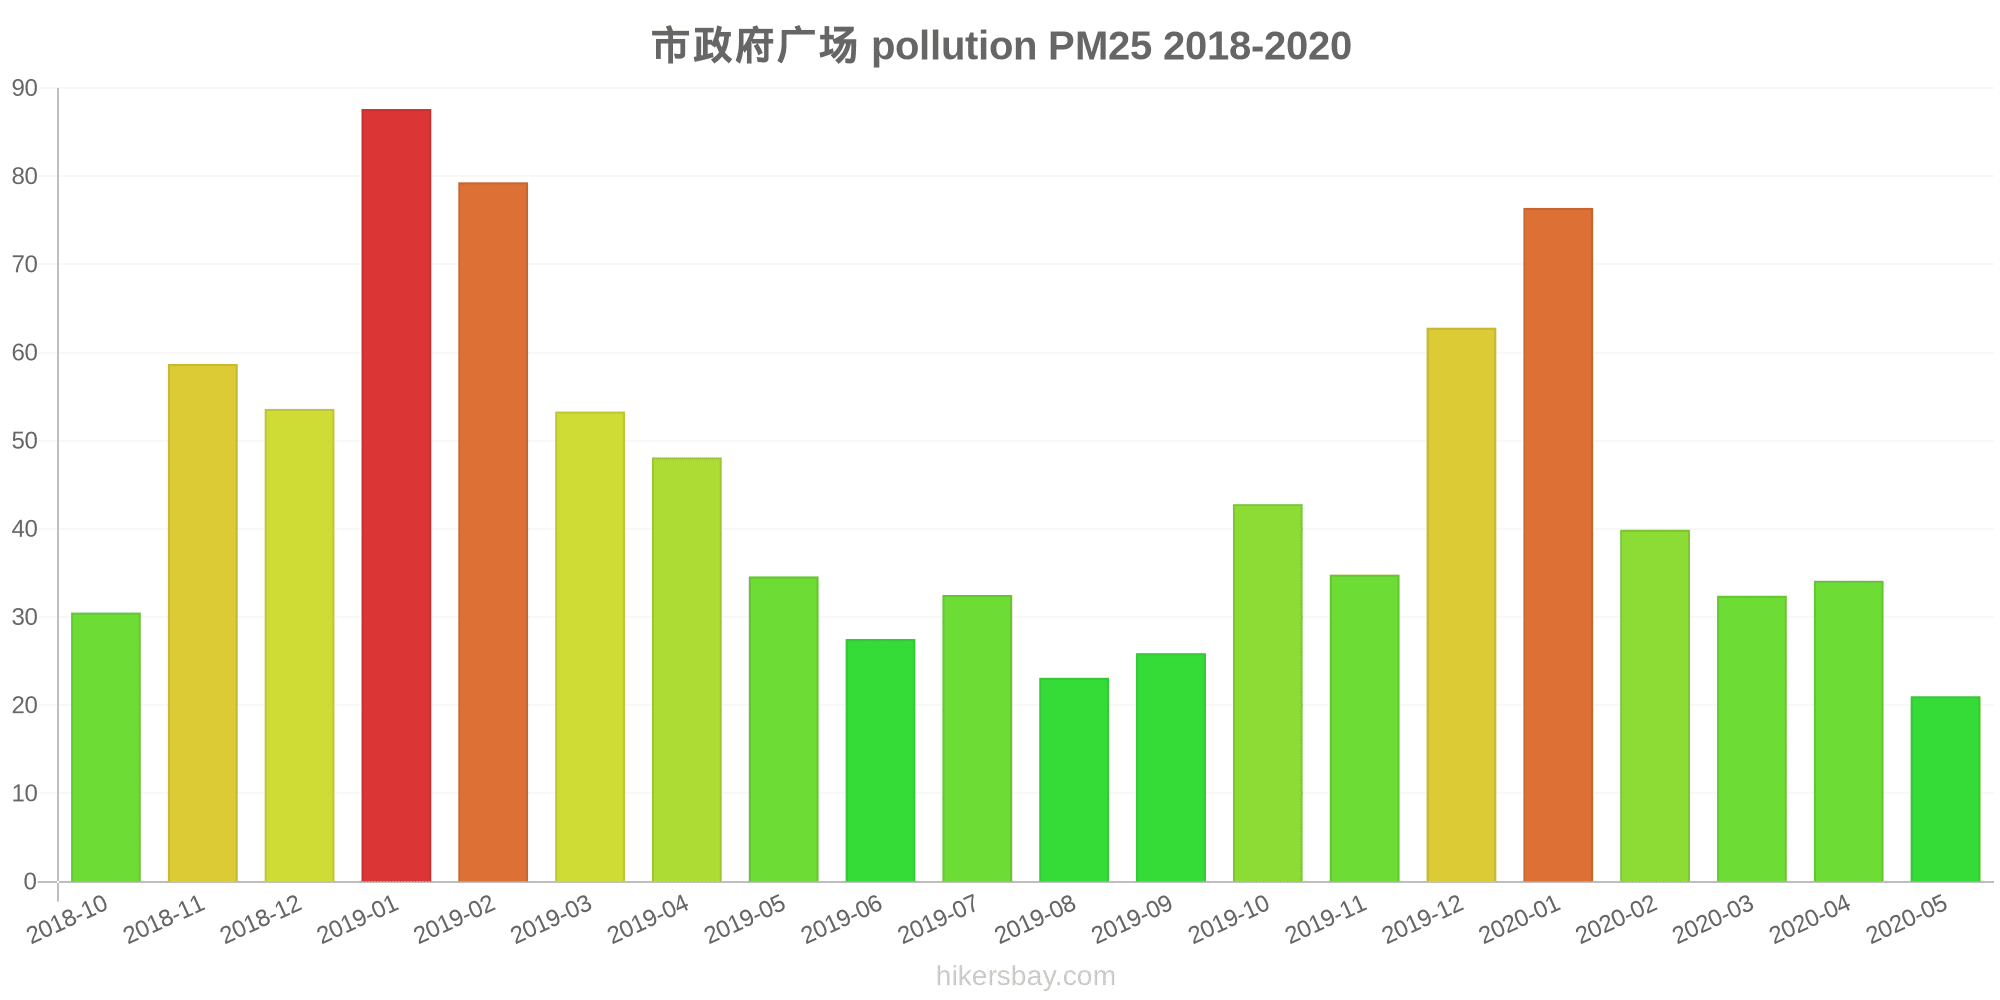
The highest PM2.5 values were recorded: 88 (January 2019).
The lowest level of particulate matter PM2.5 pollution occurs in month: May (21).
How is the O3 level today in Xiliu Yougou? (ozone (O3))
0 (Good)
How high is the level of NO2? (nitrogen dioxide (NO2))
0 (Good)
What is the level of SO2 pollution? (sulfur dioxide (SO2))
0 (Good)
Current data Friday, May 27, 2022, 12:00 PM
PM10 179 (Very bad Hazardous)
PM2,5 35 (Unhealthy for Sensitive Groups)
O3 0 (Good)
NO2 0 (Good)
SO2 0 (Good)
Data on air pollution from recent days in Xiliu Yougou
index
2022-05-27
pm10
56
Unhealthy for Sensitive Groups
pm25
56
Unhealthy
o3
0
Good
no2
0
Good
so2
0
Good
data source »
Air pollution in Xiliu Yougou from October 2018 to May 2020

index
2020-05
2020-04
2020-03
2020-02
2020-01
2019-12
2019-11
2019-10
2019-09
2019-08
2019-07
2019-06
2019-05
2019-04
2019-03
2019-02
2019-01
2018-12
2018-11
2018-10
pm25
21 (Moderate)
34 (Moderate)
32 (Moderate)
40 (Unhealthy for Sensitive Groups)
76 (Very Unhealthy)
63 (Unhealthy)
35 (Moderate)
43 (Unhealthy for Sensitive Groups)
26 (Moderate)
23 (Moderate)
33 (Moderate)
28 (Moderate)
35 (Moderate)
48 (Unhealthy for Sensitive Groups)
53 (Unhealthy for Sensitive Groups)
79 (Very Unhealthy)
88 (Very Unhealthy)
54 (Unhealthy for Sensitive Groups)
59 (Unhealthy)
31 (Moderate)
co
315 (Good)
562 (Good)
499 (Good)
489 (Good)
1 (Good)
992 (Good)
496 (Good)
614 (Good)
368 (Good)
396 (Good)
495 (Good)
277 (Good)
346 (Good)
321 (Good)
437 (Good)
712 (Good)
943 (Good)
710 (Good)
603 (Good)
489 (Good)
no2
19 (Good)
37 (Good)
30 (Good)
20 (Good)
39 (Good)
48 (Moderate)
36 (Good)
41 (Moderate)
21 (Good)
21 (Good)
26 (Good)
24 (Good)
25 (Good)
24 (Good)
33 (Good)
38 (Good)
59 (Moderate)
42 (Moderate)
46 (Moderate)
41 (Moderate)
o3
131 (Unhealthy for Sensitive Groups)
143 (Unhealthy for Sensitive Groups)
122 (Unhealthy for Sensitive Groups)
98 (Moderate)
84 (Moderate)
68 (Good)
90 (Moderate)
127 (Unhealthy for Sensitive Groups)
166 (Unhealthy)
137 (Unhealthy for Sensitive Groups)
153 (Unhealthy)
160 (Unhealthy)
166 (Unhealthy)
119 (Moderate)
113 (Moderate)
91 (Moderate)
68 (Good)
66 (Good)
94 (Moderate)
103 (Moderate)
pm10
57 (Unhealthy for Sensitive Groups)
85 (Unhealthy)
80 (Unhealthy)
58 (Unhealthy for Sensitive Groups)
104 (Unhealthy)
98 (Unhealthy)
90 (Unhealthy)
108 (Unhealthy)
58 (Unhealthy for Sensitive Groups)
43 (Moderate)
56 (Unhealthy for Sensitive Groups)
53 (Unhealthy for Sensitive Groups)
78 (Unhealthy for Sensitive Groups)
82 (Unhealthy)
97 (Unhealthy)
118 (Very Unhealthy)
140 (Very Unhealthy)
99 (Unhealthy)
116 (Very Unhealthy)
74 (Unhealthy for Sensitive Groups)
so2
7.5 (Good)
8.8 (Good)
9.7 (Good)
6.9 (Good)
12 (Good)
12 (Good)
9.2 (Good)
9.6 (Good)
7.6 (Good)
7.2 (Good)
5.6 (Good)
4.7 (Good)
8.3 (Good)
5.9 (Good)
10 (Good)
8.2 (Good)
13 (Good)
9.6 (Good)
7.5 (Good)
8.3 (Good)
data source »
市政府广场
Friday, May 27, 2022, 12:00 PM
PM10 179 (Very bad Hazardous)
particulate matter (PM10) suspended dust
PM2,5 35 (Unhealthy for Sensitive Groups)
particulate matter (PM2.5) dust
O3 0.04 (Good)
ozone (O3)
NO2 0 (Good)
nitrogen dioxide (NO2)
SO2 0 (Good)
sulfur dioxide (SO2)
市政府广场
index
2022-05-27
pm10
56
pm25
56
o3
0.03
no2
0
so2
0
市政府广场
2018-10 2020-05
index
2020-05
2020-04
2020-03
2020-02
2020-01
2019-12
2019-11
2019-10
2019-09
2019-08
2019-07
2019-06
2019-05
2019-04
2019-03
2019-02
2019-01
2018-12
2018-11
2018-10
pm25
21
34
32
40
76
63
35
43
26
23
33
28
35
48
53
79
88
54
59
31
co
315
562
499
489
1
992
496
614
368
396
495
277
346
321
437
712
943
710
603
489
no2
19
37
30
20
39
48
36
41
21
21
26
24
25
24
33
38
59
42
46
41
o3
131
143
122
98
84
68
90
127
166
137
153
160
166
119
113
91
68
66
94
103
pm10
57
85
80
58
104
98
90
108
58
43
56
53
78
82
97
118
140
99
116
74
so2
7.5
8.8
9.7
6.9
12
12
9.2
9.6
7.6
7.2
5.6
4.7
8.3
5.9
10
8.2
13
9.6
7.5
8.3
* Pollution data source:
https://openaq.org
(ChinaAQIData)
The data is licensed under CC-By 4.0
PM10 179 (Very bad Hazardous)
PM2,5 35 (Unhealthy for Sensitive Groups)
O3 0 (Good)
NO2 0 (Good)
SO2 0 (Good)
Data on air pollution from recent days in Xiliu Yougou
| index | 2022-05-27 |
|---|---|
| pm10 | 56 Unhealthy for Sensitive Groups |
| pm25 | 56 Unhealthy |
| o3 | 0 Good |
| no2 | 0 Good |
| so2 | 0 Good |

| index | 2020-05 | 2020-04 | 2020-03 | 2020-02 | 2020-01 | 2019-12 | 2019-11 | 2019-10 | 2019-09 | 2019-08 | 2019-07 | 2019-06 | 2019-05 | 2019-04 | 2019-03 | 2019-02 | 2019-01 | 2018-12 | 2018-11 | 2018-10 |
|---|---|---|---|---|---|---|---|---|---|---|---|---|---|---|---|---|---|---|---|---|
| pm25 | 21 (Moderate) | 34 (Moderate) | 32 (Moderate) | 40 (Unhealthy for Sensitive Groups) | 76 (Very Unhealthy) | 63 (Unhealthy) | 35 (Moderate) | 43 (Unhealthy for Sensitive Groups) | 26 (Moderate) | 23 (Moderate) | 33 (Moderate) | 28 (Moderate) | 35 (Moderate) | 48 (Unhealthy for Sensitive Groups) | 53 (Unhealthy for Sensitive Groups) | 79 (Very Unhealthy) | 88 (Very Unhealthy) | 54 (Unhealthy for Sensitive Groups) | 59 (Unhealthy) | 31 (Moderate) |
| co | 315 (Good) | 562 (Good) | 499 (Good) | 489 (Good) | 1 (Good) | 992 (Good) | 496 (Good) | 614 (Good) | 368 (Good) | 396 (Good) | 495 (Good) | 277 (Good) | 346 (Good) | 321 (Good) | 437 (Good) | 712 (Good) | 943 (Good) | 710 (Good) | 603 (Good) | 489 (Good) |
| no2 | 19 (Good) | 37 (Good) | 30 (Good) | 20 (Good) | 39 (Good) | 48 (Moderate) | 36 (Good) | 41 (Moderate) | 21 (Good) | 21 (Good) | 26 (Good) | 24 (Good) | 25 (Good) | 24 (Good) | 33 (Good) | 38 (Good) | 59 (Moderate) | 42 (Moderate) | 46 (Moderate) | 41 (Moderate) |
| o3 | 131 (Unhealthy for Sensitive Groups) | 143 (Unhealthy for Sensitive Groups) | 122 (Unhealthy for Sensitive Groups) | 98 (Moderate) | 84 (Moderate) | 68 (Good) | 90 (Moderate) | 127 (Unhealthy for Sensitive Groups) | 166 (Unhealthy) | 137 (Unhealthy for Sensitive Groups) | 153 (Unhealthy) | 160 (Unhealthy) | 166 (Unhealthy) | 119 (Moderate) | 113 (Moderate) | 91 (Moderate) | 68 (Good) | 66 (Good) | 94 (Moderate) | 103 (Moderate) |
| pm10 | 57 (Unhealthy for Sensitive Groups) | 85 (Unhealthy) | 80 (Unhealthy) | 58 (Unhealthy for Sensitive Groups) | 104 (Unhealthy) | 98 (Unhealthy) | 90 (Unhealthy) | 108 (Unhealthy) | 58 (Unhealthy for Sensitive Groups) | 43 (Moderate) | 56 (Unhealthy for Sensitive Groups) | 53 (Unhealthy for Sensitive Groups) | 78 (Unhealthy for Sensitive Groups) | 82 (Unhealthy) | 97 (Unhealthy) | 118 (Very Unhealthy) | 140 (Very Unhealthy) | 99 (Unhealthy) | 116 (Very Unhealthy) | 74 (Unhealthy for Sensitive Groups) |
| so2 | 7.5 (Good) | 8.8 (Good) | 9.7 (Good) | 6.9 (Good) | 12 (Good) | 12 (Good) | 9.2 (Good) | 9.6 (Good) | 7.6 (Good) | 7.2 (Good) | 5.6 (Good) | 4.7 (Good) | 8.3 (Good) | 5.9 (Good) | 10 (Good) | 8.2 (Good) | 13 (Good) | 9.6 (Good) | 7.5 (Good) | 8.3 (Good) |
PM10 179 (Very bad Hazardous)
particulate matter (PM10) suspended dustPM2,5 35 (Unhealthy for Sensitive Groups)
particulate matter (PM2.5) dustO3 0.04 (Good)
ozone (O3)NO2 0 (Good)
nitrogen dioxide (NO2)SO2 0 (Good)
sulfur dioxide (SO2)市政府广场
| index | 2022-05-27 |
|---|---|
| pm10 | 56 |
| pm25 | 56 |
| o3 | 0.03 |
| no2 | 0 |
| so2 | 0 |
市政府广场
| index | 2020-05 | 2020-04 | 2020-03 | 2020-02 | 2020-01 | 2019-12 | 2019-11 | 2019-10 | 2019-09 | 2019-08 | 2019-07 | 2019-06 | 2019-05 | 2019-04 | 2019-03 | 2019-02 | 2019-01 | 2018-12 | 2018-11 | 2018-10 |
|---|---|---|---|---|---|---|---|---|---|---|---|---|---|---|---|---|---|---|---|---|
| pm25 | 21 | 34 | 32 | 40 | 76 | 63 | 35 | 43 | 26 | 23 | 33 | 28 | 35 | 48 | 53 | 79 | 88 | 54 | 59 | 31 |
| co | 315 | 562 | 499 | 489 | 1 | 992 | 496 | 614 | 368 | 396 | 495 | 277 | 346 | 321 | 437 | 712 | 943 | 710 | 603 | 489 |
| no2 | 19 | 37 | 30 | 20 | 39 | 48 | 36 | 41 | 21 | 21 | 26 | 24 | 25 | 24 | 33 | 38 | 59 | 42 | 46 | 41 |
| o3 | 131 | 143 | 122 | 98 | 84 | 68 | 90 | 127 | 166 | 137 | 153 | 160 | 166 | 119 | 113 | 91 | 68 | 66 | 94 | 103 |
| pm10 | 57 | 85 | 80 | 58 | 104 | 98 | 90 | 108 | 58 | 43 | 56 | 53 | 78 | 82 | 97 | 118 | 140 | 99 | 116 | 74 |
| so2 | 7.5 | 8.8 | 9.7 | 6.9 | 12 | 12 | 9.2 | 9.6 | 7.6 | 7.2 | 5.6 | 4.7 | 8.3 | 5.9 | 10 | 8.2 | 13 | 9.6 | 7.5 | 8.3 |