Air Pollution in Guihuawan: Real-time Air Quality Index and smog alert.
Pollution and air quality forecast for Guihuawan. Today is Tuesday, June 2, 2026. The following air pollution values have been recorded for Guihuawan:- particulate matter (PM10) suspended dust - 179 (Very bad Hazardous)
- particulate matter (PM2.5) dust - 35 (Unhealthy for Sensitive Groups)
- ozone (O3) - 0 (Good)
- nitrogen dioxide (NO2) - 0 (Good)
- sulfur dioxide (SO2) - 0 (Good)

What is the air quality in Guihuawan today? Is the air polluted in Guihuawan?. Is there smog?
What is the level of PM10 today in Guihuawan? (particulate matter (PM10) suspended dust)
The current level of particulate matter PM10 in Guihuawan is:
179 (Very bad Hazardous)
The highest PM10 values usually occur in month: 133 (January 2019).
The lowest value of particulate matter PM10 pollution in Guihuawan is usually recorded in: July (44).
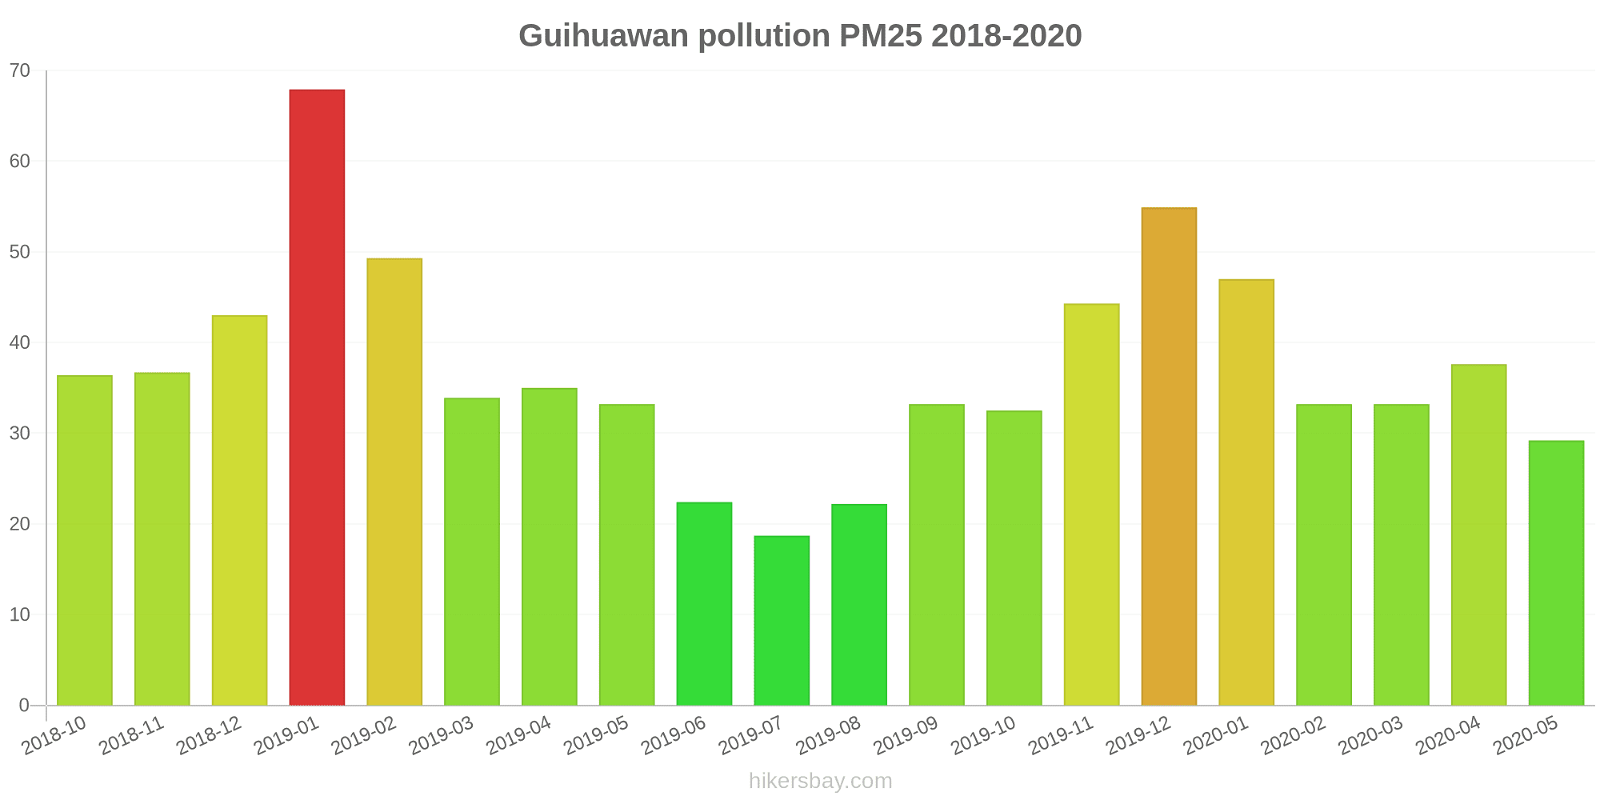
What is the current level of PM2.5 in Guihuawan? (particulate matter (PM2.5) dust)
Today's PM2.5 level is:
35 (Unhealthy for Sensitive Groups)
For comparison, the highest level of PM2.5 in Guihuawan in the last 7 days was: 56 (Friday, May 27, 2022) and the lowest: 56 (Friday, May 27, 2022).
The highest PM2.5 values were recorded: 68 (January 2019).
The lowest level of particulate matter PM2.5 pollution occurs in month: July (19).
How is the O3 level today in Guihuawan? (ozone (O3))
0 (Good)
How high is the level of NO2? (nitrogen dioxide (NO2))
0 (Good)
What is the level of SO2 pollution? (sulfur dioxide (SO2))
0 (Good)
Current data Friday, May 27, 2022, 12:00 PM
PM10 179 (Very bad Hazardous)
PM2,5 35 (Unhealthy for Sensitive Groups)
O3 0 (Good)
NO2 0 (Good)
SO2 0 (Good)
Data on air pollution from recent days in Guihuawan
index
2022-05-27
pm10
56
Unhealthy for Sensitive Groups
pm25
56
Unhealthy
o3
0
Good
no2
0
Good
so2
0
Good
data source »
Air pollution in Guihuawan from October 2018 to May 2020
index
2020-05
2020-04
2020-03
2020-02
2020-01
2019-12
2019-11
2019-10
2019-09
2019-08
2019-07
2019-06
2019-05
2019-04
2019-03
2019-02
2019-01
2018-12
2018-11
2018-10
pm25
29 (Moderate)
38 (Unhealthy for Sensitive Groups)
33 (Moderate)
33 (Moderate)
47 (Unhealthy for Sensitive Groups)
55 (Unhealthy for Sensitive Groups)
44 (Unhealthy for Sensitive Groups)
33 (Moderate)
33 (Moderate)
22 (Moderate)
19 (Moderate)
22 (Moderate)
33 (Moderate)
35 (Unhealthy for Sensitive Groups)
34 (Moderate)
49 (Unhealthy for Sensitive Groups)
68 (Unhealthy)
43 (Unhealthy for Sensitive Groups)
37 (Unhealthy for Sensitive Groups)
36 (Unhealthy for Sensitive Groups)
co
1 (Good)
1 (Good)
1 (Good)
1 (Good)
1 (Good)
1 (Good)
930 (Good)
894 (Good)
967 (Good)
941 (Good)
884 (Good)
885 (Good)
989 (Good)
1 (Good)
992 (Good)
1 (Good)
1 (Good)
925 (Good)
1 (Good)
986 (Good)
no2
23 (Good)
35 (Good)
25 (Good)
21 (Good)
35 (Good)
60 (Moderate)
46 (Moderate)
33 (Good)
26 (Good)
20 (Good)
23 (Good)
28 (Good)
29 (Good)
32 (Good)
39 (Good)
31 (Good)
48 (Moderate)
42 (Moderate)
42 (Moderate)
44 (Moderate)
o3
147 (Unhealthy for Sensitive Groups)
141 (Unhealthy for Sensitive Groups)
99 (Moderate)
81 (Moderate)
52 (Good)
59 (Good)
97 (Moderate)
119 (Moderate)
179 (Unhealthy)
170 (Unhealthy)
138 (Unhealthy for Sensitive Groups)
162 (Unhealthy)
152 (Unhealthy)
123 (Unhealthy for Sensitive Groups)
107 (Moderate)
56 (Good)
54 (Good)
45 (Good)
84 (Moderate)
114 (Moderate)
pm10
66 (Unhealthy for Sensitive Groups)
78 (Unhealthy for Sensitive Groups)
58 (Unhealthy for Sensitive Groups)
46 (Moderate)
68 (Unhealthy for Sensitive Groups)
103 (Unhealthy)
96 (Unhealthy)
76 (Unhealthy for Sensitive Groups)
72 (Unhealthy for Sensitive Groups)
47 (Moderate)
44 (Moderate)
53 (Unhealthy for Sensitive Groups)
80 (Unhealthy for Sensitive Groups)
75 (Unhealthy for Sensitive Groups)
91 (Unhealthy)
96 (Unhealthy)
133 (Very Unhealthy)
84 (Unhealthy)
76 (Unhealthy for Sensitive Groups)
81 (Unhealthy)
so2
15 (Good)
17 (Good)
16 (Good)
15 (Good)
11 (Good)
16 (Good)
15 (Good)
12 (Good)
14 (Good)
11 (Good)
9.4 (Good)
13 (Good)
19 (Good)
15 (Good)
11 (Good)
10 (Good)
8.8 (Good)
8.9 (Good)
9.7 (Good)
11 (Good)
data source »
沈家营
Friday, May 27, 2022, 12:00 PM
PM10 179 (Very bad Hazardous)
particulate matter (PM10) suspended dust
PM2,5 35 (Unhealthy for Sensitive Groups)
particulate matter (PM2.5) dust
O3 0.04 (Good)
ozone (O3)
NO2 0 (Good)
nitrogen dioxide (NO2)
SO2 0 (Good)
sulfur dioxide (SO2)
沈家营
index
2022-05-27
pm10
56
pm25
56
o3
0.03
no2
0
so2
0
沈家营
2018-10 2020-05

index
2020-05
2020-04
2020-03
2020-02
2020-01
2019-12
2019-11
2019-10
2019-09
2019-08
2019-07
2019-06
2019-05
2019-04
2019-03
2019-02
2019-01
2018-12
2018-11
2018-10
pm25
29
38
33
33
47
55
44
33
33
22
19
22
33
35
34
49
68
43
37
36
co
1
1
1
1
1
1
930
894
967
941
884
885
989
1
992
1
1
925
1
986
no2
23
35
25
21
35
60
46
33
26
20
23
28
29
32
39
31
48
42
42
44
o3
147
141
99
81
52
59
97
119
179
170
138
162
152
123
107
56
54
45
84
114
pm10
66
78
58
46
68
103
96
76
72
47
44
53
80
75
91
96
133
84
76
81
so2
15
17
16
15
11
16
15
12
14
11
9.4
13
19
15
11
10
8.8
8.9
9.7
11
* Pollution data source:
https://openaq.org
(ChinaAQIData)
The data is licensed under CC-By 4.0
PM10 179 (Very bad Hazardous)
PM2,5 35 (Unhealthy for Sensitive Groups)
O3 0 (Good)
NO2 0 (Good)
SO2 0 (Good)
Data on air pollution from recent days in Guihuawan
| index | 2022-05-27 |
|---|---|
| pm10 | 56 Unhealthy for Sensitive Groups |
| pm25 | 56 Unhealthy |
| o3 | 0 Good |
| no2 | 0 Good |
| so2 | 0 Good |

| index | 2020-05 | 2020-04 | 2020-03 | 2020-02 | 2020-01 | 2019-12 | 2019-11 | 2019-10 | 2019-09 | 2019-08 | 2019-07 | 2019-06 | 2019-05 | 2019-04 | 2019-03 | 2019-02 | 2019-01 | 2018-12 | 2018-11 | 2018-10 |
|---|---|---|---|---|---|---|---|---|---|---|---|---|---|---|---|---|---|---|---|---|
| pm25 | 29 (Moderate) | 38 (Unhealthy for Sensitive Groups) | 33 (Moderate) | 33 (Moderate) | 47 (Unhealthy for Sensitive Groups) | 55 (Unhealthy for Sensitive Groups) | 44 (Unhealthy for Sensitive Groups) | 33 (Moderate) | 33 (Moderate) | 22 (Moderate) | 19 (Moderate) | 22 (Moderate) | 33 (Moderate) | 35 (Unhealthy for Sensitive Groups) | 34 (Moderate) | 49 (Unhealthy for Sensitive Groups) | 68 (Unhealthy) | 43 (Unhealthy for Sensitive Groups) | 37 (Unhealthy for Sensitive Groups) | 36 (Unhealthy for Sensitive Groups) |
| co | 1 (Good) | 1 (Good) | 1 (Good) | 1 (Good) | 1 (Good) | 1 (Good) | 930 (Good) | 894 (Good) | 967 (Good) | 941 (Good) | 884 (Good) | 885 (Good) | 989 (Good) | 1 (Good) | 992 (Good) | 1 (Good) | 1 (Good) | 925 (Good) | 1 (Good) | 986 (Good) |
| no2 | 23 (Good) | 35 (Good) | 25 (Good) | 21 (Good) | 35 (Good) | 60 (Moderate) | 46 (Moderate) | 33 (Good) | 26 (Good) | 20 (Good) | 23 (Good) | 28 (Good) | 29 (Good) | 32 (Good) | 39 (Good) | 31 (Good) | 48 (Moderate) | 42 (Moderate) | 42 (Moderate) | 44 (Moderate) |
| o3 | 147 (Unhealthy for Sensitive Groups) | 141 (Unhealthy for Sensitive Groups) | 99 (Moderate) | 81 (Moderate) | 52 (Good) | 59 (Good) | 97 (Moderate) | 119 (Moderate) | 179 (Unhealthy) | 170 (Unhealthy) | 138 (Unhealthy for Sensitive Groups) | 162 (Unhealthy) | 152 (Unhealthy) | 123 (Unhealthy for Sensitive Groups) | 107 (Moderate) | 56 (Good) | 54 (Good) | 45 (Good) | 84 (Moderate) | 114 (Moderate) |
| pm10 | 66 (Unhealthy for Sensitive Groups) | 78 (Unhealthy for Sensitive Groups) | 58 (Unhealthy for Sensitive Groups) | 46 (Moderate) | 68 (Unhealthy for Sensitive Groups) | 103 (Unhealthy) | 96 (Unhealthy) | 76 (Unhealthy for Sensitive Groups) | 72 (Unhealthy for Sensitive Groups) | 47 (Moderate) | 44 (Moderate) | 53 (Unhealthy for Sensitive Groups) | 80 (Unhealthy for Sensitive Groups) | 75 (Unhealthy for Sensitive Groups) | 91 (Unhealthy) | 96 (Unhealthy) | 133 (Very Unhealthy) | 84 (Unhealthy) | 76 (Unhealthy for Sensitive Groups) | 81 (Unhealthy) |
| so2 | 15 (Good) | 17 (Good) | 16 (Good) | 15 (Good) | 11 (Good) | 16 (Good) | 15 (Good) | 12 (Good) | 14 (Good) | 11 (Good) | 9.4 (Good) | 13 (Good) | 19 (Good) | 15 (Good) | 11 (Good) | 10 (Good) | 8.8 (Good) | 8.9 (Good) | 9.7 (Good) | 11 (Good) |
PM10 179 (Very bad Hazardous)
particulate matter (PM10) suspended dustPM2,5 35 (Unhealthy for Sensitive Groups)
particulate matter (PM2.5) dustO3 0.04 (Good)
ozone (O3)NO2 0 (Good)
nitrogen dioxide (NO2)SO2 0 (Good)
sulfur dioxide (SO2)沈家营
| index | 2022-05-27 |
|---|---|
| pm10 | 56 |
| pm25 | 56 |
| o3 | 0.03 |
| no2 | 0 |
| so2 | 0 |
沈家营

| index | 2020-05 | 2020-04 | 2020-03 | 2020-02 | 2020-01 | 2019-12 | 2019-11 | 2019-10 | 2019-09 | 2019-08 | 2019-07 | 2019-06 | 2019-05 | 2019-04 | 2019-03 | 2019-02 | 2019-01 | 2018-12 | 2018-11 | 2018-10 |
|---|---|---|---|---|---|---|---|---|---|---|---|---|---|---|---|---|---|---|---|---|
| pm25 | 29 | 38 | 33 | 33 | 47 | 55 | 44 | 33 | 33 | 22 | 19 | 22 | 33 | 35 | 34 | 49 | 68 | 43 | 37 | 36 |
| co | 1 | 1 | 1 | 1 | 1 | 1 | 930 | 894 | 967 | 941 | 884 | 885 | 989 | 1 | 992 | 1 | 1 | 925 | 1 | 986 |
| no2 | 23 | 35 | 25 | 21 | 35 | 60 | 46 | 33 | 26 | 20 | 23 | 28 | 29 | 32 | 39 | 31 | 48 | 42 | 42 | 44 |
| o3 | 147 | 141 | 99 | 81 | 52 | 59 | 97 | 119 | 179 | 170 | 138 | 162 | 152 | 123 | 107 | 56 | 54 | 45 | 84 | 114 |
| pm10 | 66 | 78 | 58 | 46 | 68 | 103 | 96 | 76 | 72 | 47 | 44 | 53 | 80 | 75 | 91 | 96 | 133 | 84 | 76 | 81 |
| so2 | 15 | 17 | 16 | 15 | 11 | 16 | 15 | 12 | 14 | 11 | 9.4 | 13 | 19 | 15 | 11 | 10 | 8.8 | 8.9 | 9.7 | 11 |