Air Pollution in Tonghui: Real-time Air Quality Index and smog alert.
Pollution and air quality forecast for Tonghui. Today is Tuesday, June 2, 2026. The following air pollution values have been recorded for Tonghui:- particulate matter (PM10) suspended dust - 179 (Very bad Hazardous)
- particulate matter (PM2.5) dust - 35 (Unhealthy for Sensitive Groups)
- ozone (O3) - 0 (Good)
- nitrogen dioxide (NO2) - 0 (Good)
- sulfur dioxide (SO2) - 0 (Good)

What is the air quality in Tonghui today? Is the air polluted in Tonghui?. Is there smog?
What is the level of PM10 today in Tonghui? (particulate matter (PM10) suspended dust)
The current level of particulate matter PM10 in Tonghui is:
179 (Very bad Hazardous)
The highest PM10 values usually occur in month: 109 (January 2019).
The lowest value of particulate matter PM10 pollution in Tonghui is usually recorded in: July (40).
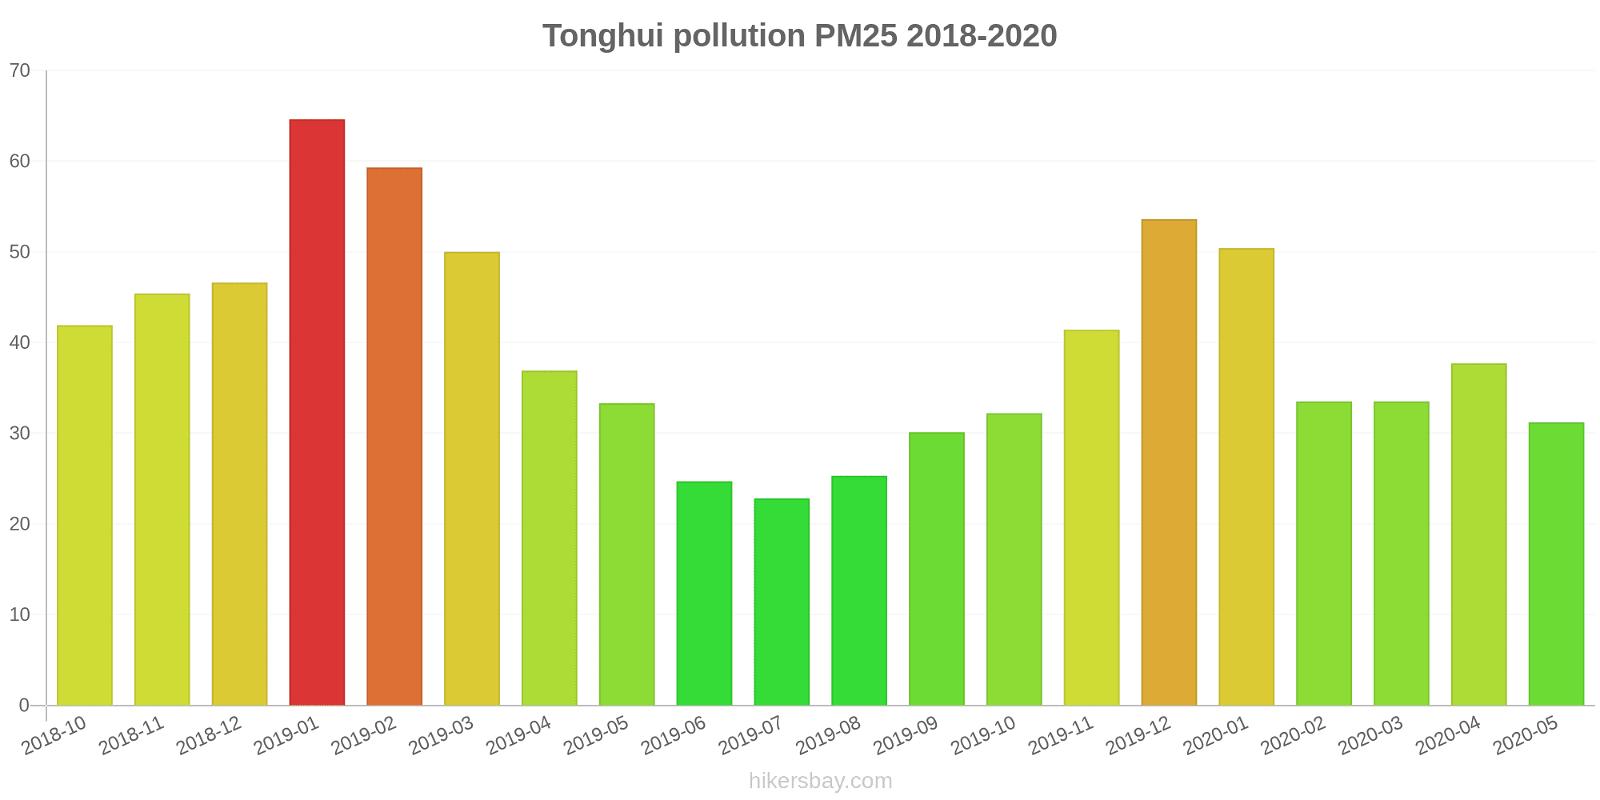
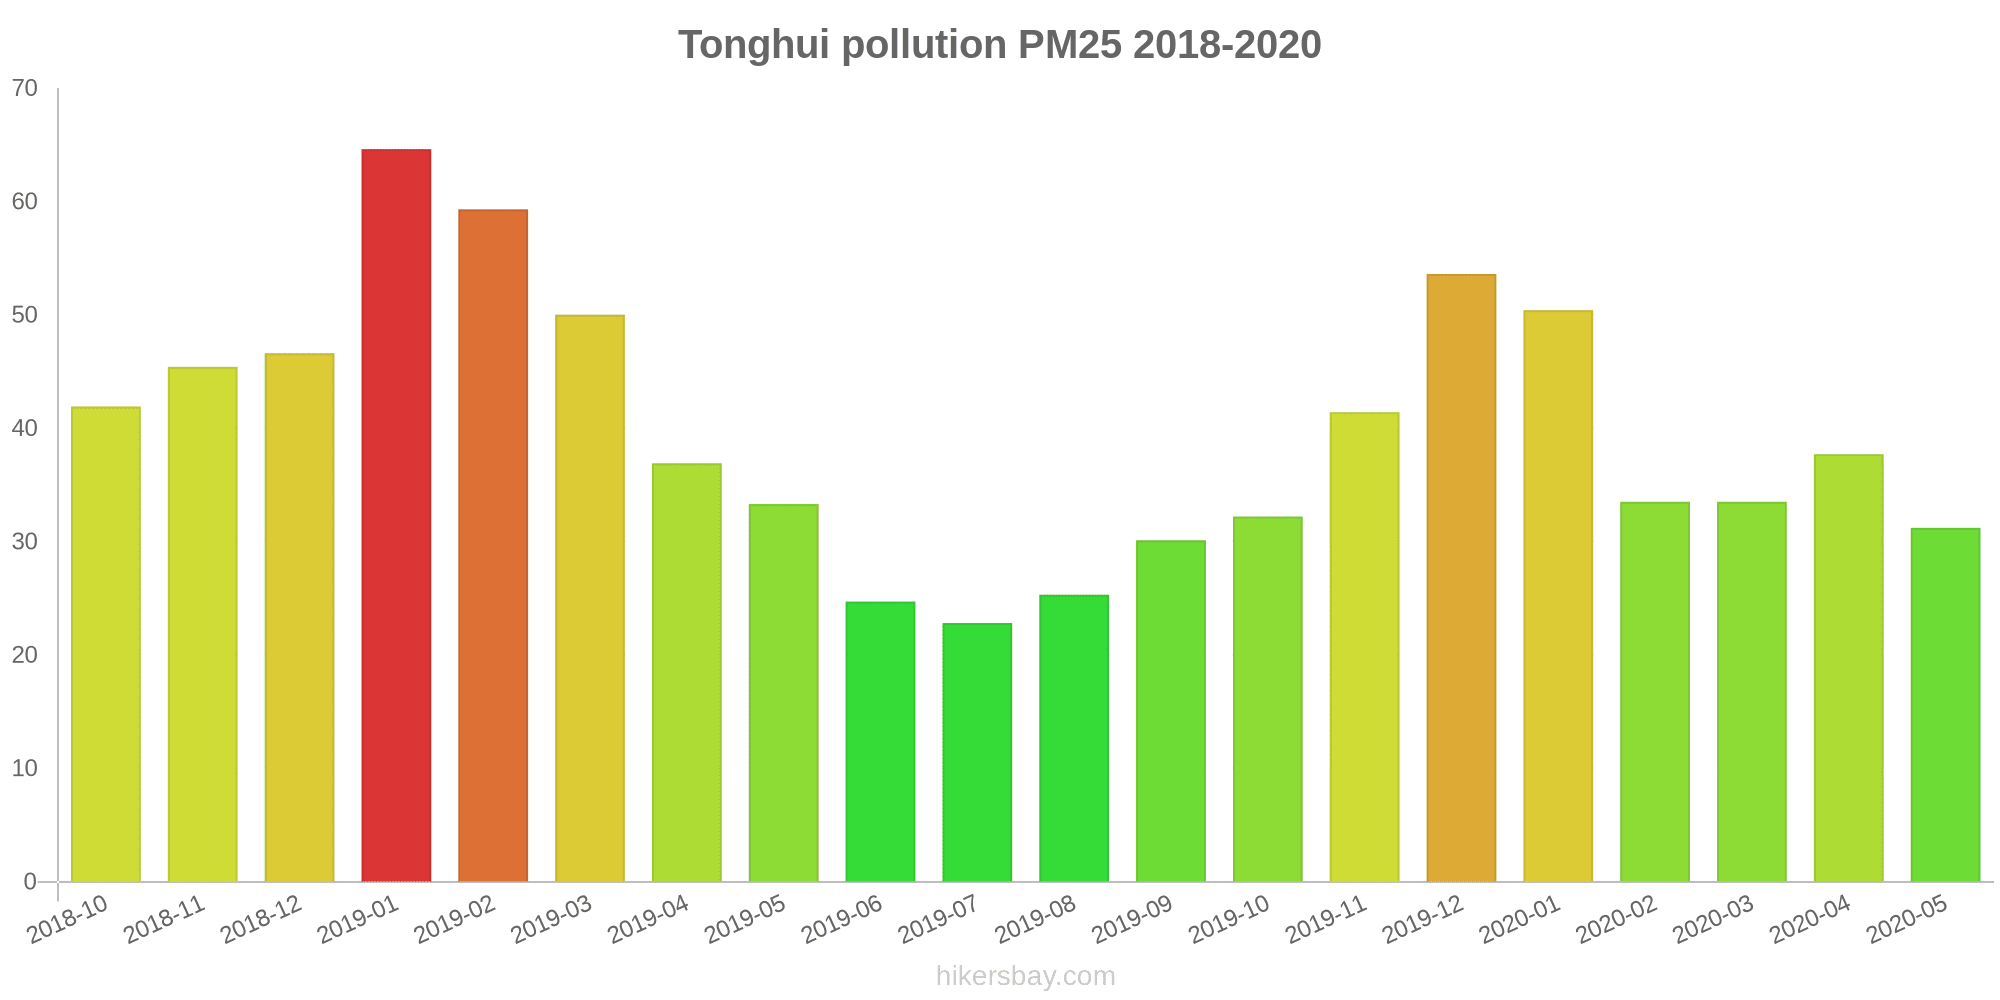
What is the current level of PM2.5 in Tonghui? (particulate matter (PM2.5) dust)
Today's PM2.5 level is:
35 (Unhealthy for Sensitive Groups)
For comparison, the highest level of PM2.5 in Tonghui in the last 7 days was: 56 (Friday, May 27, 2022) and the lowest: 56 (Friday, May 27, 2022).
The highest PM2.5 values were recorded: 65 (January 2019).
The lowest level of particulate matter PM2.5 pollution occurs in month: July (23).
How is the O3 level today in Tonghui? (ozone (O3))
0 (Good)
How high is the level of NO2? (nitrogen dioxide (NO2))
0 (Good)
What is the level of SO2 pollution? (sulfur dioxide (SO2))
0 (Good)
Current data Friday, May 27, 2022, 12:00 PM
PM10 179 (Very bad Hazardous)
PM2,5 35 (Unhealthy for Sensitive Groups)
O3 0 (Good)
NO2 0 (Good)
SO2 0 (Good)
Data on air pollution from recent days in Tonghui
index
2022-05-27
pm10
56
Unhealthy for Sensitive Groups
pm25
56
Unhealthy
o3
0
Good
no2
0
Good
so2
0
Good
data source »
Air pollution in Tonghui from October 2018 to May 2020
index
2020-05
2020-04
2020-03
2020-02
2020-01
2019-12
2019-11
2019-10
2019-09
2019-08
2019-07
2019-06
2019-05
2019-04
2019-03
2019-02
2019-01
2018-12
2018-11
2018-10
pm25
31 (Moderate)
38 (Unhealthy for Sensitive Groups)
34 (Moderate)
34 (Moderate)
50 (Unhealthy for Sensitive Groups)
54 (Unhealthy for Sensitive Groups)
41 (Unhealthy for Sensitive Groups)
32 (Moderate)
30 (Moderate)
25 (Moderate)
23 (Moderate)
25 (Moderate)
33 (Moderate)
37 (Unhealthy for Sensitive Groups)
50 (Unhealthy for Sensitive Groups)
59 (Unhealthy)
65 (Unhealthy)
47 (Unhealthy for Sensitive Groups)
45 (Unhealthy for Sensitive Groups)
42 (Unhealthy for Sensitive Groups)
co
1 (Good)
957 (Good)
1 (Good)
1 (Good)
1 (Good)
1 (Good)
1 (Good)
1 (Good)
988 (Good)
981 (Good)
916 (Good)
886 (Good)
1 (Good)
1 (Good)
1 (Good)
1 (Good)
1 (Good)
1 (Good)
1 (Good)
1 (Good)
no2
27 (Good)
31 (Good)
23 (Good)
23 (Good)
36 (Good)
53 (Moderate)
43 (Moderate)
36 (Good)
28 (Good)
21 (Good)
14 (Good)
19 (Good)
31 (Good)
33 (Good)
40 (Good)
33 (Good)
47 (Moderate)
43 (Moderate)
36 (Good)
35 (Good)
o3
151 (Unhealthy)
138 (Unhealthy for Sensitive Groups)
96 (Moderate)
79 (Moderate)
50 (Good)
62 (Good)
91 (Moderate)
108 (Moderate)
163 (Unhealthy)
160 (Unhealthy)
134 (Unhealthy for Sensitive Groups)
159 (Unhealthy)
142 (Unhealthy for Sensitive Groups)
120 (Unhealthy for Sensitive Groups)
106 (Moderate)
48 (Good)
54 (Good)
44 (Good)
72 (Moderate)
98 (Moderate)
pm10
66 (Unhealthy for Sensitive Groups)
71 (Unhealthy for Sensitive Groups)
55 (Unhealthy for Sensitive Groups)
47 (Moderate)
67 (Unhealthy for Sensitive Groups)
86 (Unhealthy)
82 (Unhealthy)
62 (Unhealthy for Sensitive Groups)
57 (Unhealthy for Sensitive Groups)
44 (Moderate)
40 (Moderate)
48 (Moderate)
69 (Unhealthy for Sensitive Groups)
64 (Unhealthy for Sensitive Groups)
72 (Unhealthy for Sensitive Groups)
81 (Unhealthy)
109 (Unhealthy)
77 (Unhealthy for Sensitive Groups)
65 (Unhealthy for Sensitive Groups)
62 (Unhealthy for Sensitive Groups)
so2
14 (Good)
15 (Good)
12 (Good)
6.7 (Good)
8 (Good)
12 (Good)
15 (Good)
16 (Good)
15 (Good)
11 (Good)
11 (Good)
11 (Good)
15 (Good)
13 (Good)
9.3 (Good)
5.3 (Good)
11 (Good)
8.5 (Good)
10 (Good)
11 (Good)
data source »
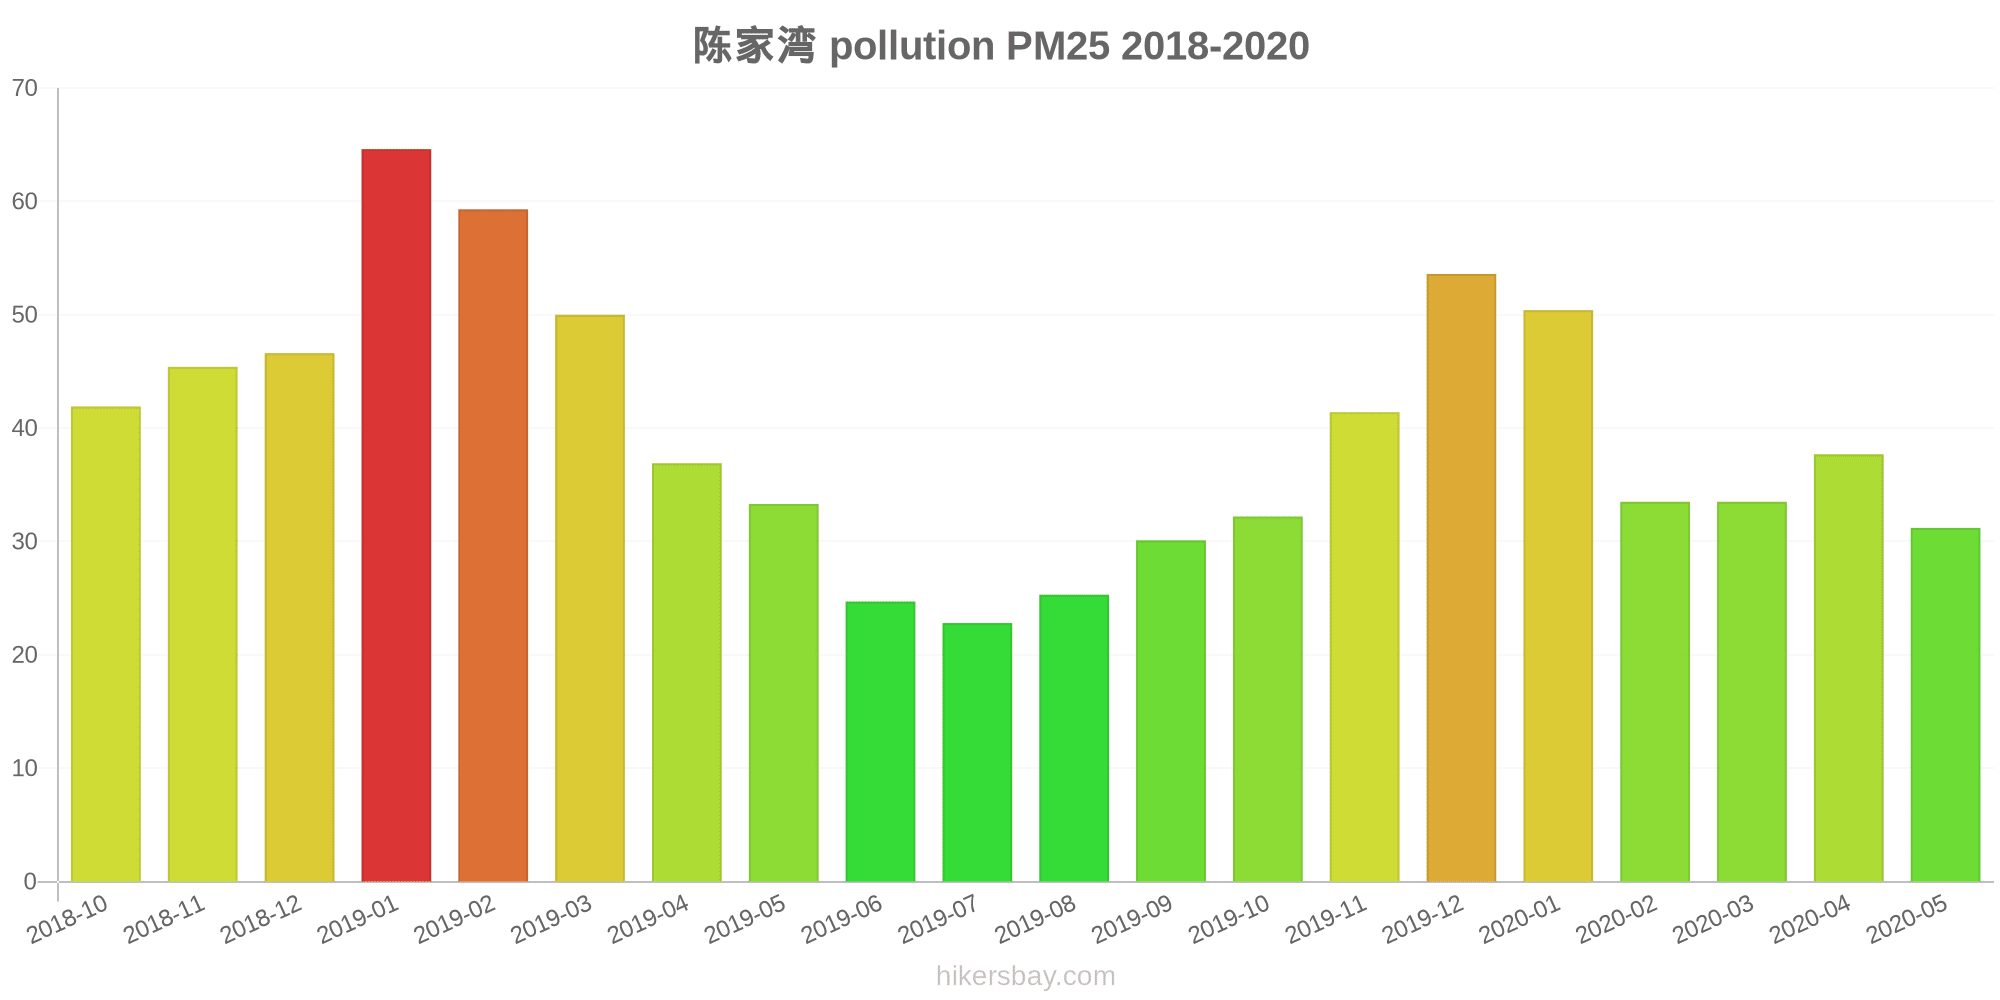
陈家湾
Friday, May 27, 2022, 12:00 PM
PM10 179 (Very bad Hazardous)
particulate matter (PM10) suspended dust
PM2,5 35 (Unhealthy for Sensitive Groups)
particulate matter (PM2.5) dust
O3 0.04 (Good)
ozone (O3)
NO2 0 (Good)
nitrogen dioxide (NO2)
SO2 0 (Good)
sulfur dioxide (SO2)
陈家湾
index
2022-05-27
pm10
56
pm25
56
o3
0.03
no2
0
so2
0
陈家湾
2018-10 2020-05

index
2020-05
2020-04
2020-03
2020-02
2020-01
2019-12
2019-11
2019-10
2019-09
2019-08
2019-07
2019-06
2019-05
2019-04
2019-03
2019-02
2019-01
2018-12
2018-11
2018-10
pm25
31
38
34
34
50
54
41
32
30
25
23
25
33
37
50
59
65
47
45
42
co
1
957
1
1
1
1
1
1
988
981
916
886
1
1
1
1
1
1
1
1
no2
27
31
23
23
36
53
43
36
28
21
14
19
31
33
40
33
47
43
36
35
o3
151
138
96
79
50
62
91
108
163
160
134
159
142
120
106
48
54
44
72
98
pm10
66
71
55
47
67
86
82
62
57
44
40
48
69
64
72
81
109
77
65
62
so2
14
15
12
6.7
8
12
15
16
15
11
11
11
15
13
9.3
5.3
11
8.5
10
11
* Pollution data source:
https://openaq.org
(ChinaAQIData)
The data is licensed under CC-By 4.0
PM10 179 (Very bad Hazardous)
PM2,5 35 (Unhealthy for Sensitive Groups)
O3 0 (Good)
NO2 0 (Good)
SO2 0 (Good)
Data on air pollution from recent days in Tonghui
| index | 2022-05-27 |
|---|---|
| pm10 | 56 Unhealthy for Sensitive Groups |
| pm25 | 56 Unhealthy |
| o3 | 0 Good |
| no2 | 0 Good |
| so2 | 0 Good |
| index | 2020-05 | 2020-04 | 2020-03 | 2020-02 | 2020-01 | 2019-12 | 2019-11 | 2019-10 | 2019-09 | 2019-08 | 2019-07 | 2019-06 | 2019-05 | 2019-04 | 2019-03 | 2019-02 | 2019-01 | 2018-12 | 2018-11 | 2018-10 |
|---|---|---|---|---|---|---|---|---|---|---|---|---|---|---|---|---|---|---|---|---|
| pm25 | 31 (Moderate) | 38 (Unhealthy for Sensitive Groups) | 34 (Moderate) | 34 (Moderate) | 50 (Unhealthy for Sensitive Groups) | 54 (Unhealthy for Sensitive Groups) | 41 (Unhealthy for Sensitive Groups) | 32 (Moderate) | 30 (Moderate) | 25 (Moderate) | 23 (Moderate) | 25 (Moderate) | 33 (Moderate) | 37 (Unhealthy for Sensitive Groups) | 50 (Unhealthy for Sensitive Groups) | 59 (Unhealthy) | 65 (Unhealthy) | 47 (Unhealthy for Sensitive Groups) | 45 (Unhealthy for Sensitive Groups) | 42 (Unhealthy for Sensitive Groups) |
| co | 1 (Good) | 957 (Good) | 1 (Good) | 1 (Good) | 1 (Good) | 1 (Good) | 1 (Good) | 1 (Good) | 988 (Good) | 981 (Good) | 916 (Good) | 886 (Good) | 1 (Good) | 1 (Good) | 1 (Good) | 1 (Good) | 1 (Good) | 1 (Good) | 1 (Good) | 1 (Good) |
| no2 | 27 (Good) | 31 (Good) | 23 (Good) | 23 (Good) | 36 (Good) | 53 (Moderate) | 43 (Moderate) | 36 (Good) | 28 (Good) | 21 (Good) | 14 (Good) | 19 (Good) | 31 (Good) | 33 (Good) | 40 (Good) | 33 (Good) | 47 (Moderate) | 43 (Moderate) | 36 (Good) | 35 (Good) |
| o3 | 151 (Unhealthy) | 138 (Unhealthy for Sensitive Groups) | 96 (Moderate) | 79 (Moderate) | 50 (Good) | 62 (Good) | 91 (Moderate) | 108 (Moderate) | 163 (Unhealthy) | 160 (Unhealthy) | 134 (Unhealthy for Sensitive Groups) | 159 (Unhealthy) | 142 (Unhealthy for Sensitive Groups) | 120 (Unhealthy for Sensitive Groups) | 106 (Moderate) | 48 (Good) | 54 (Good) | 44 (Good) | 72 (Moderate) | 98 (Moderate) |
| pm10 | 66 (Unhealthy for Sensitive Groups) | 71 (Unhealthy for Sensitive Groups) | 55 (Unhealthy for Sensitive Groups) | 47 (Moderate) | 67 (Unhealthy for Sensitive Groups) | 86 (Unhealthy) | 82 (Unhealthy) | 62 (Unhealthy for Sensitive Groups) | 57 (Unhealthy for Sensitive Groups) | 44 (Moderate) | 40 (Moderate) | 48 (Moderate) | 69 (Unhealthy for Sensitive Groups) | 64 (Unhealthy for Sensitive Groups) | 72 (Unhealthy for Sensitive Groups) | 81 (Unhealthy) | 109 (Unhealthy) | 77 (Unhealthy for Sensitive Groups) | 65 (Unhealthy for Sensitive Groups) | 62 (Unhealthy for Sensitive Groups) |
| so2 | 14 (Good) | 15 (Good) | 12 (Good) | 6.7 (Good) | 8 (Good) | 12 (Good) | 15 (Good) | 16 (Good) | 15 (Good) | 11 (Good) | 11 (Good) | 11 (Good) | 15 (Good) | 13 (Good) | 9.3 (Good) | 5.3 (Good) | 11 (Good) | 8.5 (Good) | 10 (Good) | 11 (Good) |
PM10 179 (Very bad Hazardous)
particulate matter (PM10) suspended dustPM2,5 35 (Unhealthy for Sensitive Groups)
particulate matter (PM2.5) dustO3 0.04 (Good)
ozone (O3)NO2 0 (Good)
nitrogen dioxide (NO2)SO2 0 (Good)
sulfur dioxide (SO2)陈家湾
| index | 2022-05-27 |
|---|---|
| pm10 | 56 |
| pm25 | 56 |
| o3 | 0.03 |
| no2 | 0 |
| so2 | 0 |
陈家湾
| index | 2020-05 | 2020-04 | 2020-03 | 2020-02 | 2020-01 | 2019-12 | 2019-11 | 2019-10 | 2019-09 | 2019-08 | 2019-07 | 2019-06 | 2019-05 | 2019-04 | 2019-03 | 2019-02 | 2019-01 | 2018-12 | 2018-11 | 2018-10 |
|---|---|---|---|---|---|---|---|---|---|---|---|---|---|---|---|---|---|---|---|---|
| pm25 | 31 | 38 | 34 | 34 | 50 | 54 | 41 | 32 | 30 | 25 | 23 | 25 | 33 | 37 | 50 | 59 | 65 | 47 | 45 | 42 |
| co | 1 | 957 | 1 | 1 | 1 | 1 | 1 | 1 | 988 | 981 | 916 | 886 | 1 | 1 | 1 | 1 | 1 | 1 | 1 | 1 |
| no2 | 27 | 31 | 23 | 23 | 36 | 53 | 43 | 36 | 28 | 21 | 14 | 19 | 31 | 33 | 40 | 33 | 47 | 43 | 36 | 35 |
| o3 | 151 | 138 | 96 | 79 | 50 | 62 | 91 | 108 | 163 | 160 | 134 | 159 | 142 | 120 | 106 | 48 | 54 | 44 | 72 | 98 |
| pm10 | 66 | 71 | 55 | 47 | 67 | 86 | 82 | 62 | 57 | 44 | 40 | 48 | 69 | 64 | 72 | 81 | 109 | 77 | 65 | 62 |
| so2 | 14 | 15 | 12 | 6.7 | 8 | 12 | 15 | 16 | 15 | 11 | 11 | 11 | 15 | 13 | 9.3 | 5.3 | 11 | 8.5 | 10 | 11 |