Air Pollution in Ganhechen: Real-time Air Quality Index and smog alert.
Pollution and air quality forecast for Ganhechen. Today is Tuesday, June 2, 2026. The following air pollution values have been recorded for Ganhechen:- particulate matter (PM10) suspended dust - 179 (Very bad Hazardous)
- particulate matter (PM2.5) dust - 35 (Unhealthy for Sensitive Groups)
- ozone (O3) - 0 (Good)
- nitrogen dioxide (NO2) - 0 (Good)
- sulfur dioxide (SO2) - 0 (Good)

What is the air quality in Ganhechen today? Is the air polluted in Ganhechen?. Is there smog?
What is the level of PM10 today in Ganhechen? (particulate matter (PM10) suspended dust)
The current level of particulate matter PM10 in Ganhechen is:
179 (Very bad Hazardous)
The highest PM10 values usually occur in month: 182 (December 2018).
The lowest value of particulate matter PM10 pollution in Ganhechen is usually recorded in: August (46).
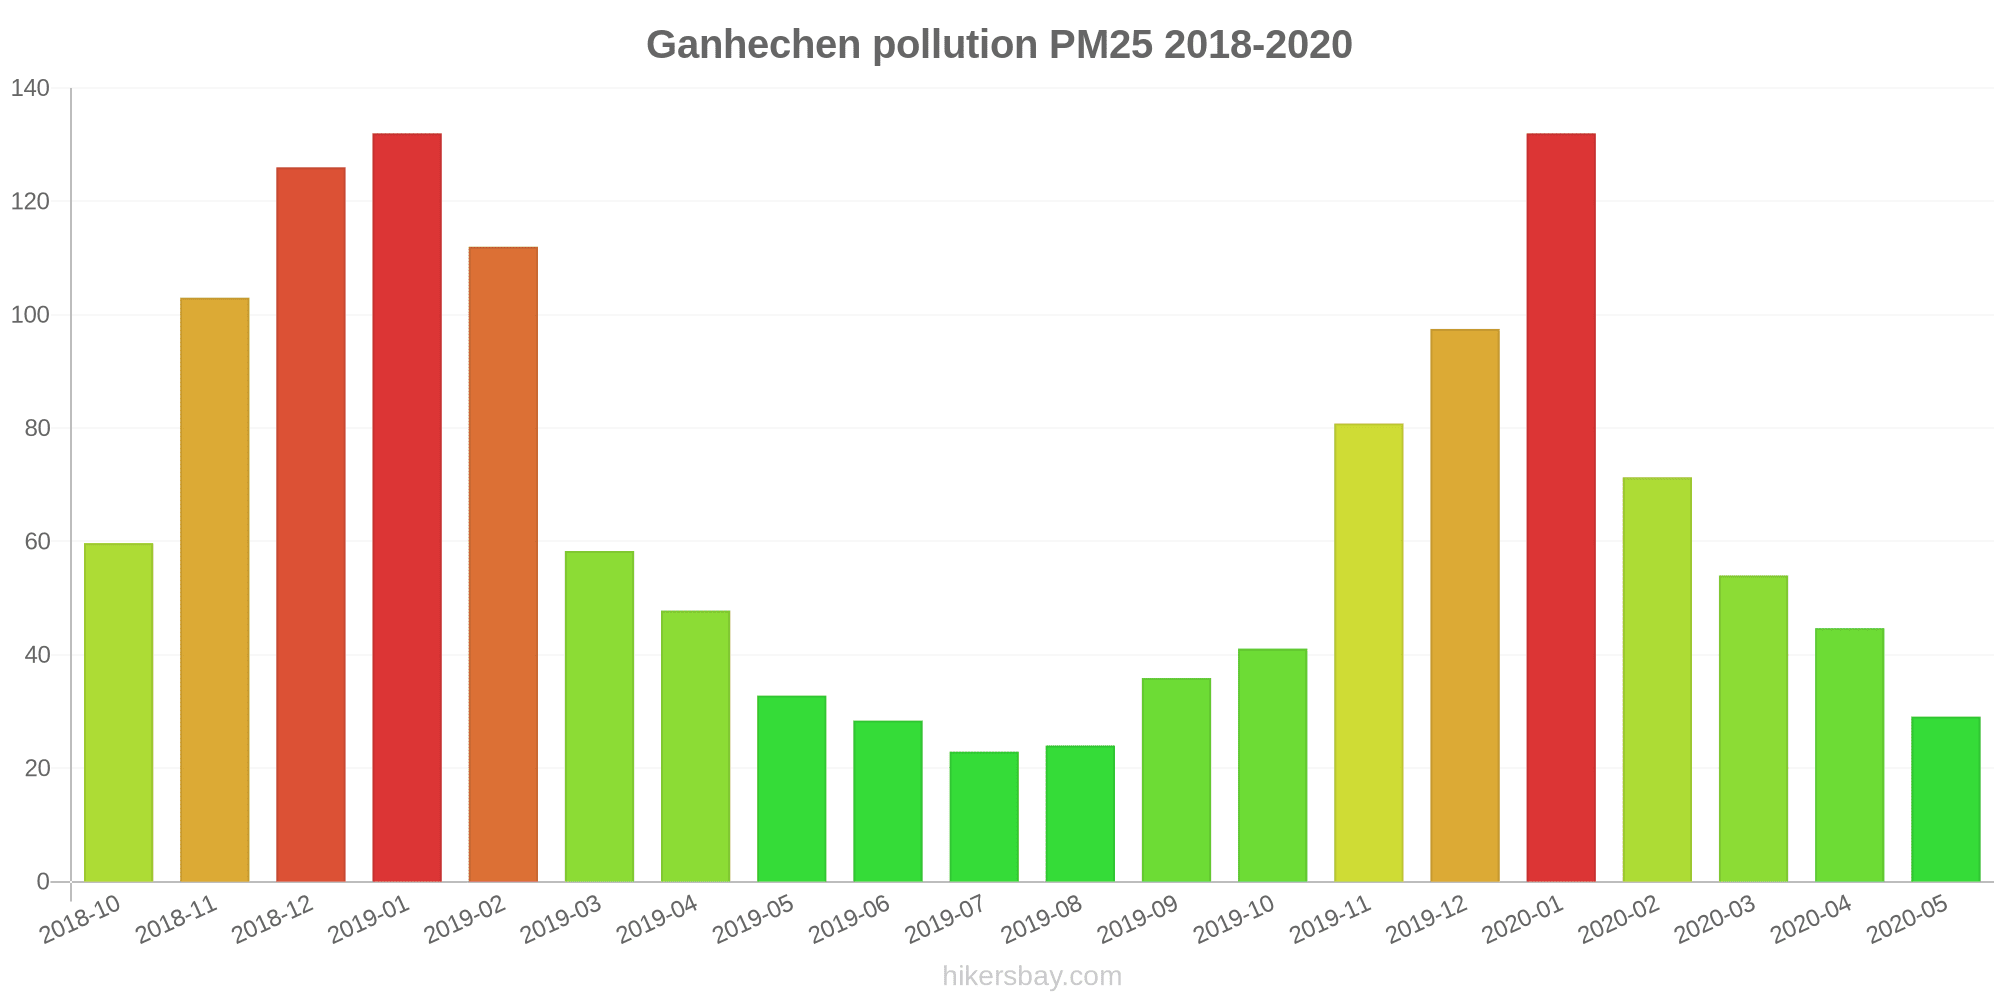
What is the current level of PM2.5 in Ganhechen? (particulate matter (PM2.5) dust)
Today's PM2.5 level is:
35 (Unhealthy for Sensitive Groups)
For comparison, the highest level of PM2.5 in Ganhechen in the last 7 days was: 56 (Friday, May 27, 2022) and the lowest: 56 (Friday, May 27, 2022).
The highest PM2.5 values were recorded: 132 (January 2020).
The lowest level of particulate matter PM2.5 pollution occurs in month: July (23).
How is the O3 level today in Ganhechen? (ozone (O3))
0 (Good)
How high is the level of NO2? (nitrogen dioxide (NO2))
0 (Good)
What is the level of SO2 pollution? (sulfur dioxide (SO2))
0 (Good)
Current data Friday, May 27, 2022, 12:00 PM
PM10 179 (Very bad Hazardous)
PM2,5 35 (Unhealthy for Sensitive Groups)
O3 0 (Good)
NO2 0 (Good)
SO2 0 (Good)
Data on air pollution from recent days in Ganhechen
index
2022-05-27
pm10
56
Unhealthy for Sensitive Groups
pm25
56
Unhealthy
o3
0
Good
no2
0
Good
so2
0
Good
data source »
Air pollution in Ganhechen from October 2018 to May 2020

index
2020-05
2020-04
2020-03
2020-02
2020-01
2019-12
2019-11
2019-10
2019-09
2019-08
2019-07
2019-06
2019-05
2019-04
2019-03
2019-02
2019-01
2018-12
2018-11
2018-10
pm25
29 (Moderate)
45 (Unhealthy for Sensitive Groups)
54 (Unhealthy for Sensitive Groups)
71 (Unhealthy)
132 (Very bad Hazardous)
98 (Very Unhealthy)
81 (Very Unhealthy)
41 (Unhealthy for Sensitive Groups)
36 (Unhealthy for Sensitive Groups)
24 (Moderate)
23 (Moderate)
28 (Moderate)
33 (Moderate)
48 (Unhealthy for Sensitive Groups)
58 (Unhealthy)
112 (Very bad Hazardous)
132 (Very bad Hazardous)
126 (Very bad Hazardous)
103 (Very Unhealthy)
60 (Unhealthy)
co
711 (Good)
690 (Good)
589 (Good)
734 (Good)
1 (Good)
900 (Good)
873 (Good)
617 (Good)
637 (Good)
496 (Good)
468 (Good)
473 (Good)
542 (Good)
717 (Good)
590 (Good)
902 (Good)
1 (Good)
1 (Good)
1 (Good)
650 (Good)
no2
15 (Good)
25 (Good)
23 (Good)
12 (Good)
28 (Good)
40 (Good)
41 (Moderate)
32 (Good)
23 (Good)
18 (Good)
20 (Good)
21 (Good)
22 (Good)
22 (Good)
31 (Good)
27 (Good)
45 (Moderate)
51 (Moderate)
49 (Moderate)
46 (Moderate)
o3
141 (Unhealthy for Sensitive Groups)
138 (Unhealthy for Sensitive Groups)
107 (Moderate)
90 (Moderate)
75 (Moderate)
61 (Good)
94 (Moderate)
116 (Moderate)
160 (Unhealthy)
156 (Unhealthy)
179 (Unhealthy)
195 (Very Unhealthy)
162 (Unhealthy)
132 (Unhealthy for Sensitive Groups)
119 (Moderate)
93 (Moderate)
75 (Moderate)
47 (Good)
92 (Moderate)
119 (Moderate)
pm10
68 (Unhealthy for Sensitive Groups)
86 (Unhealthy)
94 (Unhealthy)
80 (Unhealthy for Sensitive Groups)
138 (Very Unhealthy)
120 (Very Unhealthy)
131 (Very Unhealthy)
92 (Unhealthy)
79 (Unhealthy for Sensitive Groups)
46 (Moderate)
49 (Moderate)
65 (Unhealthy for Sensitive Groups)
93 (Unhealthy)
97 (Unhealthy)
109 (Unhealthy)
136 (Very Unhealthy)
170 (Very bad Hazardous)
182 (Very bad Hazardous)
154 (Very bad Hazardous)
108 (Unhealthy)
so2
6.7 (Good)
8.8 (Good)
7.9 (Good)
5.7 (Good)
7.4 (Good)
8.4 (Good)
10 (Good)
11 (Good)
10 (Good)
8.1 (Good)
6.9 (Good)
7.5 (Good)
9.9 (Good)
9.7 (Good)
10 (Good)
9.5 (Good)
11 (Good)
13 (Good)
11 (Good)
14 (Good)
data source »
漯河大学
Friday, May 27, 2022, 12:00 PM
PM10 179 (Very bad Hazardous)
particulate matter (PM10) suspended dust
PM2,5 35 (Unhealthy for Sensitive Groups)
particulate matter (PM2.5) dust
O3 0.04 (Good)
ozone (O3)
NO2 0 (Good)
nitrogen dioxide (NO2)
SO2 0 (Good)
sulfur dioxide (SO2)
漯河大学
index
2022-05-27
pm10
56
pm25
56
o3
0.03
no2
0
so2
0
漯河大学
2018-10 2020-05

index
2020-05
2020-04
2020-03
2020-02
2020-01
2019-12
2019-11
2019-10
2019-09
2019-08
2019-07
2019-06
2019-05
2019-04
2019-03
2019-02
2019-01
2018-12
2018-11
2018-10
pm25
29
45
54
71
132
98
81
41
36
24
23
28
33
48
58
112
132
126
103
60
co
711
690
589
734
1
900
873
617
637
496
468
473
542
717
590
902
1
1
1
650
no2
15
25
23
12
28
40
41
32
23
18
20
21
22
22
31
27
45
51
49
46
o3
141
138
107
90
75
61
94
116
160
156
179
195
162
132
119
93
75
47
92
119
pm10
68
86
94
80
138
120
131
92
79
46
49
65
93
97
109
136
170
182
154
108
so2
6.7
8.8
7.9
5.7
7.4
8.4
10
11
10
8.1
6.9
7.5
9.9
9.7
10
9.5
11
13
11
14
* Pollution data source:
https://openaq.org
(ChinaAQIData)
The data is licensed under CC-By 4.0
PM10 179 (Very bad Hazardous)
PM2,5 35 (Unhealthy for Sensitive Groups)
O3 0 (Good)
NO2 0 (Good)
SO2 0 (Good)
Data on air pollution from recent days in Ganhechen
| index | 2022-05-27 |
|---|---|
| pm10 | 56 Unhealthy for Sensitive Groups |
| pm25 | 56 Unhealthy |
| o3 | 0 Good |
| no2 | 0 Good |
| so2 | 0 Good |
| index | 2020-05 | 2020-04 | 2020-03 | 2020-02 | 2020-01 | 2019-12 | 2019-11 | 2019-10 | 2019-09 | 2019-08 | 2019-07 | 2019-06 | 2019-05 | 2019-04 | 2019-03 | 2019-02 | 2019-01 | 2018-12 | 2018-11 | 2018-10 |
|---|---|---|---|---|---|---|---|---|---|---|---|---|---|---|---|---|---|---|---|---|
| pm25 | 29 (Moderate) | 45 (Unhealthy for Sensitive Groups) | 54 (Unhealthy for Sensitive Groups) | 71 (Unhealthy) | 132 (Very bad Hazardous) | 98 (Very Unhealthy) | 81 (Very Unhealthy) | 41 (Unhealthy for Sensitive Groups) | 36 (Unhealthy for Sensitive Groups) | 24 (Moderate) | 23 (Moderate) | 28 (Moderate) | 33 (Moderate) | 48 (Unhealthy for Sensitive Groups) | 58 (Unhealthy) | 112 (Very bad Hazardous) | 132 (Very bad Hazardous) | 126 (Very bad Hazardous) | 103 (Very Unhealthy) | 60 (Unhealthy) |
| co | 711 (Good) | 690 (Good) | 589 (Good) | 734 (Good) | 1 (Good) | 900 (Good) | 873 (Good) | 617 (Good) | 637 (Good) | 496 (Good) | 468 (Good) | 473 (Good) | 542 (Good) | 717 (Good) | 590 (Good) | 902 (Good) | 1 (Good) | 1 (Good) | 1 (Good) | 650 (Good) |
| no2 | 15 (Good) | 25 (Good) | 23 (Good) | 12 (Good) | 28 (Good) | 40 (Good) | 41 (Moderate) | 32 (Good) | 23 (Good) | 18 (Good) | 20 (Good) | 21 (Good) | 22 (Good) | 22 (Good) | 31 (Good) | 27 (Good) | 45 (Moderate) | 51 (Moderate) | 49 (Moderate) | 46 (Moderate) |
| o3 | 141 (Unhealthy for Sensitive Groups) | 138 (Unhealthy for Sensitive Groups) | 107 (Moderate) | 90 (Moderate) | 75 (Moderate) | 61 (Good) | 94 (Moderate) | 116 (Moderate) | 160 (Unhealthy) | 156 (Unhealthy) | 179 (Unhealthy) | 195 (Very Unhealthy) | 162 (Unhealthy) | 132 (Unhealthy for Sensitive Groups) | 119 (Moderate) | 93 (Moderate) | 75 (Moderate) | 47 (Good) | 92 (Moderate) | 119 (Moderate) |
| pm10 | 68 (Unhealthy for Sensitive Groups) | 86 (Unhealthy) | 94 (Unhealthy) | 80 (Unhealthy for Sensitive Groups) | 138 (Very Unhealthy) | 120 (Very Unhealthy) | 131 (Very Unhealthy) | 92 (Unhealthy) | 79 (Unhealthy for Sensitive Groups) | 46 (Moderate) | 49 (Moderate) | 65 (Unhealthy for Sensitive Groups) | 93 (Unhealthy) | 97 (Unhealthy) | 109 (Unhealthy) | 136 (Very Unhealthy) | 170 (Very bad Hazardous) | 182 (Very bad Hazardous) | 154 (Very bad Hazardous) | 108 (Unhealthy) |
| so2 | 6.7 (Good) | 8.8 (Good) | 7.9 (Good) | 5.7 (Good) | 7.4 (Good) | 8.4 (Good) | 10 (Good) | 11 (Good) | 10 (Good) | 8.1 (Good) | 6.9 (Good) | 7.5 (Good) | 9.9 (Good) | 9.7 (Good) | 10 (Good) | 9.5 (Good) | 11 (Good) | 13 (Good) | 11 (Good) | 14 (Good) |
PM10 179 (Very bad Hazardous)
particulate matter (PM10) suspended dustPM2,5 35 (Unhealthy for Sensitive Groups)
particulate matter (PM2.5) dustO3 0.04 (Good)
ozone (O3)NO2 0 (Good)
nitrogen dioxide (NO2)SO2 0 (Good)
sulfur dioxide (SO2)漯河大学
| index | 2022-05-27 |
|---|---|
| pm10 | 56 |
| pm25 | 56 |
| o3 | 0.03 |
| no2 | 0 |
| so2 | 0 |
漯河大学

| index | 2020-05 | 2020-04 | 2020-03 | 2020-02 | 2020-01 | 2019-12 | 2019-11 | 2019-10 | 2019-09 | 2019-08 | 2019-07 | 2019-06 | 2019-05 | 2019-04 | 2019-03 | 2019-02 | 2019-01 | 2018-12 | 2018-11 | 2018-10 |
|---|---|---|---|---|---|---|---|---|---|---|---|---|---|---|---|---|---|---|---|---|
| pm25 | 29 | 45 | 54 | 71 | 132 | 98 | 81 | 41 | 36 | 24 | 23 | 28 | 33 | 48 | 58 | 112 | 132 | 126 | 103 | 60 |
| co | 711 | 690 | 589 | 734 | 1 | 900 | 873 | 617 | 637 | 496 | 468 | 473 | 542 | 717 | 590 | 902 | 1 | 1 | 1 | 650 |
| no2 | 15 | 25 | 23 | 12 | 28 | 40 | 41 | 32 | 23 | 18 | 20 | 21 | 22 | 22 | 31 | 27 | 45 | 51 | 49 | 46 |
| o3 | 141 | 138 | 107 | 90 | 75 | 61 | 94 | 116 | 160 | 156 | 179 | 195 | 162 | 132 | 119 | 93 | 75 | 47 | 92 | 119 |
| pm10 | 68 | 86 | 94 | 80 | 138 | 120 | 131 | 92 | 79 | 46 | 49 | 65 | 93 | 97 | 109 | 136 | 170 | 182 | 154 | 108 |
| so2 | 6.7 | 8.8 | 7.9 | 5.7 | 7.4 | 8.4 | 10 | 11 | 10 | 8.1 | 6.9 | 7.5 | 9.9 | 9.7 | 10 | 9.5 | 11 | 13 | 11 | 14 |