Air Pollution in Dongdianzi: Real-time Air Quality Index and smog alert.
Pollution and air quality forecast for Dongdianzi. Today is Thursday, June 18, 2026. The following air pollution values have been recorded for Dongdianzi:- particulate matter (PM10) suspended dust - 179 (Very bad Hazardous)
- particulate matter (PM2.5) dust - 35 (Unhealthy for Sensitive Groups)
- ozone (O3) - 0 (Good)
- nitrogen dioxide (NO2) - 0 (Good)
- sulfur dioxide (SO2) - 0 (Good)

What is the air quality in Dongdianzi today? Is the air polluted in Dongdianzi?. Is there smog?
What is the level of PM10 today in Dongdianzi? (particulate matter (PM10) suspended dust)
The current level of particulate matter PM10 in Dongdianzi is:
179 (Very bad Hazardous)
The highest PM10 values usually occur in month: 164 (January 2020).
The lowest value of particulate matter PM10 pollution in Dongdianzi is usually recorded in: February (37).
What is the current level of PM2.5 in Dongdianzi? (particulate matter (PM2.5) dust)
Today's PM2.5 level is:
35 (Unhealthy for Sensitive Groups)
For comparison, the highest level of PM2.5 in Dongdianzi in the last 7 days was: 56 (Friday, May 27, 2022) and the lowest: 56 (Friday, May 27, 2022).
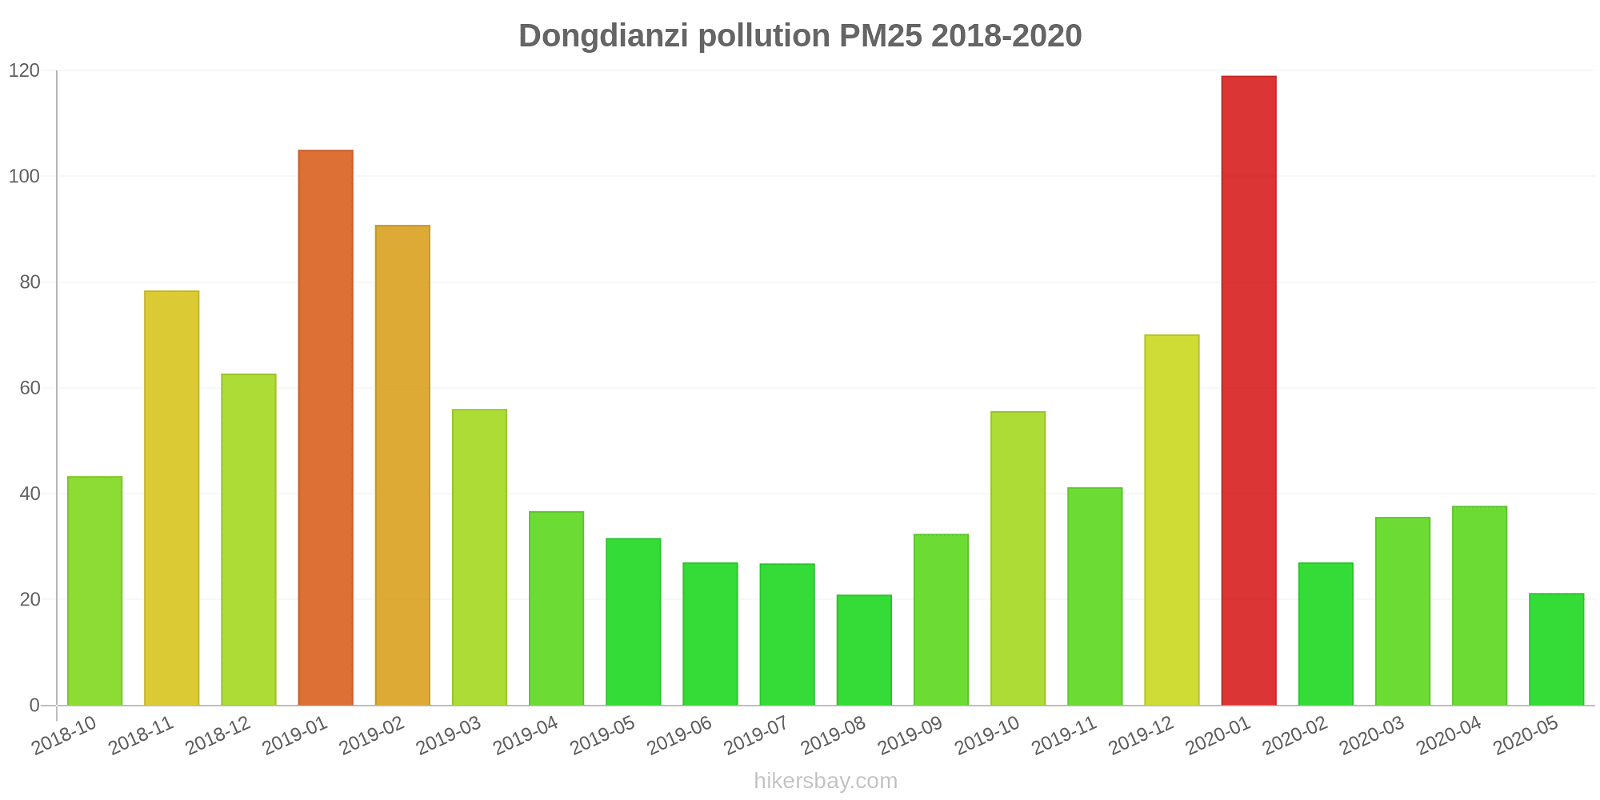
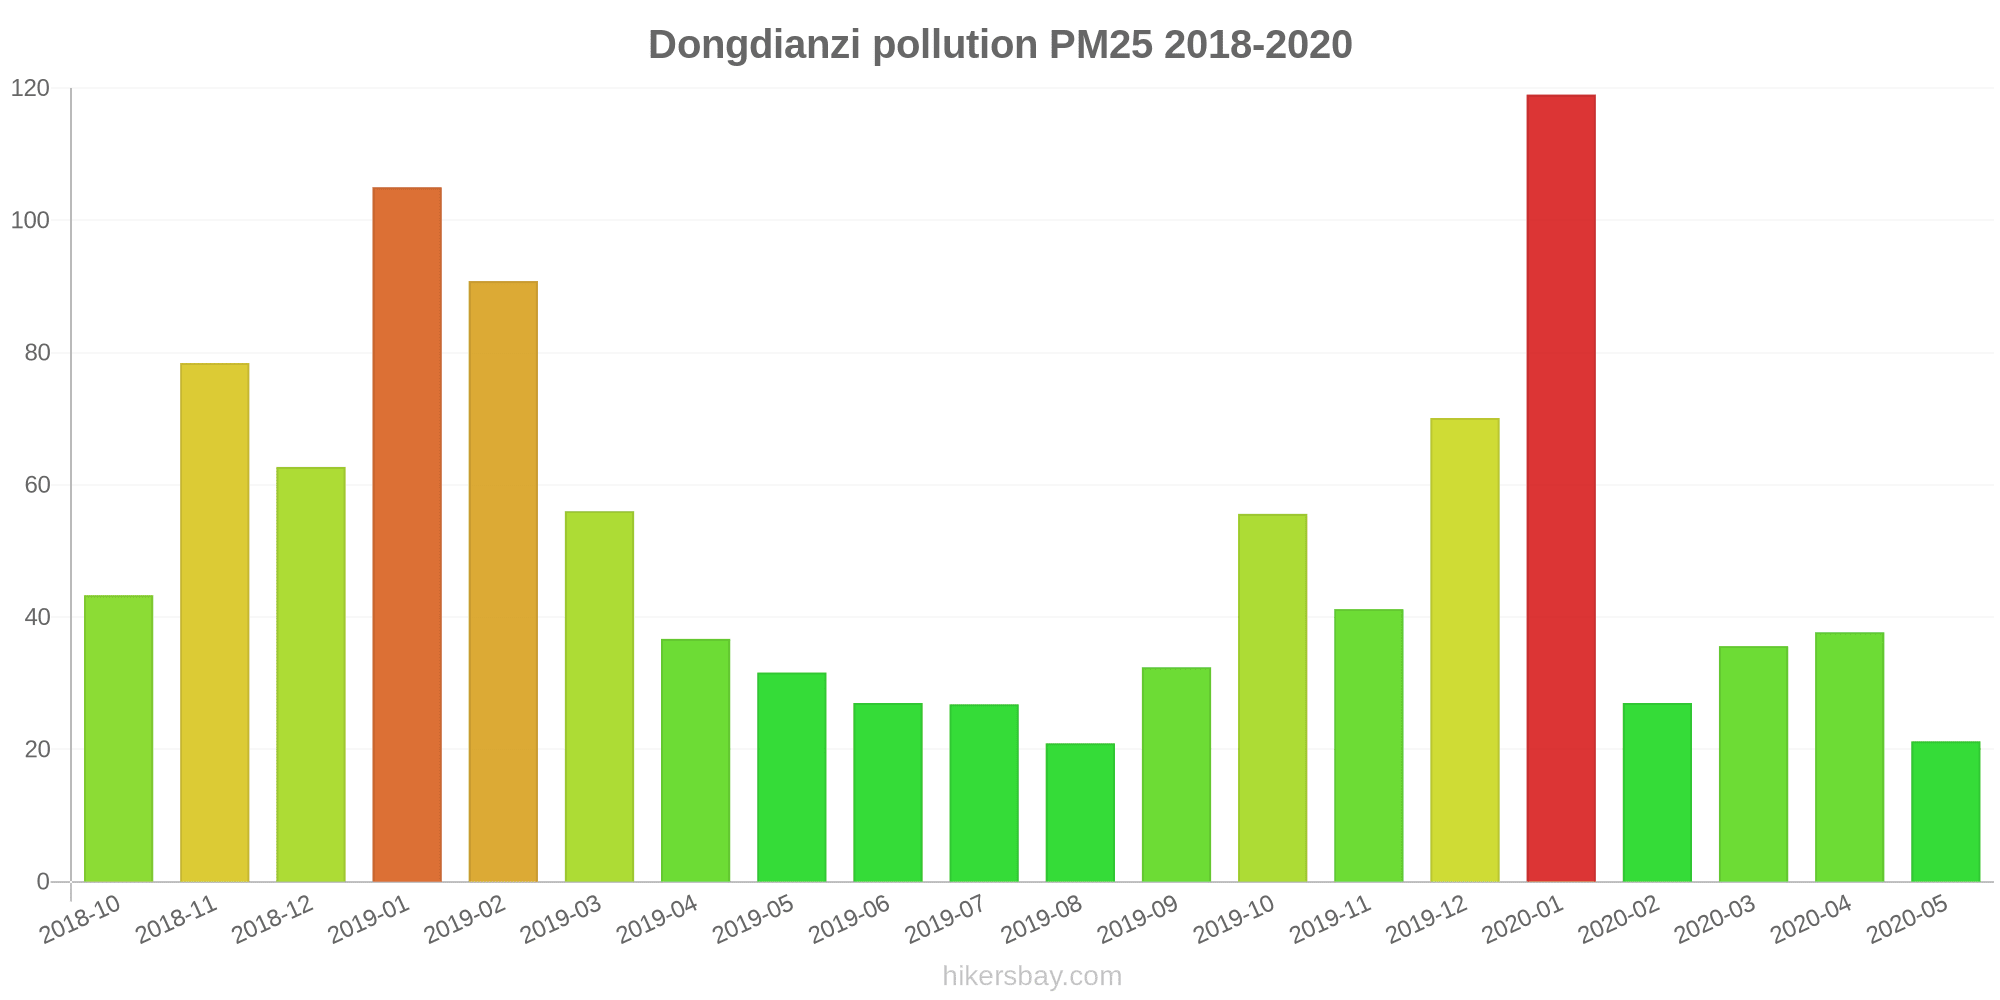
The highest PM2.5 values were recorded: 119 (January 2020).
The lowest level of particulate matter PM2.5 pollution occurs in month: August (21).
How is the O3 level today in Dongdianzi? (ozone (O3))
0 (Good)
How high is the level of NO2? (nitrogen dioxide (NO2))
0 (Good)
What is the level of SO2 pollution? (sulfur dioxide (SO2))
0 (Good)
Current data Friday, May 27, 2022, 12:00 PM
PM10 179 (Very bad Hazardous)
PM2,5 35 (Unhealthy for Sensitive Groups)
O3 0 (Good)
NO2 0 (Good)
SO2 0 (Good)
Data on air pollution from recent days in Dongdianzi
index
2022-05-27
pm10
56
Unhealthy for Sensitive Groups
pm25
56
Unhealthy
o3
0
Good
no2
0
Good
so2
0
Good
data source »
Air pollution in Dongdianzi from October 2018 to May 2020
index
2020-05
2020-04
2020-03
2020-02
2020-01
2019-12
2019-11
2019-10
2019-09
2019-08
2019-07
2019-06
2019-05
2019-04
2019-03
2019-02
2019-01
2018-12
2018-11
2018-10
pm25
21 (Moderate)
38 (Unhealthy for Sensitive Groups)
36 (Unhealthy for Sensitive Groups)
27 (Moderate)
119 (Very bad Hazardous)
70 (Unhealthy)
41 (Unhealthy for Sensitive Groups)
56 (Unhealthy)
32 (Moderate)
21 (Moderate)
27 (Moderate)
27 (Moderate)
32 (Moderate)
37 (Unhealthy for Sensitive Groups)
56 (Unhealthy)
91 (Very Unhealthy)
105 (Very Unhealthy)
63 (Unhealthy)
78 (Very Unhealthy)
43 (Unhealthy for Sensitive Groups)
co
469 (Good)
630 (Good)
616 (Good)
560 (Good)
1 (Good)
1 (Good)
670 (Good)
681 (Good)
582 (Good)
523 (Good)
369 (Good)
380 (Good)
417 (Good)
457 (Good)
746 (Good)
1 (Good)
1 (Good)
1 (Good)
1 (Good)
660 (Good)
no2
18 (Good)
35 (Good)
33 (Good)
25 (Good)
57 (Moderate)
52 (Moderate)
44 (Moderate)
43 (Moderate)
36 (Good)
30 (Good)
26 (Good)
26 (Good)
36 (Good)
34 (Good)
35 (Good)
42 (Moderate)
62 (Moderate)
52 (Moderate)
60 (Moderate)
49 (Moderate)
o3
140 (Unhealthy for Sensitive Groups)
136 (Unhealthy for Sensitive Groups)
119 (Moderate)
94 (Moderate)
71 (Moderate)
68 (Good)
89 (Moderate)
136 (Unhealthy for Sensitive Groups)
165 (Unhealthy)
134 (Unhealthy for Sensitive Groups)
152 (Unhealthy)
145 (Unhealthy for Sensitive Groups)
163 (Unhealthy)
126 (Unhealthy for Sensitive Groups)
128 (Unhealthy for Sensitive Groups)
100 (Moderate)
80 (Moderate)
69 (Good)
98 (Moderate)
115 (Moderate)
pm10
43 (Moderate)
72 (Unhealthy for Sensitive Groups)
65 (Unhealthy for Sensitive Groups)
37 (Moderate)
164 (Very bad Hazardous)
111 (Very Unhealthy)
96 (Unhealthy)
118 (Very Unhealthy)
75 (Unhealthy for Sensitive Groups)
48 (Moderate)
50 (Moderate)
55 (Unhealthy for Sensitive Groups)
85 (Unhealthy)
83 (Unhealthy)
111 (Very Unhealthy)
133 (Very Unhealthy)
159 (Very bad Hazardous)
119 (Very Unhealthy)
153 (Very bad Hazardous)
99 (Unhealthy)
so2
5.8 (Good)
9.7 (Good)
8.2 (Good)
10 (Good)
28 (Good)
19 (Good)
11 (Good)
10 (Good)
8.8 (Good)
7.7 (Good)
5.7 (Good)
5.8 (Good)
8.3 (Good)
6.6 (Good)
13 (Good)
17 (Good)
24 (Good)
21 (Good)
14 (Good)
11 (Good)
data source »
胶州一中
Friday, May 27, 2022, 12:00 PM
PM10 179 (Very bad Hazardous)
particulate matter (PM10) suspended dust
PM2,5 35 (Unhealthy for Sensitive Groups)
particulate matter (PM2.5) dust
O3 0.04 (Good)
ozone (O3)
NO2 0 (Good)
nitrogen dioxide (NO2)
SO2 0 (Good)
sulfur dioxide (SO2)
胶州一中
index
2022-05-27
pm10
56
pm25
56
o3
0.03
no2
0
so2
0
胶州一中
2018-10 2020-05

index
2020-05
2020-04
2020-03
2020-02
2020-01
2019-12
2019-11
2019-10
2019-09
2019-08
2019-07
2019-06
2019-05
2019-04
2019-03
2019-02
2019-01
2018-12
2018-11
2018-10
pm25
21
38
36
27
119
70
41
56
32
21
27
27
32
37
56
91
105
63
78
43
co
469
630
616
560
1
1
670
681
582
523
369
380
417
457
746
1
1
1
1
660
no2
18
35
33
25
57
52
44
43
36
30
26
26
36
34
35
42
62
52
60
49
o3
140
136
119
94
71
68
89
136
165
134
152
145
163
126
128
100
80
69
98
115
pm10
43
72
65
37
164
111
96
118
75
48
50
55
85
83
111
133
159
119
153
99
so2
5.8
9.7
8.2
10
28
19
11
10
8.8
7.7
5.7
5.8
8.3
6.6
13
17
24
21
14
11
* Pollution data source:
https://openaq.org
(ChinaAQIData)
The data is licensed under CC-By 4.0
PM10 179 (Very bad Hazardous)
PM2,5 35 (Unhealthy for Sensitive Groups)
O3 0 (Good)
NO2 0 (Good)
SO2 0 (Good)
Data on air pollution from recent days in Dongdianzi
| index | 2022-05-27 |
|---|---|
| pm10 | 56 Unhealthy for Sensitive Groups |
| pm25 | 56 Unhealthy |
| o3 | 0 Good |
| no2 | 0 Good |
| so2 | 0 Good |
| index | 2020-05 | 2020-04 | 2020-03 | 2020-02 | 2020-01 | 2019-12 | 2019-11 | 2019-10 | 2019-09 | 2019-08 | 2019-07 | 2019-06 | 2019-05 | 2019-04 | 2019-03 | 2019-02 | 2019-01 | 2018-12 | 2018-11 | 2018-10 |
|---|---|---|---|---|---|---|---|---|---|---|---|---|---|---|---|---|---|---|---|---|
| pm25 | 21 (Moderate) | 38 (Unhealthy for Sensitive Groups) | 36 (Unhealthy for Sensitive Groups) | 27 (Moderate) | 119 (Very bad Hazardous) | 70 (Unhealthy) | 41 (Unhealthy for Sensitive Groups) | 56 (Unhealthy) | 32 (Moderate) | 21 (Moderate) | 27 (Moderate) | 27 (Moderate) | 32 (Moderate) | 37 (Unhealthy for Sensitive Groups) | 56 (Unhealthy) | 91 (Very Unhealthy) | 105 (Very Unhealthy) | 63 (Unhealthy) | 78 (Very Unhealthy) | 43 (Unhealthy for Sensitive Groups) |
| co | 469 (Good) | 630 (Good) | 616 (Good) | 560 (Good) | 1 (Good) | 1 (Good) | 670 (Good) | 681 (Good) | 582 (Good) | 523 (Good) | 369 (Good) | 380 (Good) | 417 (Good) | 457 (Good) | 746 (Good) | 1 (Good) | 1 (Good) | 1 (Good) | 1 (Good) | 660 (Good) |
| no2 | 18 (Good) | 35 (Good) | 33 (Good) | 25 (Good) | 57 (Moderate) | 52 (Moderate) | 44 (Moderate) | 43 (Moderate) | 36 (Good) | 30 (Good) | 26 (Good) | 26 (Good) | 36 (Good) | 34 (Good) | 35 (Good) | 42 (Moderate) | 62 (Moderate) | 52 (Moderate) | 60 (Moderate) | 49 (Moderate) |
| o3 | 140 (Unhealthy for Sensitive Groups) | 136 (Unhealthy for Sensitive Groups) | 119 (Moderate) | 94 (Moderate) | 71 (Moderate) | 68 (Good) | 89 (Moderate) | 136 (Unhealthy for Sensitive Groups) | 165 (Unhealthy) | 134 (Unhealthy for Sensitive Groups) | 152 (Unhealthy) | 145 (Unhealthy for Sensitive Groups) | 163 (Unhealthy) | 126 (Unhealthy for Sensitive Groups) | 128 (Unhealthy for Sensitive Groups) | 100 (Moderate) | 80 (Moderate) | 69 (Good) | 98 (Moderate) | 115 (Moderate) |
| pm10 | 43 (Moderate) | 72 (Unhealthy for Sensitive Groups) | 65 (Unhealthy for Sensitive Groups) | 37 (Moderate) | 164 (Very bad Hazardous) | 111 (Very Unhealthy) | 96 (Unhealthy) | 118 (Very Unhealthy) | 75 (Unhealthy for Sensitive Groups) | 48 (Moderate) | 50 (Moderate) | 55 (Unhealthy for Sensitive Groups) | 85 (Unhealthy) | 83 (Unhealthy) | 111 (Very Unhealthy) | 133 (Very Unhealthy) | 159 (Very bad Hazardous) | 119 (Very Unhealthy) | 153 (Very bad Hazardous) | 99 (Unhealthy) |
| so2 | 5.8 (Good) | 9.7 (Good) | 8.2 (Good) | 10 (Good) | 28 (Good) | 19 (Good) | 11 (Good) | 10 (Good) | 8.8 (Good) | 7.7 (Good) | 5.7 (Good) | 5.8 (Good) | 8.3 (Good) | 6.6 (Good) | 13 (Good) | 17 (Good) | 24 (Good) | 21 (Good) | 14 (Good) | 11 (Good) |
PM10 179 (Very bad Hazardous)
particulate matter (PM10) suspended dustPM2,5 35 (Unhealthy for Sensitive Groups)
particulate matter (PM2.5) dustO3 0.04 (Good)
ozone (O3)NO2 0 (Good)
nitrogen dioxide (NO2)SO2 0 (Good)
sulfur dioxide (SO2)胶州一中
| index | 2022-05-27 |
|---|---|
| pm10 | 56 |
| pm25 | 56 |
| o3 | 0.03 |
| no2 | 0 |
| so2 | 0 |
胶州一中

| index | 2020-05 | 2020-04 | 2020-03 | 2020-02 | 2020-01 | 2019-12 | 2019-11 | 2019-10 | 2019-09 | 2019-08 | 2019-07 | 2019-06 | 2019-05 | 2019-04 | 2019-03 | 2019-02 | 2019-01 | 2018-12 | 2018-11 | 2018-10 |
|---|---|---|---|---|---|---|---|---|---|---|---|---|---|---|---|---|---|---|---|---|
| pm25 | 21 | 38 | 36 | 27 | 119 | 70 | 41 | 56 | 32 | 21 | 27 | 27 | 32 | 37 | 56 | 91 | 105 | 63 | 78 | 43 |
| co | 469 | 630 | 616 | 560 | 1 | 1 | 670 | 681 | 582 | 523 | 369 | 380 | 417 | 457 | 746 | 1 | 1 | 1 | 1 | 660 |
| no2 | 18 | 35 | 33 | 25 | 57 | 52 | 44 | 43 | 36 | 30 | 26 | 26 | 36 | 34 | 35 | 42 | 62 | 52 | 60 | 49 |
| o3 | 140 | 136 | 119 | 94 | 71 | 68 | 89 | 136 | 165 | 134 | 152 | 145 | 163 | 126 | 128 | 100 | 80 | 69 | 98 | 115 |
| pm10 | 43 | 72 | 65 | 37 | 164 | 111 | 96 | 118 | 75 | 48 | 50 | 55 | 85 | 83 | 111 | 133 | 159 | 119 | 153 | 99 |
| so2 | 5.8 | 9.7 | 8.2 | 10 | 28 | 19 | 11 | 10 | 8.8 | 7.7 | 5.7 | 5.8 | 8.3 | 6.6 | 13 | 17 | 24 | 21 | 14 | 11 |