Air Pollution in Mangong: Real-time Air Quality Index and smog alert.
Pollution and air quality forecast for Mangong. Today is Tuesday, June 16, 2026. The following air pollution values have been recorded for Mangong:- particulate matter (PM10) suspended dust - 179 (Very bad Hazardous)
- particulate matter (PM2.5) dust - 35 (Unhealthy for Sensitive Groups)
- ozone (O3) - 0 (Good)
- nitrogen dioxide (NO2) - 0 (Good)
- sulfur dioxide (SO2) - 0 (Good)

What is the air quality in Mangong today? Is the air polluted in Mangong?. Is there smog?
What is the level of PM10 today in Mangong? (particulate matter (PM10) suspended dust)
The current level of particulate matter PM10 in Mangong is:
179 (Very bad Hazardous)
The highest PM10 values usually occur in month: 141 (January 2019).
The lowest value of particulate matter PM10 pollution in Mangong is usually recorded in: July (41).
What is the current level of PM2.5 in Mangong? (particulate matter (PM2.5) dust)
Today's PM2.5 level is:
35 (Unhealthy for Sensitive Groups)
For comparison, the highest level of PM2.5 in Mangong in the last 7 days was: 56 (Friday, May 27, 2022) and the lowest: 56 (Friday, May 27, 2022).
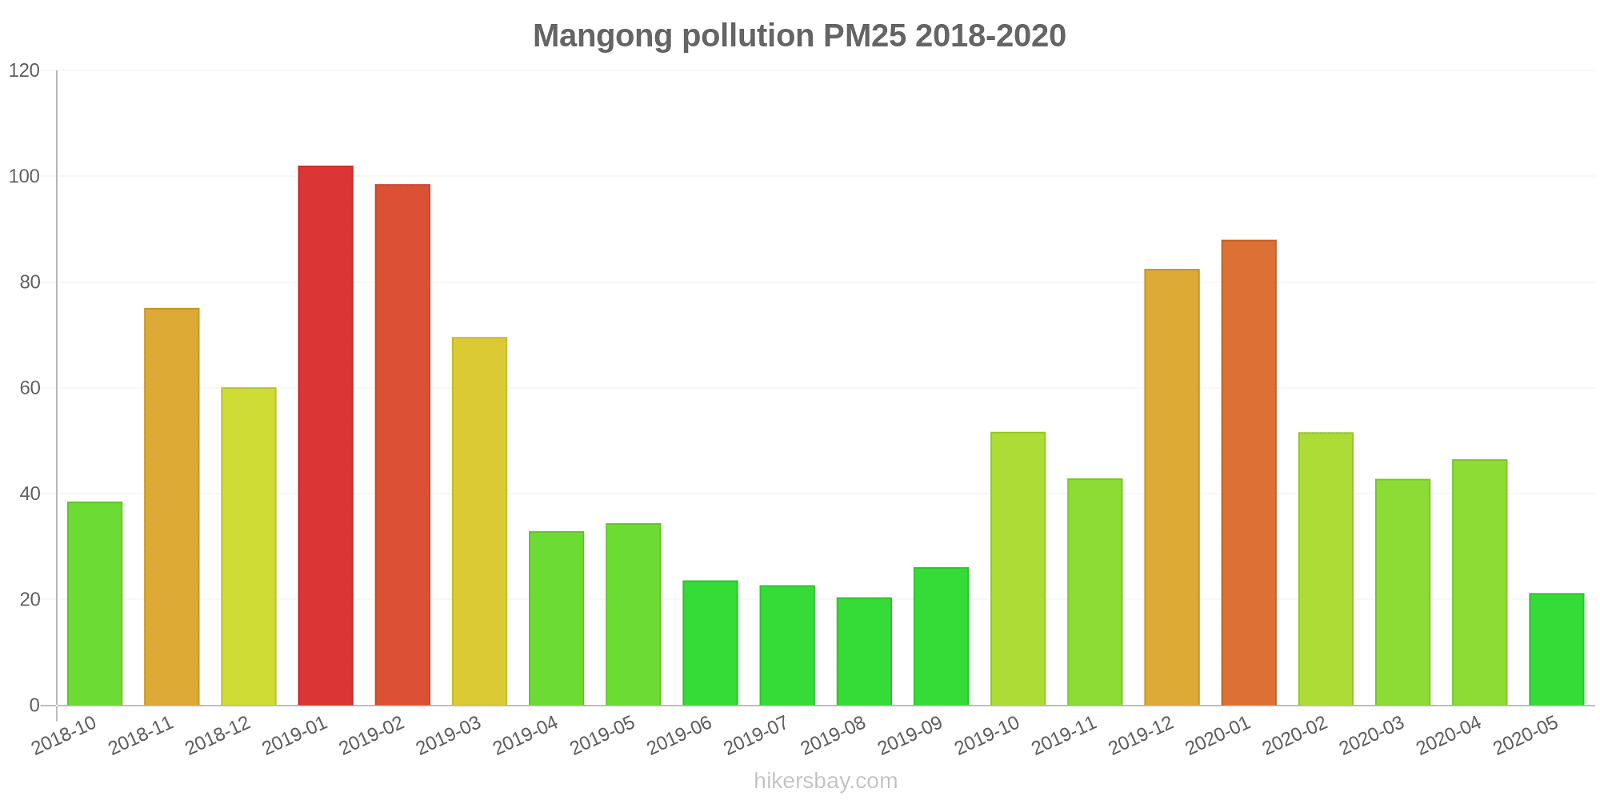
The highest PM2.5 values were recorded: 102 (January 2019).
The lowest level of particulate matter PM2.5 pollution occurs in month: August (20).
How is the O3 level today in Mangong? (ozone (O3))
0 (Good)
How high is the level of NO2? (nitrogen dioxide (NO2))
0 (Good)
What is the level of SO2 pollution? (sulfur dioxide (SO2))
0 (Good)
Current data Friday, May 27, 2022, 12:00 PM
PM10 179 (Very bad Hazardous)
PM2,5 35 (Unhealthy for Sensitive Groups)
O3 0 (Good)
NO2 0 (Good)
SO2 0 (Good)
Data on air pollution from recent days in Mangong
index
2022-05-27
pm10
56
Unhealthy for Sensitive Groups
pm25
56
Unhealthy
o3
0
Good
no2
0
Good
so2
0
Good
data source »
Air pollution in Mangong from October 2018 to May 2020
index
2020-05
2020-04
2020-03
2020-02
2020-01
2019-12
2019-11
2019-10
2019-09
2019-08
2019-07
2019-06
2019-05
2019-04
2019-03
2019-02
2019-01
2018-12
2018-11
2018-10
pm25
21 (Moderate)
47 (Unhealthy for Sensitive Groups)
43 (Unhealthy for Sensitive Groups)
52 (Unhealthy for Sensitive Groups)
88 (Very Unhealthy)
83 (Very Unhealthy)
43 (Unhealthy for Sensitive Groups)
52 (Unhealthy for Sensitive Groups)
26 (Moderate)
20 (Moderate)
23 (Moderate)
24 (Moderate)
34 (Moderate)
33 (Moderate)
70 (Unhealthy)
99 (Very Unhealthy)
102 (Very Unhealthy)
60 (Unhealthy)
75 (Very Unhealthy)
39 (Unhealthy for Sensitive Groups)
co
733 (Good)
746 (Good)
823 (Good)
911 (Good)
1 (Good)
1 (Good)
926 (Good)
842 (Good)
803 (Good)
705 (Good)
758 (Good)
624 (Good)
697 (Good)
549 (Good)
953 (Good)
1 (Good)
1 (Good)
1 (Good)
1 (Good)
678 (Good)
no2
13 (Good)
23 (Good)
22 (Good)
14 (Good)
30 (Good)
39 (Good)
34 (Good)
30 (Good)
26 (Good)
17 (Good)
13 (Good)
12 (Good)
19 (Good)
17 (Good)
30 (Good)
26 (Good)
43 (Moderate)
33 (Good)
36 (Good)
31 (Good)
o3
124 (Unhealthy for Sensitive Groups)
150 (Unhealthy)
117 (Moderate)
92 (Moderate)
82 (Moderate)
68 (Good)
80 (Moderate)
130 (Unhealthy for Sensitive Groups)
155 (Unhealthy)
127 (Unhealthy for Sensitive Groups)
157 (Unhealthy)
164 (Unhealthy)
160 (Unhealthy)
119 (Moderate)
123 (Unhealthy for Sensitive Groups)
96 (Moderate)
85 (Moderate)
77 (Moderate)
107 (Moderate)
123 (Unhealthy for Sensitive Groups)
pm10
47 (Moderate)
92 (Unhealthy)
87 (Unhealthy)
72 (Unhealthy for Sensitive Groups)
122 (Very Unhealthy)
121 (Very Unhealthy)
89 (Unhealthy)
107 (Unhealthy)
63 (Unhealthy for Sensitive Groups)
45 (Moderate)
41 (Moderate)
41 (Moderate)
73 (Unhealthy for Sensitive Groups)
72 (Unhealthy for Sensitive Groups)
112 (Very Unhealthy)
133 (Very Unhealthy)
141 (Very Unhealthy)
93 (Unhealthy)
131 (Very Unhealthy)
80 (Unhealthy for Sensitive Groups)
so2
11 (Good)
11 (Good)
14 (Good)
12 (Good)
23 (Good)
18 (Good)
12 (Good)
8.9 (Good)
12 (Good)
8.2 (Good)
6.1 (Good)
6.8 (Good)
7.9 (Good)
7.9 (Good)
15 (Good)
25 (Good)
37 (Good)
23 (Good)
15 (Good)
11 (Good)
data source »
环保局子站
Friday, May 27, 2022, 12:00 PM
PM10 179 (Very bad Hazardous)
particulate matter (PM10) suspended dust
PM2,5 35 (Unhealthy for Sensitive Groups)
particulate matter (PM2.5) dust
O3 0.04 (Good)
ozone (O3)
NO2 0 (Good)
nitrogen dioxide (NO2)
SO2 0 (Good)
sulfur dioxide (SO2)
环保局子站
index
2022-05-27
pm10
56
pm25
56
o3
0.03
no2
0
so2
0
环保局子站
2018-10 2020-05

index
2020-05
2020-04
2020-03
2020-02
2020-01
2019-12
2019-11
2019-10
2019-09
2019-08
2019-07
2019-06
2019-05
2019-04
2019-03
2019-02
2019-01
2018-12
2018-11
2018-10
pm25
21
47
43
52
88
83
43
52
26
20
23
24
34
33
70
99
102
60
75
39
co
733
746
823
911
1
1
926
842
803
705
758
624
697
549
953
1
1
1
1
678
no2
13
23
22
14
30
39
34
30
26
17
13
12
19
17
30
26
43
33
36
31
o3
124
150
117
92
82
68
80
130
155
127
157
164
160
119
123
96
85
77
107
123
pm10
47
92
87
72
122
121
89
107
63
45
41
41
73
72
112
133
141
93
131
80
so2
11
11
14
12
23
18
12
8.9
12
8.2
6.1
6.8
7.9
7.9
15
25
37
23
15
11
* Pollution data source:
https://openaq.org
(ChinaAQIData)
The data is licensed under CC-By 4.0
PM10 179 (Very bad Hazardous)
PM2,5 35 (Unhealthy for Sensitive Groups)
O3 0 (Good)
NO2 0 (Good)
SO2 0 (Good)
Data on air pollution from recent days in Mangong
| index | 2022-05-27 |
|---|---|
| pm10 | 56 Unhealthy for Sensitive Groups |
| pm25 | 56 Unhealthy |
| o3 | 0 Good |
| no2 | 0 Good |
| so2 | 0 Good |

| index | 2020-05 | 2020-04 | 2020-03 | 2020-02 | 2020-01 | 2019-12 | 2019-11 | 2019-10 | 2019-09 | 2019-08 | 2019-07 | 2019-06 | 2019-05 | 2019-04 | 2019-03 | 2019-02 | 2019-01 | 2018-12 | 2018-11 | 2018-10 |
|---|---|---|---|---|---|---|---|---|---|---|---|---|---|---|---|---|---|---|---|---|
| pm25 | 21 (Moderate) | 47 (Unhealthy for Sensitive Groups) | 43 (Unhealthy for Sensitive Groups) | 52 (Unhealthy for Sensitive Groups) | 88 (Very Unhealthy) | 83 (Very Unhealthy) | 43 (Unhealthy for Sensitive Groups) | 52 (Unhealthy for Sensitive Groups) | 26 (Moderate) | 20 (Moderate) | 23 (Moderate) | 24 (Moderate) | 34 (Moderate) | 33 (Moderate) | 70 (Unhealthy) | 99 (Very Unhealthy) | 102 (Very Unhealthy) | 60 (Unhealthy) | 75 (Very Unhealthy) | 39 (Unhealthy for Sensitive Groups) |
| co | 733 (Good) | 746 (Good) | 823 (Good) | 911 (Good) | 1 (Good) | 1 (Good) | 926 (Good) | 842 (Good) | 803 (Good) | 705 (Good) | 758 (Good) | 624 (Good) | 697 (Good) | 549 (Good) | 953 (Good) | 1 (Good) | 1 (Good) | 1 (Good) | 1 (Good) | 678 (Good) |
| no2 | 13 (Good) | 23 (Good) | 22 (Good) | 14 (Good) | 30 (Good) | 39 (Good) | 34 (Good) | 30 (Good) | 26 (Good) | 17 (Good) | 13 (Good) | 12 (Good) | 19 (Good) | 17 (Good) | 30 (Good) | 26 (Good) | 43 (Moderate) | 33 (Good) | 36 (Good) | 31 (Good) |
| o3 | 124 (Unhealthy for Sensitive Groups) | 150 (Unhealthy) | 117 (Moderate) | 92 (Moderate) | 82 (Moderate) | 68 (Good) | 80 (Moderate) | 130 (Unhealthy for Sensitive Groups) | 155 (Unhealthy) | 127 (Unhealthy for Sensitive Groups) | 157 (Unhealthy) | 164 (Unhealthy) | 160 (Unhealthy) | 119 (Moderate) | 123 (Unhealthy for Sensitive Groups) | 96 (Moderate) | 85 (Moderate) | 77 (Moderate) | 107 (Moderate) | 123 (Unhealthy for Sensitive Groups) |
| pm10 | 47 (Moderate) | 92 (Unhealthy) | 87 (Unhealthy) | 72 (Unhealthy for Sensitive Groups) | 122 (Very Unhealthy) | 121 (Very Unhealthy) | 89 (Unhealthy) | 107 (Unhealthy) | 63 (Unhealthy for Sensitive Groups) | 45 (Moderate) | 41 (Moderate) | 41 (Moderate) | 73 (Unhealthy for Sensitive Groups) | 72 (Unhealthy for Sensitive Groups) | 112 (Very Unhealthy) | 133 (Very Unhealthy) | 141 (Very Unhealthy) | 93 (Unhealthy) | 131 (Very Unhealthy) | 80 (Unhealthy for Sensitive Groups) |
| so2 | 11 (Good) | 11 (Good) | 14 (Good) | 12 (Good) | 23 (Good) | 18 (Good) | 12 (Good) | 8.9 (Good) | 12 (Good) | 8.2 (Good) | 6.1 (Good) | 6.8 (Good) | 7.9 (Good) | 7.9 (Good) | 15 (Good) | 25 (Good) | 37 (Good) | 23 (Good) | 15 (Good) | 11 (Good) |
PM10 179 (Very bad Hazardous)
particulate matter (PM10) suspended dustPM2,5 35 (Unhealthy for Sensitive Groups)
particulate matter (PM2.5) dustO3 0.04 (Good)
ozone (O3)NO2 0 (Good)
nitrogen dioxide (NO2)SO2 0 (Good)
sulfur dioxide (SO2)环保局子站
| index | 2022-05-27 |
|---|---|
| pm10 | 56 |
| pm25 | 56 |
| o3 | 0.03 |
| no2 | 0 |
| so2 | 0 |
环保局子站
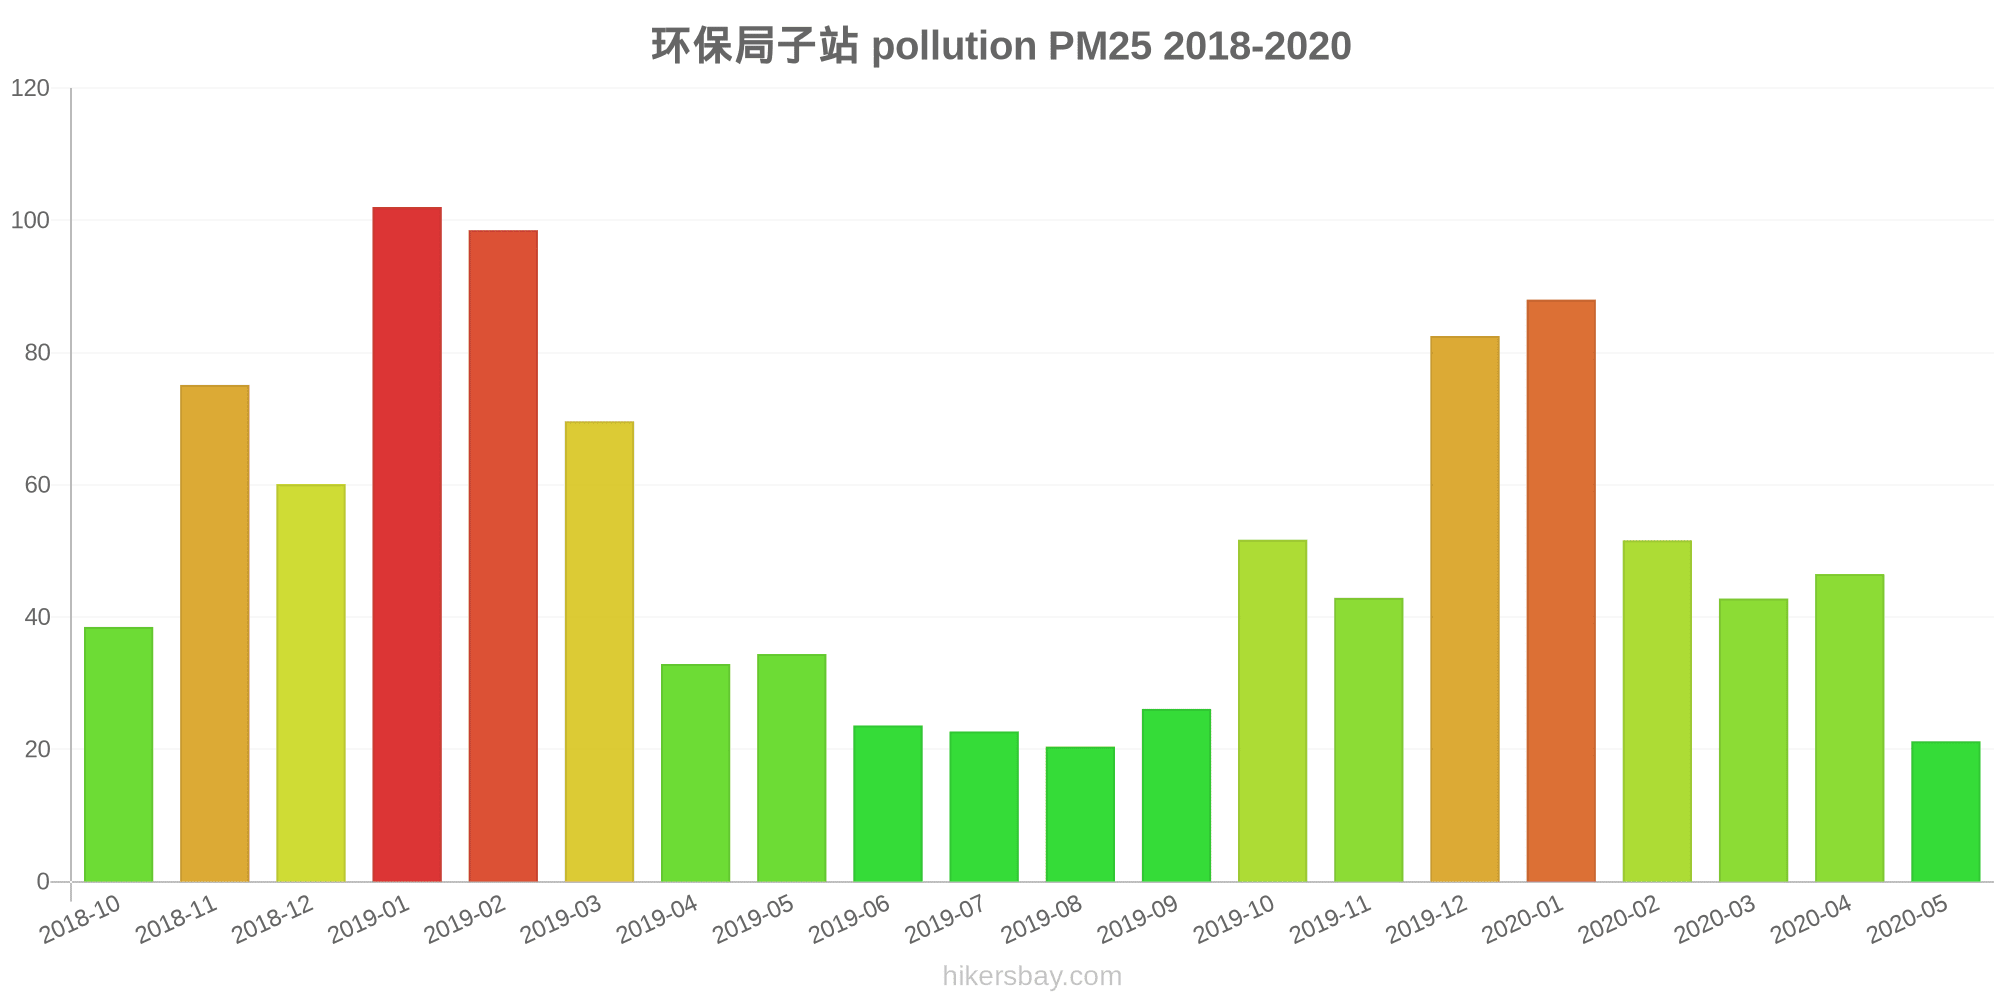
| index | 2020-05 | 2020-04 | 2020-03 | 2020-02 | 2020-01 | 2019-12 | 2019-11 | 2019-10 | 2019-09 | 2019-08 | 2019-07 | 2019-06 | 2019-05 | 2019-04 | 2019-03 | 2019-02 | 2019-01 | 2018-12 | 2018-11 | 2018-10 |
|---|---|---|---|---|---|---|---|---|---|---|---|---|---|---|---|---|---|---|---|---|
| pm25 | 21 | 47 | 43 | 52 | 88 | 83 | 43 | 52 | 26 | 20 | 23 | 24 | 34 | 33 | 70 | 99 | 102 | 60 | 75 | 39 |
| co | 733 | 746 | 823 | 911 | 1 | 1 | 926 | 842 | 803 | 705 | 758 | 624 | 697 | 549 | 953 | 1 | 1 | 1 | 1 | 678 |
| no2 | 13 | 23 | 22 | 14 | 30 | 39 | 34 | 30 | 26 | 17 | 13 | 12 | 19 | 17 | 30 | 26 | 43 | 33 | 36 | 31 |
| o3 | 124 | 150 | 117 | 92 | 82 | 68 | 80 | 130 | 155 | 127 | 157 | 164 | 160 | 119 | 123 | 96 | 85 | 77 | 107 | 123 |
| pm10 | 47 | 92 | 87 | 72 | 122 | 121 | 89 | 107 | 63 | 45 | 41 | 41 | 73 | 72 | 112 | 133 | 141 | 93 | 131 | 80 |
| so2 | 11 | 11 | 14 | 12 | 23 | 18 | 12 | 8.9 | 12 | 8.2 | 6.1 | 6.8 | 7.9 | 7.9 | 15 | 25 | 37 | 23 | 15 | 11 |