Air Pollution in Bulan: Real-time Air Quality Index and smog alert.
Pollution and air quality forecast for Bulan. Today is Tuesday, June 16, 2026. The following air pollution values have been recorded for Bulan:- particulate matter (PM10) suspended dust - 179 (Very bad Hazardous)
- particulate matter (PM2.5) dust - 35 (Unhealthy for Sensitive Groups)
- ozone (O3) - 0 (Good)
- nitrogen dioxide (NO2) - 0 (Good)
- sulfur dioxide (SO2) - 0 (Good)

What is the air quality in Bulan today? Is the air polluted in Bulan?. Is there smog?
What is the level of PM10 today in Bulan? (particulate matter (PM10) suspended dust)
The current level of particulate matter PM10 in Bulan is:
179 (Very bad Hazardous)
The highest PM10 values usually occur in month: 111 (January 2019).
The lowest value of particulate matter PM10 pollution in Bulan is usually recorded in: August (32).
What is the current level of PM2.5 in Bulan? (particulate matter (PM2.5) dust)
Today's PM2.5 level is:
35 (Unhealthy for Sensitive Groups)
For comparison, the highest level of PM2.5 in Bulan in the last 7 days was: 56 (Friday, May 27, 2022) and the lowest: 56 (Friday, May 27, 2022).
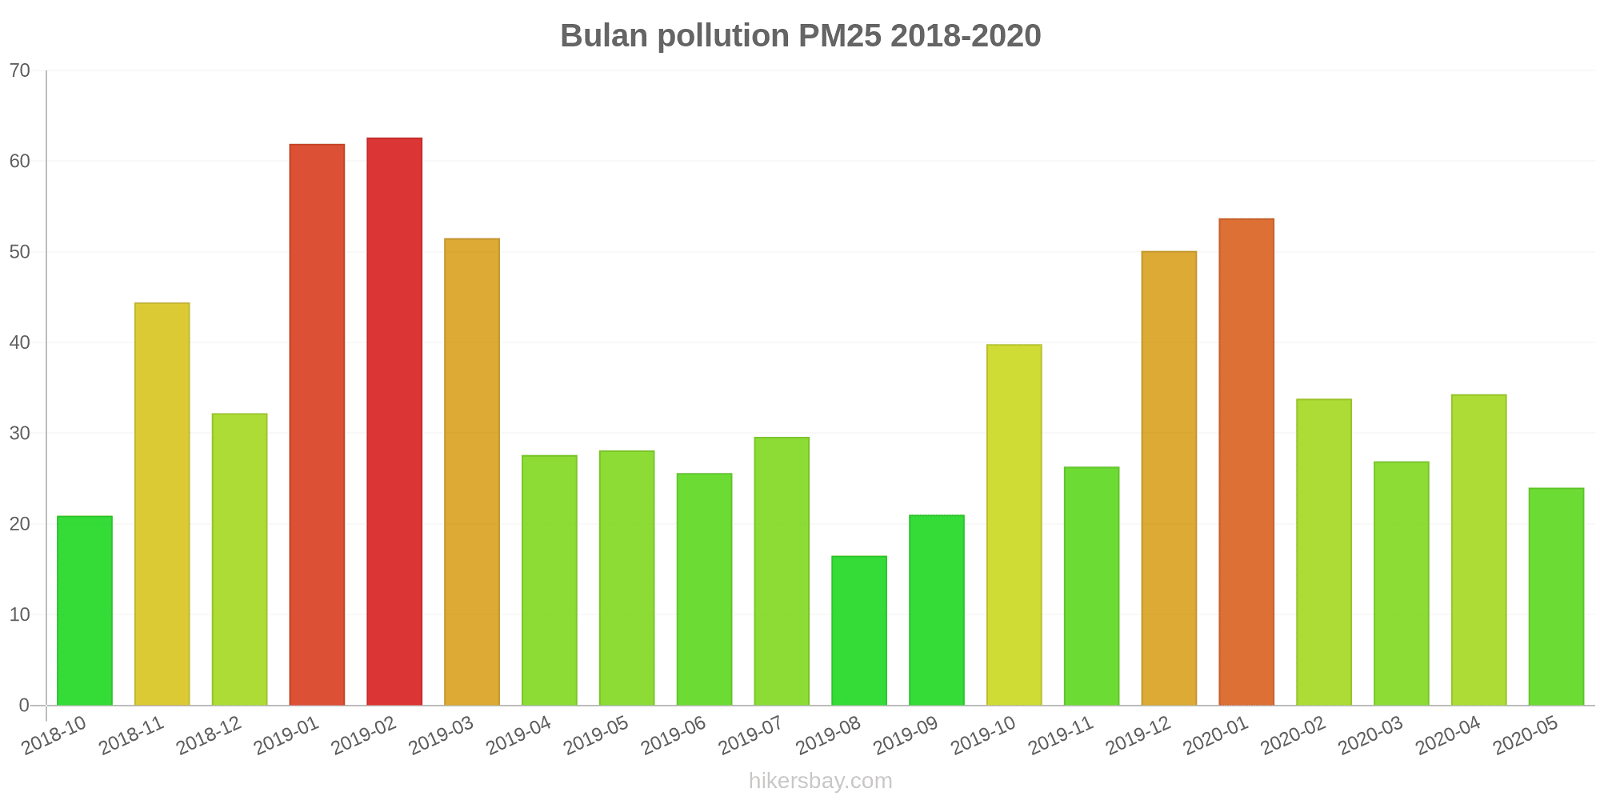
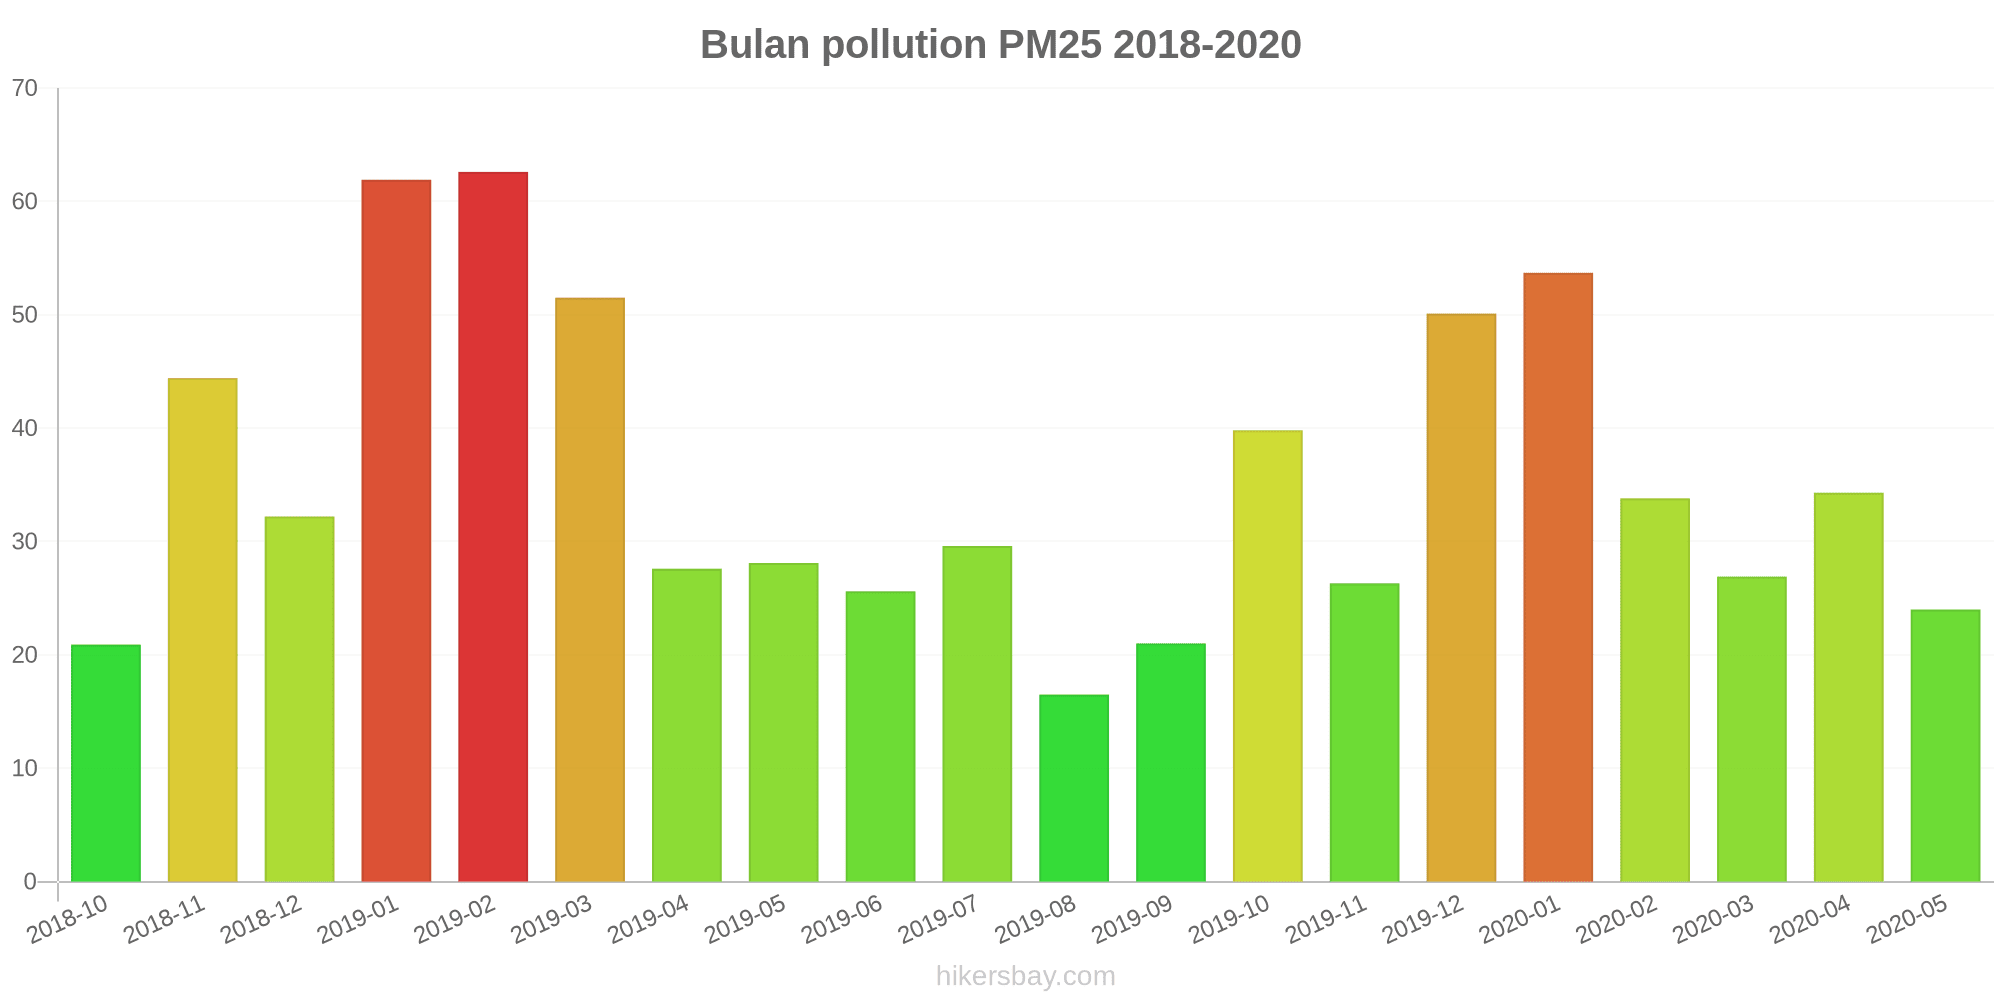
The highest PM2.5 values were recorded: 63 (February 2019).
The lowest level of particulate matter PM2.5 pollution occurs in month: August (17).
How is the O3 level today in Bulan? (ozone (O3))
0 (Good)
How high is the level of NO2? (nitrogen dioxide (NO2))
0 (Good)
What is the level of SO2 pollution? (sulfur dioxide (SO2))
0 (Good)
Current data Friday, May 27, 2022, 12:00 PM
PM10 179 (Very bad Hazardous)
PM2,5 35 (Unhealthy for Sensitive Groups)
O3 0 (Good)
NO2 0 (Good)
SO2 0 (Good)
Data on air pollution from recent days in Bulan
index
2022-05-27
pm10
56
Unhealthy for Sensitive Groups
pm25
56
Unhealthy
o3
0
Good
no2
0
Good
so2
0
Good
data source »
Air pollution in Bulan from October 2018 to May 2020
index
2020-05
2020-04
2020-03
2020-02
2020-01
2019-12
2019-11
2019-10
2019-09
2019-08
2019-07
2019-06
2019-05
2019-04
2019-03
2019-02
2019-01
2018-12
2018-11
2018-10
pm25
24 (Moderate)
34 (Moderate)
27 (Moderate)
34 (Moderate)
54 (Unhealthy for Sensitive Groups)
50 (Unhealthy for Sensitive Groups)
26 (Moderate)
40 (Unhealthy for Sensitive Groups)
21 (Moderate)
17 (Moderate)
30 (Moderate)
26 (Moderate)
28 (Moderate)
28 (Moderate)
52 (Unhealthy for Sensitive Groups)
63 (Unhealthy)
62 (Unhealthy)
32 (Moderate)
44 (Unhealthy for Sensitive Groups)
21 (Moderate)
co
453 (Good)
584 (Good)
599 (Good)
761 (Good)
846 (Good)
750 (Good)
540 (Good)
403 (Good)
365 (Good)
596 (Good)
527 (Good)
378 (Good)
341 (Good)
388 (Good)
407 (Good)
543 (Good)
773 (Good)
521 (Good)
510 (Good)
309 (Good)
no2
22 (Good)
28 (Good)
25 (Good)
18 (Good)
34 (Good)
35 (Good)
30 (Good)
30 (Good)
23 (Good)
18 (Good)
16 (Good)
18 (Good)
21 (Good)
25 (Good)
38 (Good)
30 (Good)
37 (Good)
28 (Good)
37 (Good)
24 (Good)
o3
137 (Unhealthy for Sensitive Groups)
132 (Unhealthy for Sensitive Groups)
106 (Moderate)
93 (Moderate)
76 (Moderate)
71 (Moderate)
81 (Moderate)
129 (Unhealthy for Sensitive Groups)
146 (Unhealthy for Sensitive Groups)
136 (Unhealthy for Sensitive Groups)
151 (Unhealthy)
146 (Unhealthy for Sensitive Groups)
169 (Unhealthy)
122 (Unhealthy for Sensitive Groups)
115 (Moderate)
95 (Moderate)
73 (Moderate)
75 (Moderate)
98 (Moderate)
103 (Moderate)
pm10
53 (Unhealthy for Sensitive Groups)
73 (Unhealthy for Sensitive Groups)
61 (Unhealthy for Sensitive Groups)
47 (Moderate)
73 (Unhealthy for Sensitive Groups)
74 (Unhealthy for Sensitive Groups)
55 (Unhealthy for Sensitive Groups)
81 (Unhealthy)
42 (Moderate)
32 (Moderate)
44 (Moderate)
44 (Moderate)
70 (Unhealthy for Sensitive Groups)
70 (Unhealthy for Sensitive Groups)
97 (Unhealthy)
106 (Unhealthy)
111 (Very Unhealthy)
74 (Unhealthy for Sensitive Groups)
105 (Unhealthy)
61 (Unhealthy for Sensitive Groups)
so2
8.4 (Good)
9.9 (Good)
8.8 (Good)
7.8 (Good)
12 (Good)
10 (Good)
8.3 (Good)
8.1 (Good)
7 (Good)
6.7 (Good)
5.7 (Good)
5.2 (Good)
6.8 (Good)
5.9 (Good)
9.5 (Good)
11 (Good)
15 (Good)
11 (Good)
8.7 (Good)
3.6 (Good)
data source »
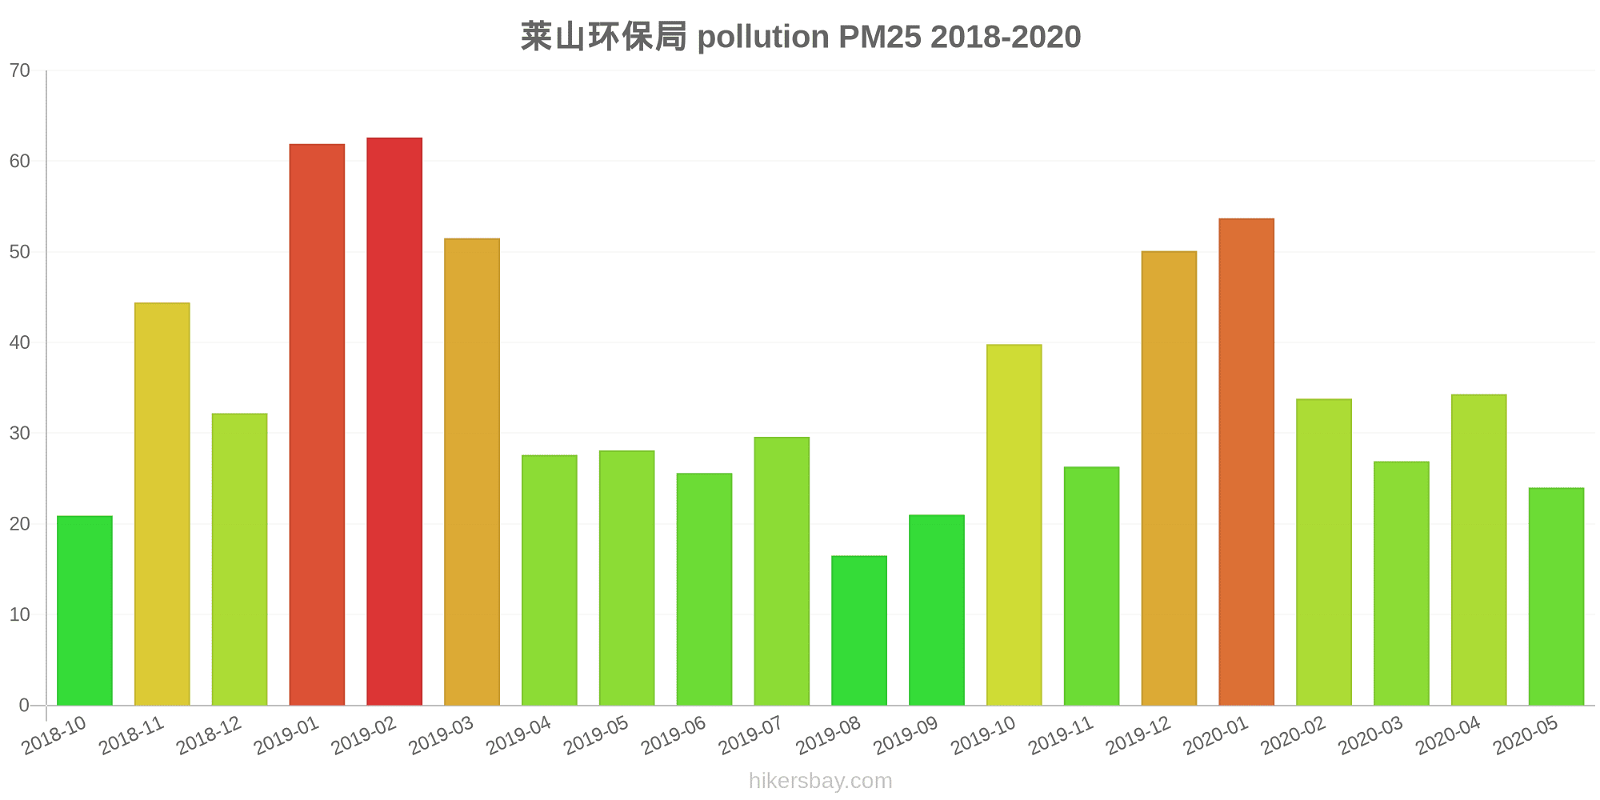
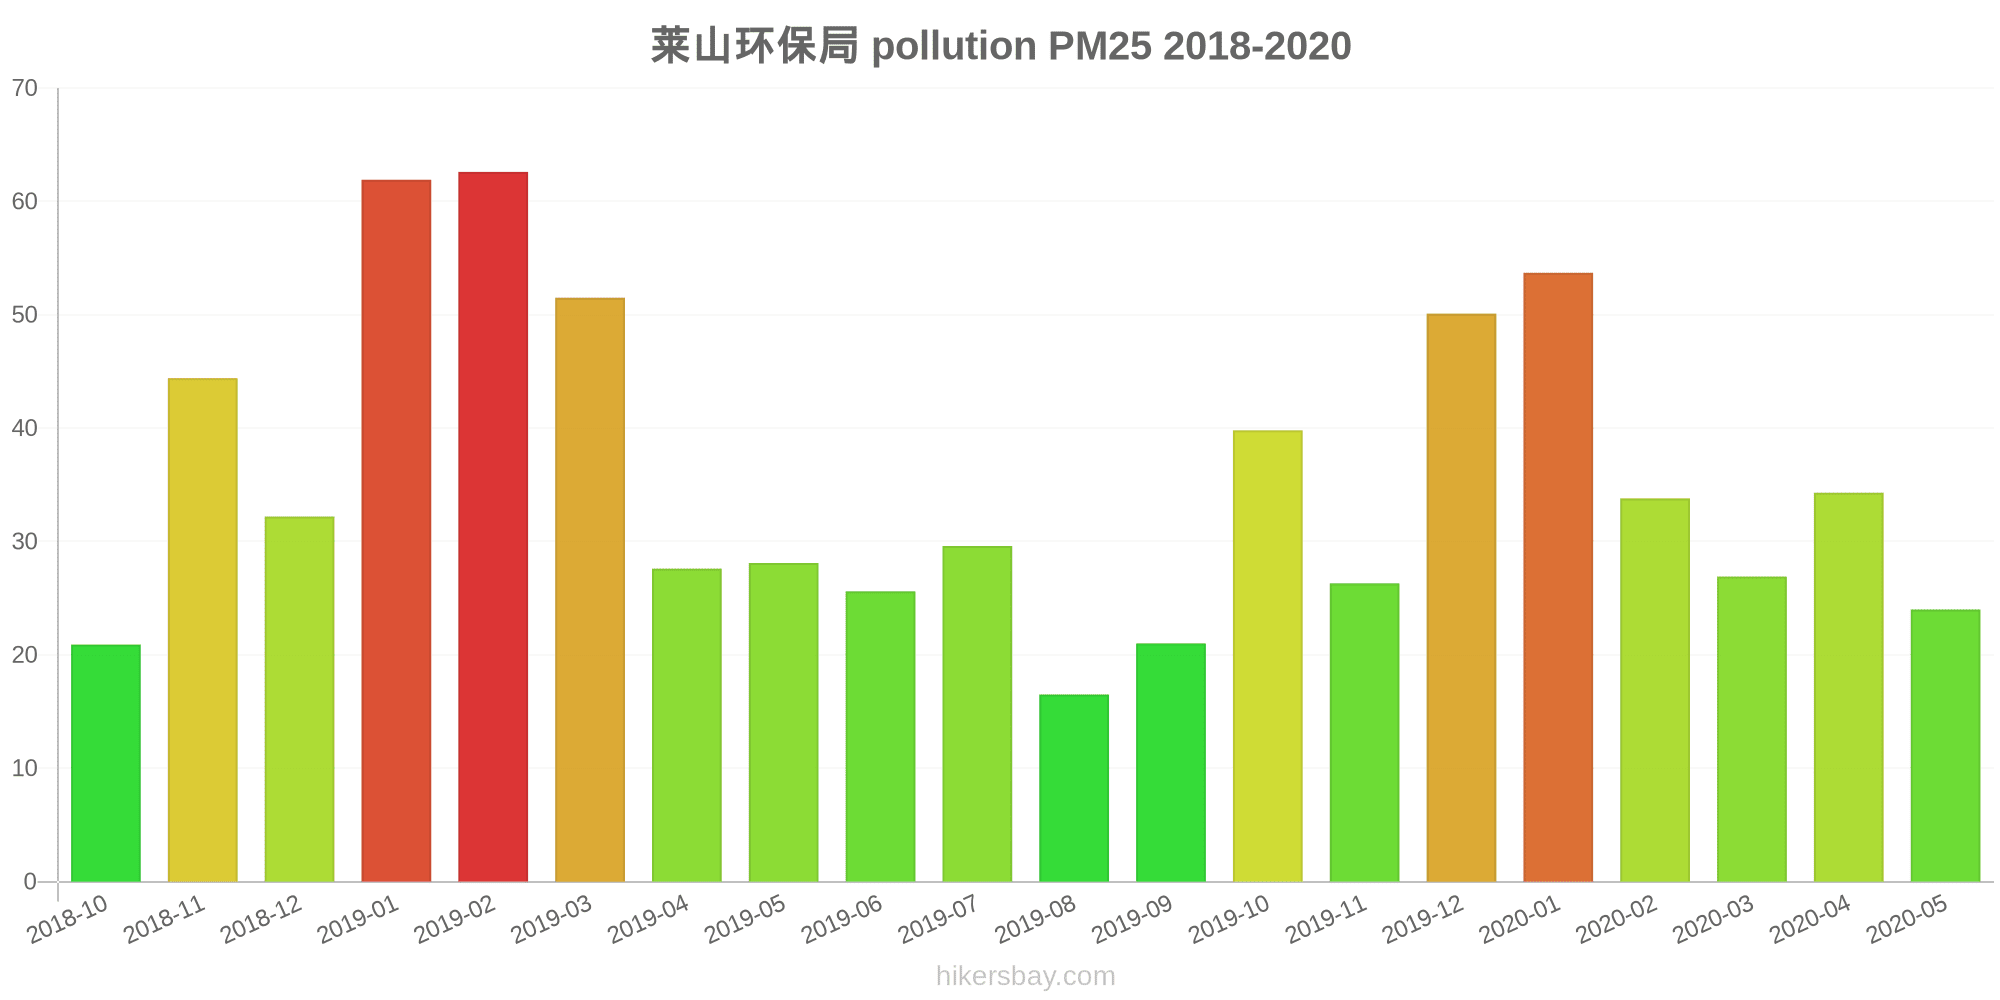
莱山环保局
Friday, May 27, 2022, 12:00 PM
PM10 179 (Very bad Hazardous)
particulate matter (PM10) suspended dust
PM2,5 35 (Unhealthy for Sensitive Groups)
particulate matter (PM2.5) dust
O3 0.04 (Good)
ozone (O3)
NO2 0 (Good)
nitrogen dioxide (NO2)
SO2 0 (Good)
sulfur dioxide (SO2)
莱山环保局
index
2022-05-27
pm10
56
pm25
56
o3
0.03
no2
0
so2
0
莱山环保局
2018-10 2020-05
index
2020-05
2020-04
2020-03
2020-02
2020-01
2019-12
2019-11
2019-10
2019-09
2019-08
2019-07
2019-06
2019-05
2019-04
2019-03
2019-02
2019-01
2018-12
2018-11
2018-10
pm25
24
34
27
34
54
50
26
40
21
17
30
26
28
28
52
63
62
32
44
21
co
453
584
599
761
846
750
540
403
365
596
527
378
341
388
407
543
773
521
510
309
no2
22
28
25
18
34
35
30
30
23
18
16
18
21
25
38
30
37
28
37
24
o3
137
132
106
93
76
71
81
129
146
136
151
146
169
122
115
95
73
75
98
103
pm10
53
73
61
47
73
74
55
81
42
32
44
44
70
70
97
106
111
74
105
61
so2
8.4
9.9
8.8
7.8
12
10
8.3
8.1
7
6.7
5.7
5.2
6.8
5.9
9.5
11
15
11
8.7
3.6
* Pollution data source:
https://openaq.org
(ChinaAQIData)
The data is licensed under CC-By 4.0
PM10 179 (Very bad Hazardous)
PM2,5 35 (Unhealthy for Sensitive Groups)
O3 0 (Good)
NO2 0 (Good)
SO2 0 (Good)
Data on air pollution from recent days in Bulan
| index | 2022-05-27 |
|---|---|
| pm10 | 56 Unhealthy for Sensitive Groups |
| pm25 | 56 Unhealthy |
| o3 | 0 Good |
| no2 | 0 Good |
| so2 | 0 Good |
| index | 2020-05 | 2020-04 | 2020-03 | 2020-02 | 2020-01 | 2019-12 | 2019-11 | 2019-10 | 2019-09 | 2019-08 | 2019-07 | 2019-06 | 2019-05 | 2019-04 | 2019-03 | 2019-02 | 2019-01 | 2018-12 | 2018-11 | 2018-10 |
|---|---|---|---|---|---|---|---|---|---|---|---|---|---|---|---|---|---|---|---|---|
| pm25 | 24 (Moderate) | 34 (Moderate) | 27 (Moderate) | 34 (Moderate) | 54 (Unhealthy for Sensitive Groups) | 50 (Unhealthy for Sensitive Groups) | 26 (Moderate) | 40 (Unhealthy for Sensitive Groups) | 21 (Moderate) | 17 (Moderate) | 30 (Moderate) | 26 (Moderate) | 28 (Moderate) | 28 (Moderate) | 52 (Unhealthy for Sensitive Groups) | 63 (Unhealthy) | 62 (Unhealthy) | 32 (Moderate) | 44 (Unhealthy for Sensitive Groups) | 21 (Moderate) |
| co | 453 (Good) | 584 (Good) | 599 (Good) | 761 (Good) | 846 (Good) | 750 (Good) | 540 (Good) | 403 (Good) | 365 (Good) | 596 (Good) | 527 (Good) | 378 (Good) | 341 (Good) | 388 (Good) | 407 (Good) | 543 (Good) | 773 (Good) | 521 (Good) | 510 (Good) | 309 (Good) |
| no2 | 22 (Good) | 28 (Good) | 25 (Good) | 18 (Good) | 34 (Good) | 35 (Good) | 30 (Good) | 30 (Good) | 23 (Good) | 18 (Good) | 16 (Good) | 18 (Good) | 21 (Good) | 25 (Good) | 38 (Good) | 30 (Good) | 37 (Good) | 28 (Good) | 37 (Good) | 24 (Good) |
| o3 | 137 (Unhealthy for Sensitive Groups) | 132 (Unhealthy for Sensitive Groups) | 106 (Moderate) | 93 (Moderate) | 76 (Moderate) | 71 (Moderate) | 81 (Moderate) | 129 (Unhealthy for Sensitive Groups) | 146 (Unhealthy for Sensitive Groups) | 136 (Unhealthy for Sensitive Groups) | 151 (Unhealthy) | 146 (Unhealthy for Sensitive Groups) | 169 (Unhealthy) | 122 (Unhealthy for Sensitive Groups) | 115 (Moderate) | 95 (Moderate) | 73 (Moderate) | 75 (Moderate) | 98 (Moderate) | 103 (Moderate) |
| pm10 | 53 (Unhealthy for Sensitive Groups) | 73 (Unhealthy for Sensitive Groups) | 61 (Unhealthy for Sensitive Groups) | 47 (Moderate) | 73 (Unhealthy for Sensitive Groups) | 74 (Unhealthy for Sensitive Groups) | 55 (Unhealthy for Sensitive Groups) | 81 (Unhealthy) | 42 (Moderate) | 32 (Moderate) | 44 (Moderate) | 44 (Moderate) | 70 (Unhealthy for Sensitive Groups) | 70 (Unhealthy for Sensitive Groups) | 97 (Unhealthy) | 106 (Unhealthy) | 111 (Very Unhealthy) | 74 (Unhealthy for Sensitive Groups) | 105 (Unhealthy) | 61 (Unhealthy for Sensitive Groups) |
| so2 | 8.4 (Good) | 9.9 (Good) | 8.8 (Good) | 7.8 (Good) | 12 (Good) | 10 (Good) | 8.3 (Good) | 8.1 (Good) | 7 (Good) | 6.7 (Good) | 5.7 (Good) | 5.2 (Good) | 6.8 (Good) | 5.9 (Good) | 9.5 (Good) | 11 (Good) | 15 (Good) | 11 (Good) | 8.7 (Good) | 3.6 (Good) |
PM10 179 (Very bad Hazardous)
particulate matter (PM10) suspended dustPM2,5 35 (Unhealthy for Sensitive Groups)
particulate matter (PM2.5) dustO3 0.04 (Good)
ozone (O3)NO2 0 (Good)
nitrogen dioxide (NO2)SO2 0 (Good)
sulfur dioxide (SO2)莱山环保局
| index | 2022-05-27 |
|---|---|
| pm10 | 56 |
| pm25 | 56 |
| o3 | 0.03 |
| no2 | 0 |
| so2 | 0 |
莱山环保局
| index | 2020-05 | 2020-04 | 2020-03 | 2020-02 | 2020-01 | 2019-12 | 2019-11 | 2019-10 | 2019-09 | 2019-08 | 2019-07 | 2019-06 | 2019-05 | 2019-04 | 2019-03 | 2019-02 | 2019-01 | 2018-12 | 2018-11 | 2018-10 |
|---|---|---|---|---|---|---|---|---|---|---|---|---|---|---|---|---|---|---|---|---|
| pm25 | 24 | 34 | 27 | 34 | 54 | 50 | 26 | 40 | 21 | 17 | 30 | 26 | 28 | 28 | 52 | 63 | 62 | 32 | 44 | 21 |
| co | 453 | 584 | 599 | 761 | 846 | 750 | 540 | 403 | 365 | 596 | 527 | 378 | 341 | 388 | 407 | 543 | 773 | 521 | 510 | 309 |
| no2 | 22 | 28 | 25 | 18 | 34 | 35 | 30 | 30 | 23 | 18 | 16 | 18 | 21 | 25 | 38 | 30 | 37 | 28 | 37 | 24 |
| o3 | 137 | 132 | 106 | 93 | 76 | 71 | 81 | 129 | 146 | 136 | 151 | 146 | 169 | 122 | 115 | 95 | 73 | 75 | 98 | 103 |
| pm10 | 53 | 73 | 61 | 47 | 73 | 74 | 55 | 81 | 42 | 32 | 44 | 44 | 70 | 70 | 97 | 106 | 111 | 74 | 105 | 61 |
| so2 | 8.4 | 9.9 | 8.8 | 7.8 | 12 | 10 | 8.3 | 8.1 | 7 | 6.7 | 5.7 | 5.2 | 6.8 | 5.9 | 9.5 | 11 | 15 | 11 | 8.7 | 3.6 |