Air Pollution in Guangzhoulu: Real-time Air Quality Index and smog alert.
Pollution and air quality forecast for Guangzhoulu. Today is Tuesday, June 2, 2026. The following air pollution values have been recorded for Guangzhoulu:- particulate matter (PM10) suspended dust - 7 (Good)
- particulate matter (PM2.5) dust - 2 (Good)
- carbon monoxide (CO) - 100 (Good)
- nitrogen dioxide (NO2) - 8 (Good)
- ozone (O3) - 0 (Good)
- sulfur dioxide (SO2) - 9 (Good)

What is the air quality in Guangzhoulu today? Is the air polluted in Guangzhoulu?. Is there smog?
What is the level of PM10 today in Guangzhoulu? (particulate matter (PM10) suspended dust)
The current level of particulate matter PM10 in Guangzhoulu is:
7 (Good)
The highest PM10 values usually occur in month: 182 (May 2020).
The lowest value of particulate matter PM10 pollution in Guangzhoulu is usually recorded in: July (36).
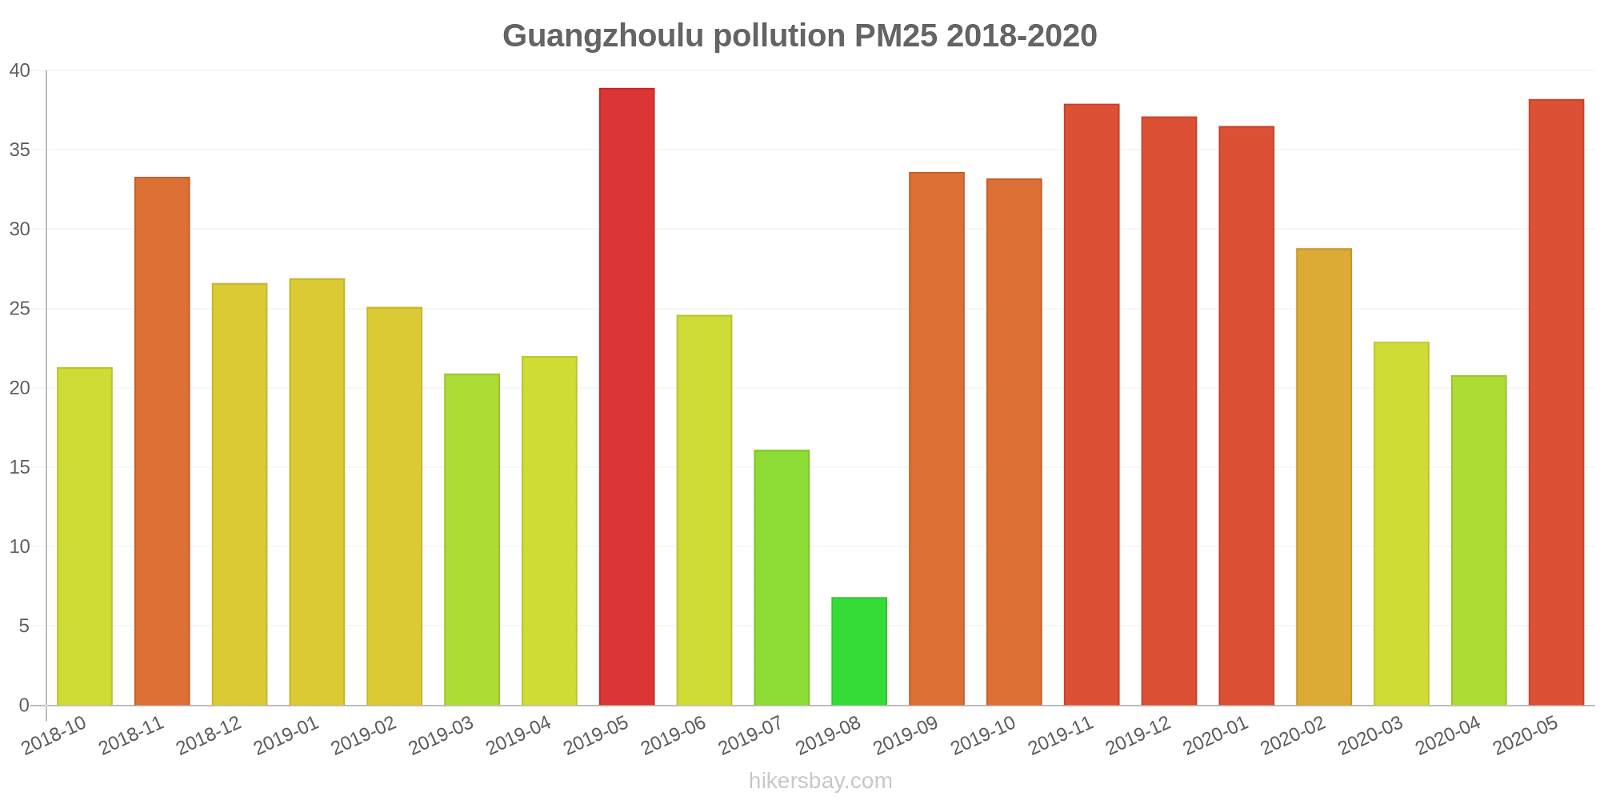
What is the current level of PM2.5 in Guangzhoulu? (particulate matter (PM2.5) dust)
Today's PM2.5 level is:
2 (Good)
For comparison, the highest level of PM2.5 in Guangzhoulu in the last 7 days was: 24 (Friday, May 27, 2022) and the lowest: 24 (Friday, May 27, 2022).
The highest PM2.5 values were recorded: 39 (May 2019).
The lowest level of particulate matter PM2.5 pollution occurs in month: August (6.8).
How high is the CO level? (carbon monoxide (CO))
100 (Good)
How high is the level of NO2? (nitrogen dioxide (NO2))
8 (Good)
How is the O3 level today in Guangzhoulu? (ozone (O3))
0 (Good)
What is the level of SO2 pollution? (sulfur dioxide (SO2))
9 (Good)
Current data Friday, May 27, 2022, 12:00 PM
PM10 7 (Good)
PM2,5 2 (Good)
CO 100 (Good)
NO2 8 (Good)
O3 0 (Good)
SO2 9 (Good)
Data on air pollution from recent days in Guangzhoulu
index
2022-05-27
pm10
32
Moderate
pm25
24
Moderate
co
468
Good
no2
21
Good
o3
32
Good
so2
5
Good
data source »
Air pollution in Guangzhoulu from October 2018 to May 2020
index
2020-05
2020-04
2020-03
2020-02
2020-01
2019-12
2019-11
2019-10
2019-09
2019-08
2019-07
2019-06
2019-05
2019-04
2019-03
2019-02
2019-01
2018-12
2018-11
2018-10
pm25
38 (Unhealthy for Sensitive Groups)
21 (Moderate)
23 (Moderate)
29 (Moderate)
37 (Unhealthy for Sensitive Groups)
37 (Unhealthy for Sensitive Groups)
38 (Unhealthy for Sensitive Groups)
33 (Moderate)
34 (Moderate)
6.8 (Good)
16 (Moderate)
25 (Moderate)
39 (Unhealthy for Sensitive Groups)
22 (Moderate)
21 (Moderate)
25 (Moderate)
27 (Moderate)
27 (Moderate)
33 (Moderate)
21 (Moderate)
co
576 (Good)
576 (Good)
578 (Good)
682 (Good)
821 (Good)
781 (Good)
740 (Good)
666 (Good)
643 (Good)
583 (Good)
526 (Good)
496 (Good)
483 (Good)
569 (Good)
592 (Good)
711 (Good)
798 (Good)
699 (Good)
658 (Good)
535 (Good)
no2
8.1 (Good)
11 (Good)
9.9 (Good)
12 (Good)
18 (Good)
22 (Good)
21 (Good)
17 (Good)
16 (Good)
11 (Good)
12 (Good)
9.5 (Good)
11 (Good)
12 (Good)
13 (Good)
12 (Good)
21 (Good)
21 (Good)
23 (Good)
20 (Good)
o3
124 (Unhealthy for Sensitive Groups)
124 (Unhealthy for Sensitive Groups)
110 (Moderate)
96 (Moderate)
81 (Moderate)
90 (Moderate)
92 (Moderate)
97 (Moderate)
117 (Moderate)
130 (Unhealthy for Sensitive Groups)
138 (Unhealthy for Sensitive Groups)
138 (Unhealthy for Sensitive Groups)
135 (Unhealthy for Sensitive Groups)
128 (Unhealthy for Sensitive Groups)
117 (Moderate)
98 (Moderate)
77 (Moderate)
64 (Good)
77 (Moderate)
92 (Moderate)
pm10
182 (Very bad Hazardous)
90 (Unhealthy)
83 (Unhealthy)
84 (Unhealthy)
63 (Unhealthy for Sensitive Groups)
57 (Unhealthy for Sensitive Groups)
65 (Unhealthy for Sensitive Groups)
61 (Unhealthy for Sensitive Groups)
68 (Unhealthy for Sensitive Groups)
40 (Moderate)
36 (Moderate)
50 (Unhealthy for Sensitive Groups)
172 (Very bad Hazardous)
103 (Unhealthy)
92 (Unhealthy)
95 (Unhealthy)
68 (Unhealthy for Sensitive Groups)
133 (Very Unhealthy)
165 (Very bad Hazardous)
105 (Unhealthy)
so2
14 (Good)
22 (Good)
15 (Good)
21 (Good)
21 (Good)
36 (Good)
20 (Good)
13 (Good)
14 (Good)
18 (Good)
15 (Good)
12 (Good)
19 (Good)
14 (Good)
12 (Good)
23 (Good)
28 (Good)
29 (Good)
28 (Good)
20 (Good)
data source »
公司二招
Friday, May 27, 2022, 12:00 PM
PM10 6.7 (Good)
particulate matter (PM10) suspended dust
PM2,5 1.7 (Good)
particulate matter (PM2.5) dust
CO 100 (Good)
carbon monoxide (CO)
NO2 7.6 (Good)
nitrogen dioxide (NO2)
O3 0.02 (Good)
ozone (O3)
SO2 8.6 (Good)
sulfur dioxide (SO2)
公司二招
index
2022-05-27
pm10
32
pm25
24
co
468
no2
21
o3
32
so2
4.6
公司二招
2018-10 2020-05

index
2020-05
2020-04
2020-03
2020-02
2020-01
2019-12
2019-11
2019-10
2019-09
2019-08
2019-07
2019-06
2019-05
2019-04
2019-03
2019-02
2019-01
2018-12
2018-11
2018-10
pm25
38
21
23
29
37
37
38
33
34
6.8
16
25
39
22
21
25
27
27
33
21
co
576
576
578
682
821
781
740
666
643
583
526
496
483
569
592
711
798
699
658
535
no2
8.1
11
9.9
12
18
22
21
17
16
11
12
9.5
11
12
13
12
21
21
23
20
o3
124
124
110
96
81
90
92
97
117
130
138
138
135
128
117
98
77
64
77
92
pm10
182
90
83
84
63
57
65
61
68
40
36
50
172
103
92
95
68
133
165
105
so2
14
22
15
21
21
36
20
13
14
18
15
12
19
14
12
23
28
29
28
20
* Pollution data source:
https://openaq.org
(ChinaAQIData)
The data is licensed under CC-By 4.0
PM10 7 (Good)
PM2,5 2 (Good)
CO 100 (Good)
NO2 8 (Good)
O3 0 (Good)
SO2 9 (Good)
Data on air pollution from recent days in Guangzhoulu
| index | 2022-05-27 |
|---|---|
| pm10 | 32 Moderate |
| pm25 | 24 Moderate |
| co | 468 Good |
| no2 | 21 Good |
| o3 | 32 Good |
| so2 | 5 Good |

| index | 2020-05 | 2020-04 | 2020-03 | 2020-02 | 2020-01 | 2019-12 | 2019-11 | 2019-10 | 2019-09 | 2019-08 | 2019-07 | 2019-06 | 2019-05 | 2019-04 | 2019-03 | 2019-02 | 2019-01 | 2018-12 | 2018-11 | 2018-10 |
|---|---|---|---|---|---|---|---|---|---|---|---|---|---|---|---|---|---|---|---|---|
| pm25 | 38 (Unhealthy for Sensitive Groups) | 21 (Moderate) | 23 (Moderate) | 29 (Moderate) | 37 (Unhealthy for Sensitive Groups) | 37 (Unhealthy for Sensitive Groups) | 38 (Unhealthy for Sensitive Groups) | 33 (Moderate) | 34 (Moderate) | 6.8 (Good) | 16 (Moderate) | 25 (Moderate) | 39 (Unhealthy for Sensitive Groups) | 22 (Moderate) | 21 (Moderate) | 25 (Moderate) | 27 (Moderate) | 27 (Moderate) | 33 (Moderate) | 21 (Moderate) |
| co | 576 (Good) | 576 (Good) | 578 (Good) | 682 (Good) | 821 (Good) | 781 (Good) | 740 (Good) | 666 (Good) | 643 (Good) | 583 (Good) | 526 (Good) | 496 (Good) | 483 (Good) | 569 (Good) | 592 (Good) | 711 (Good) | 798 (Good) | 699 (Good) | 658 (Good) | 535 (Good) |
| no2 | 8.1 (Good) | 11 (Good) | 9.9 (Good) | 12 (Good) | 18 (Good) | 22 (Good) | 21 (Good) | 17 (Good) | 16 (Good) | 11 (Good) | 12 (Good) | 9.5 (Good) | 11 (Good) | 12 (Good) | 13 (Good) | 12 (Good) | 21 (Good) | 21 (Good) | 23 (Good) | 20 (Good) |
| o3 | 124 (Unhealthy for Sensitive Groups) | 124 (Unhealthy for Sensitive Groups) | 110 (Moderate) | 96 (Moderate) | 81 (Moderate) | 90 (Moderate) | 92 (Moderate) | 97 (Moderate) | 117 (Moderate) | 130 (Unhealthy for Sensitive Groups) | 138 (Unhealthy for Sensitive Groups) | 138 (Unhealthy for Sensitive Groups) | 135 (Unhealthy for Sensitive Groups) | 128 (Unhealthy for Sensitive Groups) | 117 (Moderate) | 98 (Moderate) | 77 (Moderate) | 64 (Good) | 77 (Moderate) | 92 (Moderate) |
| pm10 | 182 (Very bad Hazardous) | 90 (Unhealthy) | 83 (Unhealthy) | 84 (Unhealthy) | 63 (Unhealthy for Sensitive Groups) | 57 (Unhealthy for Sensitive Groups) | 65 (Unhealthy for Sensitive Groups) | 61 (Unhealthy for Sensitive Groups) | 68 (Unhealthy for Sensitive Groups) | 40 (Moderate) | 36 (Moderate) | 50 (Unhealthy for Sensitive Groups) | 172 (Very bad Hazardous) | 103 (Unhealthy) | 92 (Unhealthy) | 95 (Unhealthy) | 68 (Unhealthy for Sensitive Groups) | 133 (Very Unhealthy) | 165 (Very bad Hazardous) | 105 (Unhealthy) |
| so2 | 14 (Good) | 22 (Good) | 15 (Good) | 21 (Good) | 21 (Good) | 36 (Good) | 20 (Good) | 13 (Good) | 14 (Good) | 18 (Good) | 15 (Good) | 12 (Good) | 19 (Good) | 14 (Good) | 12 (Good) | 23 (Good) | 28 (Good) | 29 (Good) | 28 (Good) | 20 (Good) |
PM10 6.7 (Good)
particulate matter (PM10) suspended dustPM2,5 1.7 (Good)
particulate matter (PM2.5) dustCO 100 (Good)
carbon monoxide (CO)NO2 7.6 (Good)
nitrogen dioxide (NO2)O3 0.02 (Good)
ozone (O3)SO2 8.6 (Good)
sulfur dioxide (SO2)公司二招
| index | 2022-05-27 |
|---|---|
| pm10 | 32 |
| pm25 | 24 |
| co | 468 |
| no2 | 21 |
| o3 | 32 |
| so2 | 4.6 |
公司二招

| index | 2020-05 | 2020-04 | 2020-03 | 2020-02 | 2020-01 | 2019-12 | 2019-11 | 2019-10 | 2019-09 | 2019-08 | 2019-07 | 2019-06 | 2019-05 | 2019-04 | 2019-03 | 2019-02 | 2019-01 | 2018-12 | 2018-11 | 2018-10 |
|---|---|---|---|---|---|---|---|---|---|---|---|---|---|---|---|---|---|---|---|---|
| pm25 | 38 | 21 | 23 | 29 | 37 | 37 | 38 | 33 | 34 | 6.8 | 16 | 25 | 39 | 22 | 21 | 25 | 27 | 27 | 33 | 21 |
| co | 576 | 576 | 578 | 682 | 821 | 781 | 740 | 666 | 643 | 583 | 526 | 496 | 483 | 569 | 592 | 711 | 798 | 699 | 658 | 535 |
| no2 | 8.1 | 11 | 9.9 | 12 | 18 | 22 | 21 | 17 | 16 | 11 | 12 | 9.5 | 11 | 12 | 13 | 12 | 21 | 21 | 23 | 20 |
| o3 | 124 | 124 | 110 | 96 | 81 | 90 | 92 | 97 | 117 | 130 | 138 | 138 | 135 | 128 | 117 | 98 | 77 | 64 | 77 | 92 |
| pm10 | 182 | 90 | 83 | 84 | 63 | 57 | 65 | 61 | 68 | 40 | 36 | 50 | 172 | 103 | 92 | 95 | 68 | 133 | 165 | 105 |
| so2 | 14 | 22 | 15 | 21 | 21 | 36 | 20 | 13 | 14 | 18 | 15 | 12 | 19 | 14 | 12 | 23 | 28 | 29 | 28 | 20 |