Air Pollution in Furong Beilu: Real-time Air Quality Index and smog alert.
Pollution and air quality forecast for Furong Beilu. Today is Tuesday, June 16, 2026. The following air pollution values have been recorded for Furong Beilu:- particulate matter (PM10) suspended dust - 179 (Very bad Hazardous)
- particulate matter (PM2.5) dust - 35 (Unhealthy for Sensitive Groups)
- ozone (O3) - 0 (Good)
- nitrogen dioxide (NO2) - 0 (Good)
- sulfur dioxide (SO2) - 0 (Good)

What is the air quality in Furong Beilu today? Is the air polluted in Furong Beilu?. Is there smog?
What is the level of PM10 today in Furong Beilu? (particulate matter (PM10) suspended dust)
The current level of particulate matter PM10 in Furong Beilu is:
179 (Very bad Hazardous)
The highest PM10 values usually occur in month: 98 (January 2019).
The lowest value of particulate matter PM10 pollution in Furong Beilu is usually recorded in: July (37).
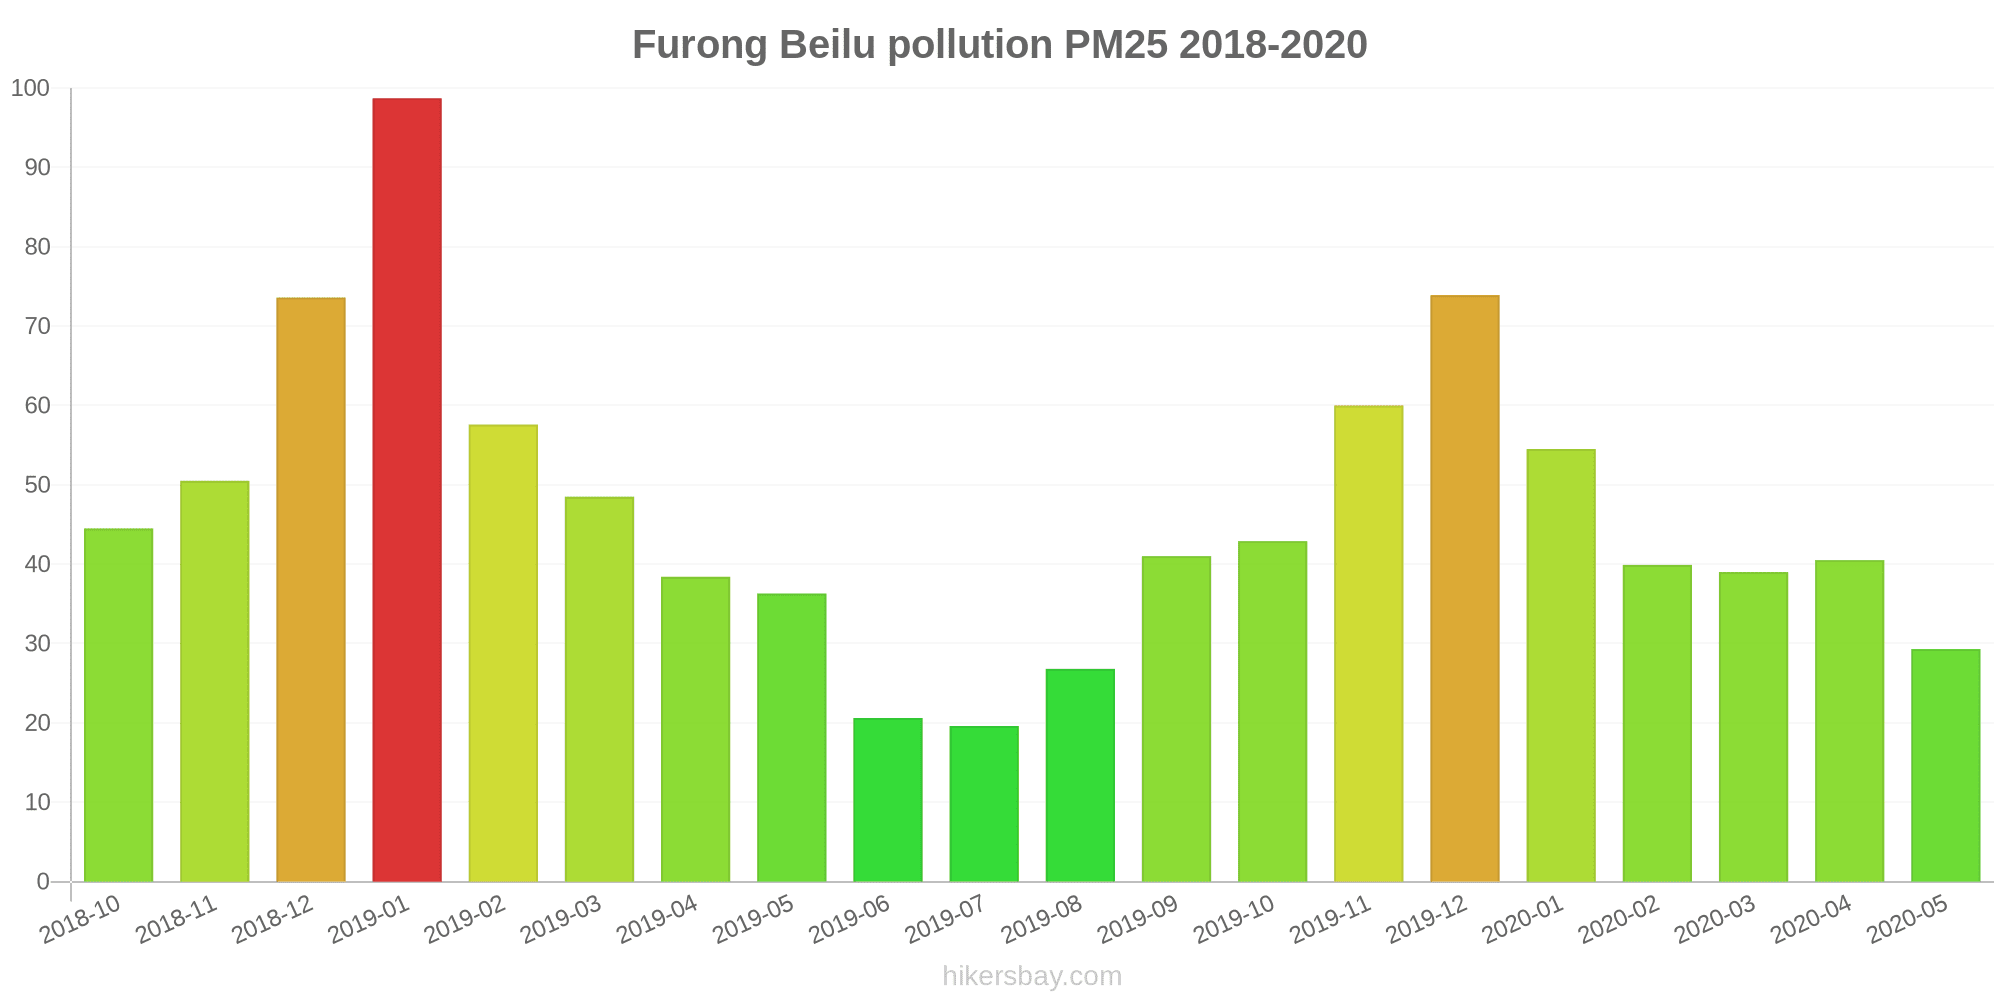
What is the current level of PM2.5 in Furong Beilu? (particulate matter (PM2.5) dust)
Today's PM2.5 level is:
35 (Unhealthy for Sensitive Groups)
For comparison, the highest level of PM2.5 in Furong Beilu in the last 7 days was: 56 (Friday, May 27, 2022) and the lowest: 56 (Friday, May 27, 2022).
The highest PM2.5 values were recorded: 99 (January 2019).
The lowest level of particulate matter PM2.5 pollution occurs in month: July (20).
How is the O3 level today in Furong Beilu? (ozone (O3))
0 (Good)
How high is the level of NO2? (nitrogen dioxide (NO2))
0 (Good)
What is the level of SO2 pollution? (sulfur dioxide (SO2))
0 (Good)
Current data Friday, May 27, 2022, 12:00 PM
PM10 179 (Very bad Hazardous)
PM2,5 35 (Unhealthy for Sensitive Groups)
O3 0 (Good)
NO2 0 (Good)
SO2 0 (Good)
Data on air pollution from recent days in Furong Beilu
index
2022-05-27
pm10
56
Unhealthy for Sensitive Groups
pm25
56
Unhealthy
o3
0
Good
no2
0
Good
so2
0
Good
data source »
Air pollution in Furong Beilu from October 2018 to May 2020

index
2020-05
2020-04
2020-03
2020-02
2020-01
2019-12
2019-11
2019-10
2019-09
2019-08
2019-07
2019-06
2019-05
2019-04
2019-03
2019-02
2019-01
2018-12
2018-11
2018-10
pm25
29 (Moderate)
41 (Unhealthy for Sensitive Groups)
39 (Unhealthy for Sensitive Groups)
40 (Unhealthy for Sensitive Groups)
55 (Unhealthy for Sensitive Groups)
74 (Unhealthy)
60 (Unhealthy)
43 (Unhealthy for Sensitive Groups)
41 (Unhealthy for Sensitive Groups)
27 (Moderate)
20 (Moderate)
21 (Moderate)
36 (Unhealthy for Sensitive Groups)
38 (Unhealthy for Sensitive Groups)
49 (Unhealthy for Sensitive Groups)
58 (Unhealthy)
99 (Very Unhealthy)
74 (Unhealthy)
51 (Unhealthy for Sensitive Groups)
45 (Unhealthy for Sensitive Groups)
co
611 (Good)
690 (Good)
824 (Good)
844 (Good)
1 (Good)
1 (Good)
880 (Good)
904 (Good)
926 (Good)
776 (Good)
710 (Good)
793 (Good)
797 (Good)
947 (Good)
1 (Good)
944 (Good)
1 (Good)
1 (Good)
938 (Good)
908 (Good)
no2
21 (Good)
37 (Good)
28 (Good)
21 (Good)
28 (Good)
47 (Moderate)
42 (Moderate)
38 (Good)
33 (Good)
26 (Good)
21 (Good)
26 (Good)
36 (Good)
34 (Good)
39 (Good)
19 (Good)
33 (Good)
35 (Good)
40 (Good)
48 (Moderate)
o3
118 (Moderate)
137 (Unhealthy for Sensitive Groups)
84 (Moderate)
77 (Moderate)
53 (Good)
65 (Good)
111 (Moderate)
125 (Unhealthy for Sensitive Groups)
185 (Very Unhealthy)
167 (Unhealthy)
136 (Unhealthy for Sensitive Groups)
137 (Unhealthy for Sensitive Groups)
134 (Unhealthy for Sensitive Groups)
112 (Moderate)
96 (Moderate)
56 (Good)
50 (Good)
40 (Good)
76 (Moderate)
104 (Moderate)
pm10
52 (Unhealthy for Sensitive Groups)
67 (Unhealthy for Sensitive Groups)
49 (Moderate)
40 (Moderate)
50 (Moderate)
80 (Unhealthy for Sensitive Groups)
83 (Unhealthy)
68 (Unhealthy for Sensitive Groups)
72 (Unhealthy for Sensitive Groups)
52 (Unhealthy for Sensitive Groups)
37 (Moderate)
37 (Moderate)
68 (Unhealthy for Sensitive Groups)
56 (Unhealthy for Sensitive Groups)
72 (Unhealthy for Sensitive Groups)
74 (Unhealthy for Sensitive Groups)
98 (Unhealthy)
63 (Unhealthy for Sensitive Groups)
60 (Unhealthy for Sensitive Groups)
72 (Unhealthy for Sensitive Groups)
so2
6.8 (Good)
11 (Good)
8.6 (Good)
7.2 (Good)
6.7 (Good)
10 (Good)
11 (Good)
8.7 (Good)
9.2 (Good)
6.9 (Good)
5.7 (Good)
5.3 (Good)
6 (Good)
5.3 (Good)
4.8 (Good)
3.3 (Good)
4 (Good)
6.2 (Good)
8.4 (Good)
9.5 (Good)
data source »
伍家岭
Friday, May 27, 2022, 12:00 PM
PM10 179 (Very bad Hazardous)
particulate matter (PM10) suspended dust
PM2,5 35 (Unhealthy for Sensitive Groups)
particulate matter (PM2.5) dust
O3 0.04 (Good)
ozone (O3)
NO2 0 (Good)
nitrogen dioxide (NO2)
SO2 0 (Good)
sulfur dioxide (SO2)
伍家岭
index
2022-05-27
pm10
56
pm25
56
o3
0.03
no2
0
so2
0
伍家岭
2018-10 2020-05

index
2020-05
2020-04
2020-03
2020-02
2020-01
2019-12
2019-11
2019-10
2019-09
2019-08
2019-07
2019-06
2019-05
2019-04
2019-03
2019-02
2019-01
2018-12
2018-11
2018-10
pm25
29
41
39
40
55
74
60
43
41
27
20
21
36
38
49
58
99
74
51
45
co
611
690
824
844
1
1
880
904
926
776
710
793
797
947
1
944
1
1
938
908
no2
21
37
28
21
28
47
42
38
33
26
21
26
36
34
39
19
33
35
40
48
o3
118
137
84
77
53
65
111
125
185
167
136
137
134
112
96
56
50
40
76
104
pm10
52
67
49
40
50
80
83
68
72
52
37
37
68
56
72
74
98
63
60
72
so2
6.8
11
8.6
7.2
6.7
10
11
8.7
9.2
6.9
5.7
5.3
6
5.3
4.8
3.3
4
6.2
8.4
9.5
* Pollution data source:
https://openaq.org
(ChinaAQIData)
The data is licensed under CC-By 4.0
PM10 179 (Very bad Hazardous)
PM2,5 35 (Unhealthy for Sensitive Groups)
O3 0 (Good)
NO2 0 (Good)
SO2 0 (Good)
Data on air pollution from recent days in Furong Beilu
| index | 2022-05-27 |
|---|---|
| pm10 | 56 Unhealthy for Sensitive Groups |
| pm25 | 56 Unhealthy |
| o3 | 0 Good |
| no2 | 0 Good |
| so2 | 0 Good |
| index | 2020-05 | 2020-04 | 2020-03 | 2020-02 | 2020-01 | 2019-12 | 2019-11 | 2019-10 | 2019-09 | 2019-08 | 2019-07 | 2019-06 | 2019-05 | 2019-04 | 2019-03 | 2019-02 | 2019-01 | 2018-12 | 2018-11 | 2018-10 |
|---|---|---|---|---|---|---|---|---|---|---|---|---|---|---|---|---|---|---|---|---|
| pm25 | 29 (Moderate) | 41 (Unhealthy for Sensitive Groups) | 39 (Unhealthy for Sensitive Groups) | 40 (Unhealthy for Sensitive Groups) | 55 (Unhealthy for Sensitive Groups) | 74 (Unhealthy) | 60 (Unhealthy) | 43 (Unhealthy for Sensitive Groups) | 41 (Unhealthy for Sensitive Groups) | 27 (Moderate) | 20 (Moderate) | 21 (Moderate) | 36 (Unhealthy for Sensitive Groups) | 38 (Unhealthy for Sensitive Groups) | 49 (Unhealthy for Sensitive Groups) | 58 (Unhealthy) | 99 (Very Unhealthy) | 74 (Unhealthy) | 51 (Unhealthy for Sensitive Groups) | 45 (Unhealthy for Sensitive Groups) |
| co | 611 (Good) | 690 (Good) | 824 (Good) | 844 (Good) | 1 (Good) | 1 (Good) | 880 (Good) | 904 (Good) | 926 (Good) | 776 (Good) | 710 (Good) | 793 (Good) | 797 (Good) | 947 (Good) | 1 (Good) | 944 (Good) | 1 (Good) | 1 (Good) | 938 (Good) | 908 (Good) |
| no2 | 21 (Good) | 37 (Good) | 28 (Good) | 21 (Good) | 28 (Good) | 47 (Moderate) | 42 (Moderate) | 38 (Good) | 33 (Good) | 26 (Good) | 21 (Good) | 26 (Good) | 36 (Good) | 34 (Good) | 39 (Good) | 19 (Good) | 33 (Good) | 35 (Good) | 40 (Good) | 48 (Moderate) |
| o3 | 118 (Moderate) | 137 (Unhealthy for Sensitive Groups) | 84 (Moderate) | 77 (Moderate) | 53 (Good) | 65 (Good) | 111 (Moderate) | 125 (Unhealthy for Sensitive Groups) | 185 (Very Unhealthy) | 167 (Unhealthy) | 136 (Unhealthy for Sensitive Groups) | 137 (Unhealthy for Sensitive Groups) | 134 (Unhealthy for Sensitive Groups) | 112 (Moderate) | 96 (Moderate) | 56 (Good) | 50 (Good) | 40 (Good) | 76 (Moderate) | 104 (Moderate) |
| pm10 | 52 (Unhealthy for Sensitive Groups) | 67 (Unhealthy for Sensitive Groups) | 49 (Moderate) | 40 (Moderate) | 50 (Moderate) | 80 (Unhealthy for Sensitive Groups) | 83 (Unhealthy) | 68 (Unhealthy for Sensitive Groups) | 72 (Unhealthy for Sensitive Groups) | 52 (Unhealthy for Sensitive Groups) | 37 (Moderate) | 37 (Moderate) | 68 (Unhealthy for Sensitive Groups) | 56 (Unhealthy for Sensitive Groups) | 72 (Unhealthy for Sensitive Groups) | 74 (Unhealthy for Sensitive Groups) | 98 (Unhealthy) | 63 (Unhealthy for Sensitive Groups) | 60 (Unhealthy for Sensitive Groups) | 72 (Unhealthy for Sensitive Groups) |
| so2 | 6.8 (Good) | 11 (Good) | 8.6 (Good) | 7.2 (Good) | 6.7 (Good) | 10 (Good) | 11 (Good) | 8.7 (Good) | 9.2 (Good) | 6.9 (Good) | 5.7 (Good) | 5.3 (Good) | 6 (Good) | 5.3 (Good) | 4.8 (Good) | 3.3 (Good) | 4 (Good) | 6.2 (Good) | 8.4 (Good) | 9.5 (Good) |
PM10 179 (Very bad Hazardous)
particulate matter (PM10) suspended dustPM2,5 35 (Unhealthy for Sensitive Groups)
particulate matter (PM2.5) dustO3 0.04 (Good)
ozone (O3)NO2 0 (Good)
nitrogen dioxide (NO2)SO2 0 (Good)
sulfur dioxide (SO2)伍家岭
| index | 2022-05-27 |
|---|---|
| pm10 | 56 |
| pm25 | 56 |
| o3 | 0.03 |
| no2 | 0 |
| so2 | 0 |
伍家岭

| index | 2020-05 | 2020-04 | 2020-03 | 2020-02 | 2020-01 | 2019-12 | 2019-11 | 2019-10 | 2019-09 | 2019-08 | 2019-07 | 2019-06 | 2019-05 | 2019-04 | 2019-03 | 2019-02 | 2019-01 | 2018-12 | 2018-11 | 2018-10 |
|---|---|---|---|---|---|---|---|---|---|---|---|---|---|---|---|---|---|---|---|---|
| pm25 | 29 | 41 | 39 | 40 | 55 | 74 | 60 | 43 | 41 | 27 | 20 | 21 | 36 | 38 | 49 | 58 | 99 | 74 | 51 | 45 |
| co | 611 | 690 | 824 | 844 | 1 | 1 | 880 | 904 | 926 | 776 | 710 | 793 | 797 | 947 | 1 | 944 | 1 | 1 | 938 | 908 |
| no2 | 21 | 37 | 28 | 21 | 28 | 47 | 42 | 38 | 33 | 26 | 21 | 26 | 36 | 34 | 39 | 19 | 33 | 35 | 40 | 48 |
| o3 | 118 | 137 | 84 | 77 | 53 | 65 | 111 | 125 | 185 | 167 | 136 | 137 | 134 | 112 | 96 | 56 | 50 | 40 | 76 | 104 |
| pm10 | 52 | 67 | 49 | 40 | 50 | 80 | 83 | 68 | 72 | 52 | 37 | 37 | 68 | 56 | 72 | 74 | 98 | 63 | 60 | 72 |
| so2 | 6.8 | 11 | 8.6 | 7.2 | 6.7 | 10 | 11 | 8.7 | 9.2 | 6.9 | 5.7 | 5.3 | 6 | 5.3 | 4.8 | 3.3 | 4 | 6.2 | 8.4 | 9.5 |