Air Pollution in Bailang: Real-time Air Quality Index and smog alert.
Pollution and air quality forecast for Bailang. Today is Tuesday, June 2, 2026. The following air pollution values have been recorded for Bailang:- particulate matter (PM10) suspended dust - 179 (Very bad Hazardous)
- particulate matter (PM2.5) dust - 35 (Unhealthy for Sensitive Groups)
- ozone (O3) - 0 (Good)
- nitrogen dioxide (NO2) - 0 (Good)
- sulfur dioxide (SO2) - 0 (Good)

What is the air quality in Bailang today? Is the air polluted in Bailang?. Is there smog?
What is the level of PM10 today in Bailang? (particulate matter (PM10) suspended dust)
The current level of particulate matter PM10 in Bailang is:
179 (Very bad Hazardous)
The highest PM10 values usually occur in month: 149 (January 2019).
The lowest value of particulate matter PM10 pollution in Bailang is usually recorded in: July (34).
What is the current level of PM2.5 in Bailang? (particulate matter (PM2.5) dust)
Today's PM2.5 level is:
35 (Unhealthy for Sensitive Groups)
For comparison, the highest level of PM2.5 in Bailang in the last 7 days was: 56 (Friday, May 27, 2022) and the lowest: 56 (Friday, May 27, 2022).
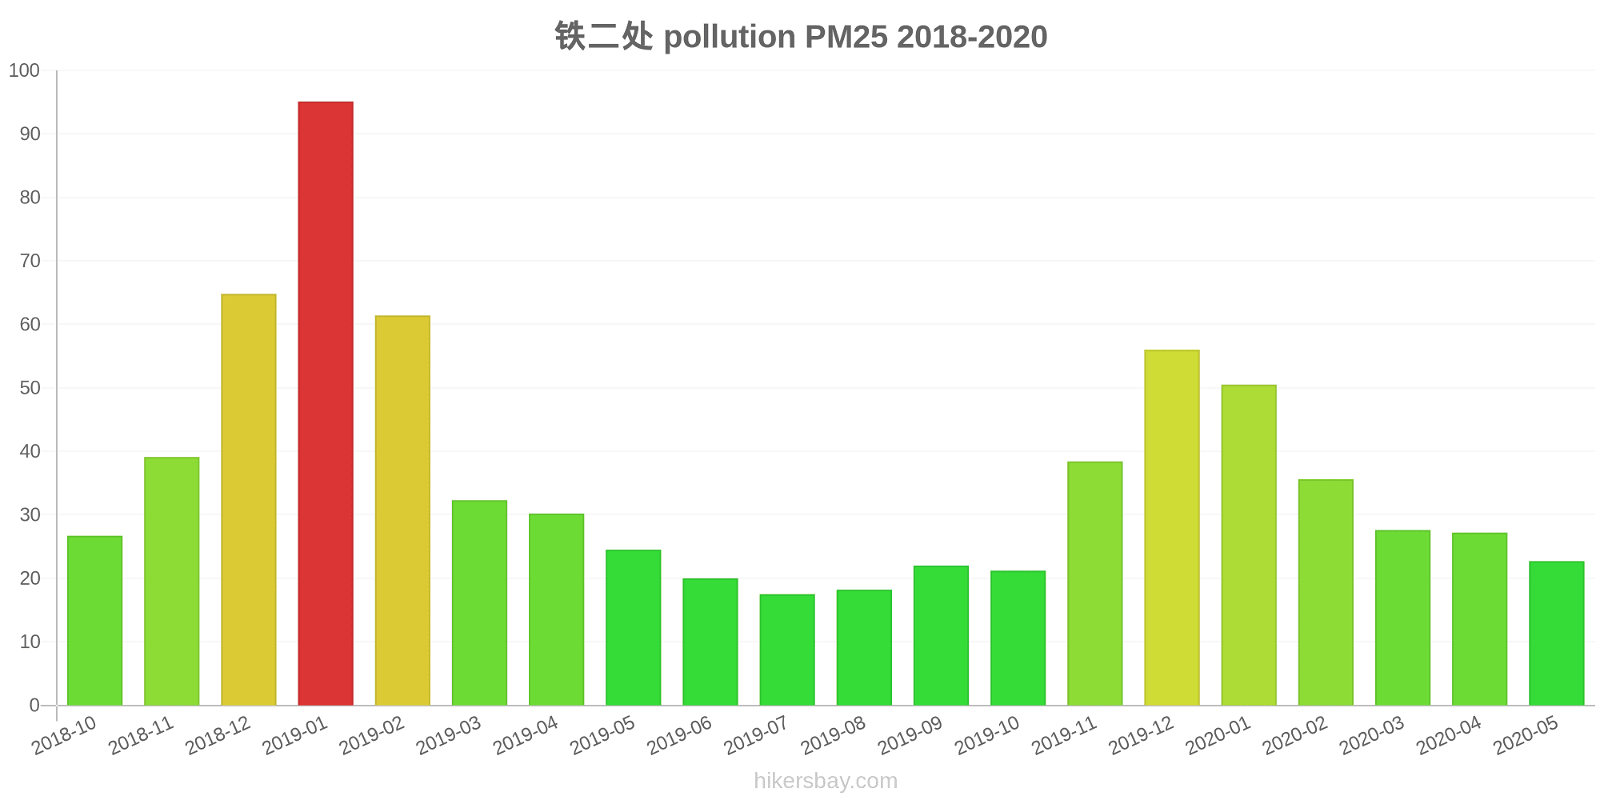
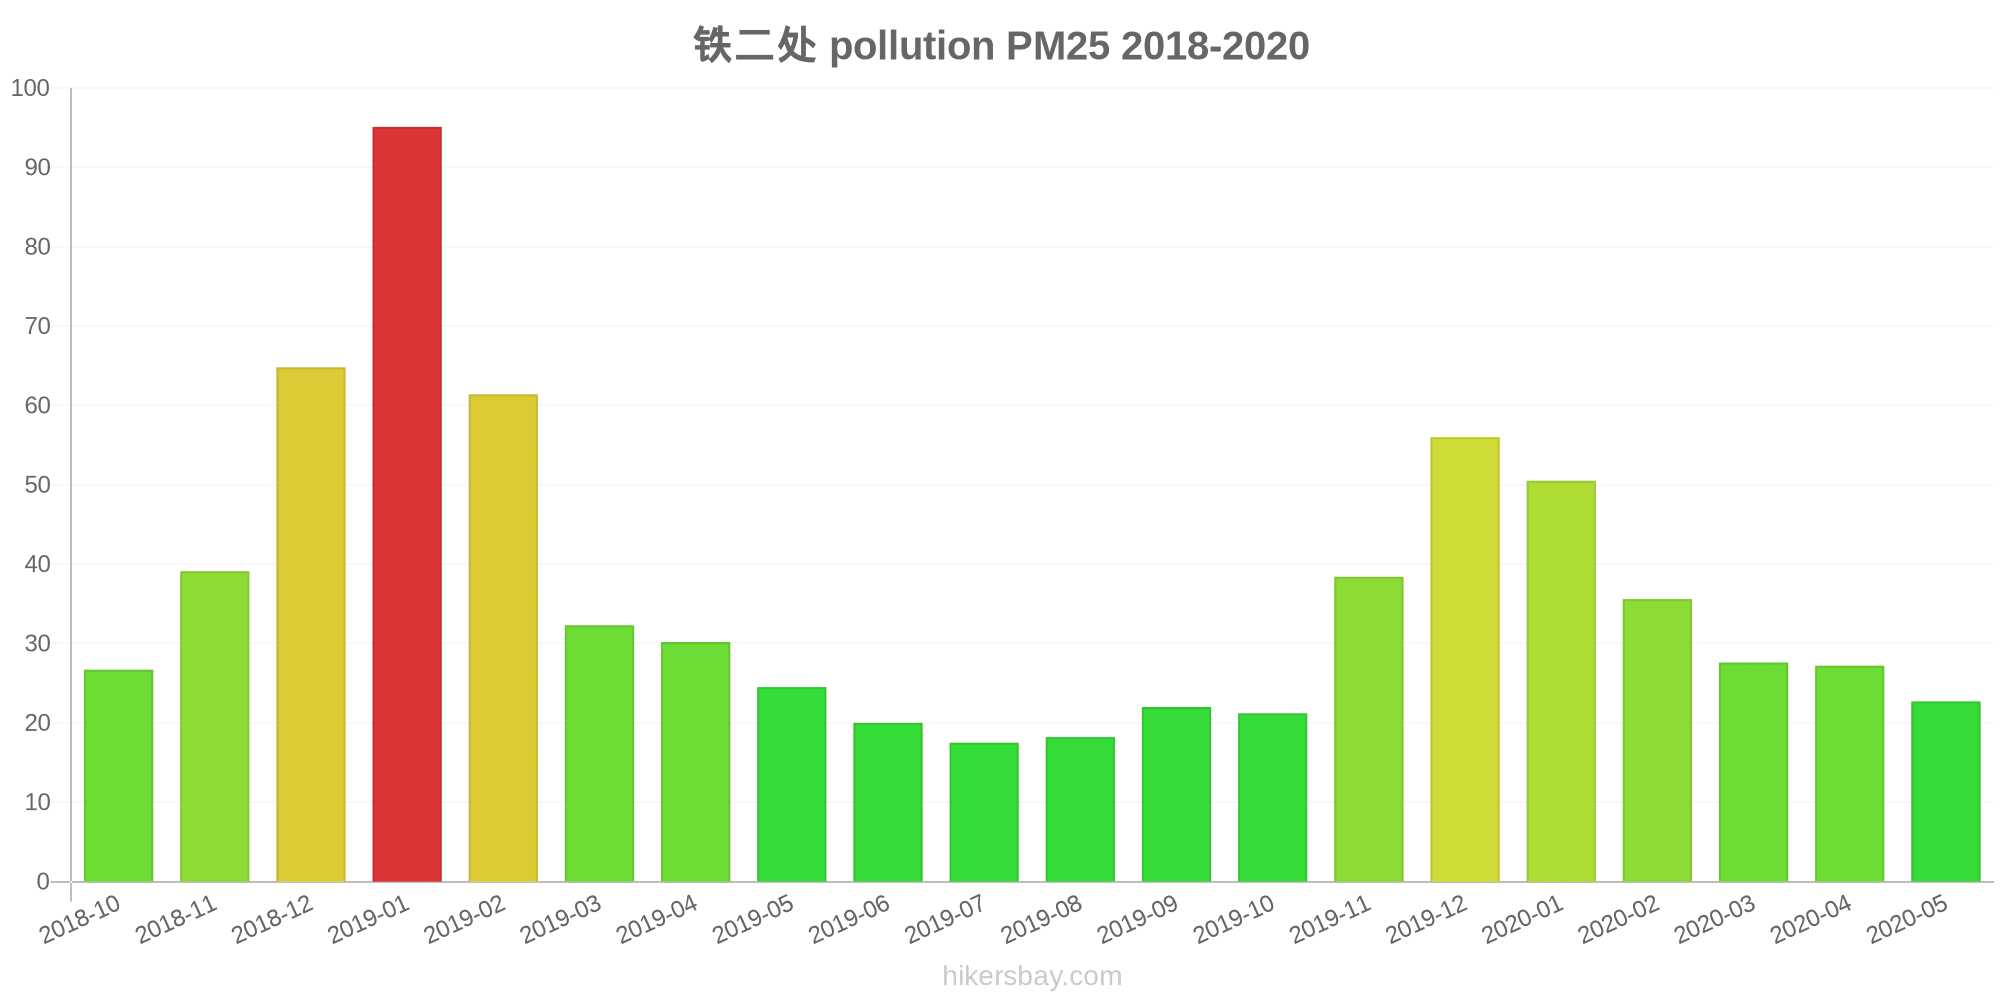
The highest PM2.5 values were recorded: 95 (January 2019).
The lowest level of particulate matter PM2.5 pollution occurs in month: July (18).
How is the O3 level today in Bailang? (ozone (O3))
0 (Good)
How high is the level of NO2? (nitrogen dioxide (NO2))
0 (Good)
What is the level of SO2 pollution? (sulfur dioxide (SO2))
0 (Good)
Current data Friday, May 27, 2022, 12:00 PM
PM10 179 (Very bad Hazardous)
PM2,5 35 (Unhealthy for Sensitive Groups)
O3 0 (Good)
NO2 0 (Good)
SO2 0 (Good)
Data on air pollution from recent days in Bailang
index
2022-05-27
pm10
56
Unhealthy for Sensitive Groups
pm25
56
Unhealthy
o3
0
Good
no2
0
Good
so2
0
Good
data source »
Air pollution in Bailang from October 2018 to May 2020

index
2020-05
2020-04
2020-03
2020-02
2020-01
2019-12
2019-11
2019-10
2019-09
2019-08
2019-07
2019-06
2019-05
2019-04
2019-03
2019-02
2019-01
2018-12
2018-11
2018-10
pm25
23 (Moderate)
27 (Moderate)
28 (Moderate)
36 (Unhealthy for Sensitive Groups)
51 (Unhealthy for Sensitive Groups)
56 (Unhealthy)
38 (Unhealthy for Sensitive Groups)
21 (Moderate)
22 (Moderate)
18 (Moderate)
18 (Moderate)
20 (Moderate)
25 (Moderate)
30 (Moderate)
32 (Moderate)
61 (Unhealthy)
95 (Very Unhealthy)
65 (Unhealthy)
39 (Unhealthy for Sensitive Groups)
27 (Moderate)
co
693 (Good)
503 (Good)
996 (Good)
999 (Good)
1 (Good)
857 (Good)
788 (Good)
733 (Good)
690 (Good)
752 (Good)
724 (Good)
690 (Good)
665 (Good)
791 (Good)
680 (Good)
940 (Good)
1 (Good)
1 (Good)
782 (Good)
702 (Good)
no2
18 (Good)
20 (Good)
14 (Good)
9.4 (Good)
27 (Good)
38 (Good)
29 (Good)
19 (Good)
15 (Good)
12 (Good)
12 (Good)
13 (Good)
20 (Good)
26 (Good)
32 (Good)
28 (Good)
47 (Moderate)
35 (Good)
30 (Good)
27 (Good)
o3
137 (Unhealthy for Sensitive Groups)
126 (Unhealthy for Sensitive Groups)
109 (Moderate)
83 (Moderate)
66 (Good)
58 (Good)
81 (Moderate)
94 (Moderate)
130 (Unhealthy for Sensitive Groups)
133 (Unhealthy for Sensitive Groups)
132 (Unhealthy for Sensitive Groups)
137 (Unhealthy for Sensitive Groups)
112 (Moderate)
105 (Moderate)
93 (Moderate)
70 (Good)
53 (Good)
49 (Good)
76 (Moderate)
98 (Moderate)
pm10
49 (Moderate)
54 (Unhealthy for Sensitive Groups)
61 (Unhealthy for Sensitive Groups)
47 (Moderate)
77 (Unhealthy for Sensitive Groups)
95 (Unhealthy)
80 (Unhealthy for Sensitive Groups)
45 (Moderate)
44 (Moderate)
37 (Moderate)
34 (Moderate)
40 (Moderate)
67 (Unhealthy for Sensitive Groups)
61 (Unhealthy for Sensitive Groups)
71 (Unhealthy for Sensitive Groups)
92 (Unhealthy)
149 (Very Unhealthy)
126 (Very Unhealthy)
82 (Unhealthy)
56 (Unhealthy for Sensitive Groups)
so2
4.3 (Good)
3.4 (Good)
4.2 (Good)
4.5 (Good)
5.6 (Good)
6.8 (Good)
7.3 (Good)
6.2 (Good)
5.6 (Good)
5.5 (Good)
4.7 (Good)
6.7 (Good)
5.5 (Good)
8 (Good)
11 (Good)
11 (Good)
19 (Good)
13 (Good)
9.8 (Good)
12 (Good)
data source »
铁二处
Friday, May 27, 2022, 12:00 PM
PM10 179 (Very bad Hazardous)
particulate matter (PM10) suspended dust
PM2,5 35 (Unhealthy for Sensitive Groups)
particulate matter (PM2.5) dust
O3 0.04 (Good)
ozone (O3)
NO2 0 (Good)
nitrogen dioxide (NO2)
SO2 0 (Good)
sulfur dioxide (SO2)
铁二处
index
2022-05-27
pm10
56
pm25
56
o3
0.03
no2
0
so2
0
铁二处
2018-10 2020-05
index
2020-05
2020-04
2020-03
2020-02
2020-01
2019-12
2019-11
2019-10
2019-09
2019-08
2019-07
2019-06
2019-05
2019-04
2019-03
2019-02
2019-01
2018-12
2018-11
2018-10
pm25
23
27
28
36
51
56
38
21
22
18
18
20
25
30
32
61
95
65
39
27
co
693
503
996
999
1
857
788
733
690
752
724
690
665
791
680
940
1
1
782
702
no2
18
20
14
9.4
27
38
29
19
15
12
12
13
20
26
32
28
47
35
30
27
o3
137
126
109
83
66
58
81
94
130
133
132
137
112
105
93
70
53
49
76
98
pm10
49
54
61
47
77
95
80
45
44
37
34
40
67
61
71
92
149
126
82
56
so2
4.3
3.4
4.2
4.5
5.6
6.8
7.3
6.2
5.6
5.5
4.7
6.7
5.5
8
11
11
19
13
9.8
12
* Pollution data source:
https://openaq.org
(ChinaAQIData)
The data is licensed under CC-By 4.0
PM10 179 (Very bad Hazardous)
PM2,5 35 (Unhealthy for Sensitive Groups)
O3 0 (Good)
NO2 0 (Good)
SO2 0 (Good)
Data on air pollution from recent days in Bailang
| index | 2022-05-27 |
|---|---|
| pm10 | 56 Unhealthy for Sensitive Groups |
| pm25 | 56 Unhealthy |
| o3 | 0 Good |
| no2 | 0 Good |
| so2 | 0 Good |

| index | 2020-05 | 2020-04 | 2020-03 | 2020-02 | 2020-01 | 2019-12 | 2019-11 | 2019-10 | 2019-09 | 2019-08 | 2019-07 | 2019-06 | 2019-05 | 2019-04 | 2019-03 | 2019-02 | 2019-01 | 2018-12 | 2018-11 | 2018-10 |
|---|---|---|---|---|---|---|---|---|---|---|---|---|---|---|---|---|---|---|---|---|
| pm25 | 23 (Moderate) | 27 (Moderate) | 28 (Moderate) | 36 (Unhealthy for Sensitive Groups) | 51 (Unhealthy for Sensitive Groups) | 56 (Unhealthy) | 38 (Unhealthy for Sensitive Groups) | 21 (Moderate) | 22 (Moderate) | 18 (Moderate) | 18 (Moderate) | 20 (Moderate) | 25 (Moderate) | 30 (Moderate) | 32 (Moderate) | 61 (Unhealthy) | 95 (Very Unhealthy) | 65 (Unhealthy) | 39 (Unhealthy for Sensitive Groups) | 27 (Moderate) |
| co | 693 (Good) | 503 (Good) | 996 (Good) | 999 (Good) | 1 (Good) | 857 (Good) | 788 (Good) | 733 (Good) | 690 (Good) | 752 (Good) | 724 (Good) | 690 (Good) | 665 (Good) | 791 (Good) | 680 (Good) | 940 (Good) | 1 (Good) | 1 (Good) | 782 (Good) | 702 (Good) |
| no2 | 18 (Good) | 20 (Good) | 14 (Good) | 9.4 (Good) | 27 (Good) | 38 (Good) | 29 (Good) | 19 (Good) | 15 (Good) | 12 (Good) | 12 (Good) | 13 (Good) | 20 (Good) | 26 (Good) | 32 (Good) | 28 (Good) | 47 (Moderate) | 35 (Good) | 30 (Good) | 27 (Good) |
| o3 | 137 (Unhealthy for Sensitive Groups) | 126 (Unhealthy for Sensitive Groups) | 109 (Moderate) | 83 (Moderate) | 66 (Good) | 58 (Good) | 81 (Moderate) | 94 (Moderate) | 130 (Unhealthy for Sensitive Groups) | 133 (Unhealthy for Sensitive Groups) | 132 (Unhealthy for Sensitive Groups) | 137 (Unhealthy for Sensitive Groups) | 112 (Moderate) | 105 (Moderate) | 93 (Moderate) | 70 (Good) | 53 (Good) | 49 (Good) | 76 (Moderate) | 98 (Moderate) |
| pm10 | 49 (Moderate) | 54 (Unhealthy for Sensitive Groups) | 61 (Unhealthy for Sensitive Groups) | 47 (Moderate) | 77 (Unhealthy for Sensitive Groups) | 95 (Unhealthy) | 80 (Unhealthy for Sensitive Groups) | 45 (Moderate) | 44 (Moderate) | 37 (Moderate) | 34 (Moderate) | 40 (Moderate) | 67 (Unhealthy for Sensitive Groups) | 61 (Unhealthy for Sensitive Groups) | 71 (Unhealthy for Sensitive Groups) | 92 (Unhealthy) | 149 (Very Unhealthy) | 126 (Very Unhealthy) | 82 (Unhealthy) | 56 (Unhealthy for Sensitive Groups) |
| so2 | 4.3 (Good) | 3.4 (Good) | 4.2 (Good) | 4.5 (Good) | 5.6 (Good) | 6.8 (Good) | 7.3 (Good) | 6.2 (Good) | 5.6 (Good) | 5.5 (Good) | 4.7 (Good) | 6.7 (Good) | 5.5 (Good) | 8 (Good) | 11 (Good) | 11 (Good) | 19 (Good) | 13 (Good) | 9.8 (Good) | 12 (Good) |
PM10 179 (Very bad Hazardous)
particulate matter (PM10) suspended dustPM2,5 35 (Unhealthy for Sensitive Groups)
particulate matter (PM2.5) dustO3 0.04 (Good)
ozone (O3)NO2 0 (Good)
nitrogen dioxide (NO2)SO2 0 (Good)
sulfur dioxide (SO2)铁二处
| index | 2022-05-27 |
|---|---|
| pm10 | 56 |
| pm25 | 56 |
| o3 | 0.03 |
| no2 | 0 |
| so2 | 0 |
铁二处
| index | 2020-05 | 2020-04 | 2020-03 | 2020-02 | 2020-01 | 2019-12 | 2019-11 | 2019-10 | 2019-09 | 2019-08 | 2019-07 | 2019-06 | 2019-05 | 2019-04 | 2019-03 | 2019-02 | 2019-01 | 2018-12 | 2018-11 | 2018-10 |
|---|---|---|---|---|---|---|---|---|---|---|---|---|---|---|---|---|---|---|---|---|
| pm25 | 23 | 27 | 28 | 36 | 51 | 56 | 38 | 21 | 22 | 18 | 18 | 20 | 25 | 30 | 32 | 61 | 95 | 65 | 39 | 27 |
| co | 693 | 503 | 996 | 999 | 1 | 857 | 788 | 733 | 690 | 752 | 724 | 690 | 665 | 791 | 680 | 940 | 1 | 1 | 782 | 702 |
| no2 | 18 | 20 | 14 | 9.4 | 27 | 38 | 29 | 19 | 15 | 12 | 12 | 13 | 20 | 26 | 32 | 28 | 47 | 35 | 30 | 27 |
| o3 | 137 | 126 | 109 | 83 | 66 | 58 | 81 | 94 | 130 | 133 | 132 | 137 | 112 | 105 | 93 | 70 | 53 | 49 | 76 | 98 |
| pm10 | 49 | 54 | 61 | 47 | 77 | 95 | 80 | 45 | 44 | 37 | 34 | 40 | 67 | 61 | 71 | 92 | 149 | 126 | 82 | 56 |
| so2 | 4.3 | 3.4 | 4.2 | 4.5 | 5.6 | 6.8 | 7.3 | 6.2 | 5.6 | 5.5 | 4.7 | 6.7 | 5.5 | 8 | 11 | 11 | 19 | 13 | 9.8 | 12 |