Air Pollution in Yaowan: Real-time Air Quality Index and smog alert.
Pollution and air quality forecast for Yaowan. Today is Tuesday, June 2, 2026. The following air pollution values have been recorded for Yaowan:- particulate matter (PM10) suspended dust - 179 (Very bad Hazardous)
- particulate matter (PM2.5) dust - 35 (Unhealthy for Sensitive Groups)
- ozone (O3) - 0 (Good)
- nitrogen dioxide (NO2) - 0 (Good)
- sulfur dioxide (SO2) - 0 (Good)

What is the air quality in Yaowan today? Is the air polluted in Yaowan?. Is there smog?
What is the level of PM10 today in Yaowan? (particulate matter (PM10) suspended dust)
The current level of particulate matter PM10 in Yaowan is:
179 (Very bad Hazardous)
The highest PM10 values usually occur in month: 187 (January 2019).
The lowest value of particulate matter PM10 pollution in Yaowan is usually recorded in: August (41).
What is the current level of PM2.5 in Yaowan? (particulate matter (PM2.5) dust)
Today's PM2.5 level is:
35 (Unhealthy for Sensitive Groups)
For comparison, the highest level of PM2.5 in Yaowan in the last 7 days was: 56 (Friday, May 27, 2022) and the lowest: 56 (Friday, May 27, 2022).
The highest PM2.5 values were recorded: 151 (January 2019).
The lowest level of particulate matter PM2.5 pollution occurs in month: July (18).
How is the O3 level today in Yaowan? (ozone (O3))
0 (Good)
How high is the level of NO2? (nitrogen dioxide (NO2))
0 (Good)
What is the level of SO2 pollution? (sulfur dioxide (SO2))
0 (Good)
Current data Friday, May 27, 2022, 12:00 PM
PM10 179 (Very bad Hazardous)
PM2,5 35 (Unhealthy for Sensitive Groups)
O3 0 (Good)
NO2 0 (Good)
SO2 0 (Good)
Data on air pollution from recent days in Yaowan
index
2022-05-27
pm10
56
Unhealthy for Sensitive Groups
pm25
56
Unhealthy
o3
0
Good
no2
0
Good
so2
0
Good
data source »
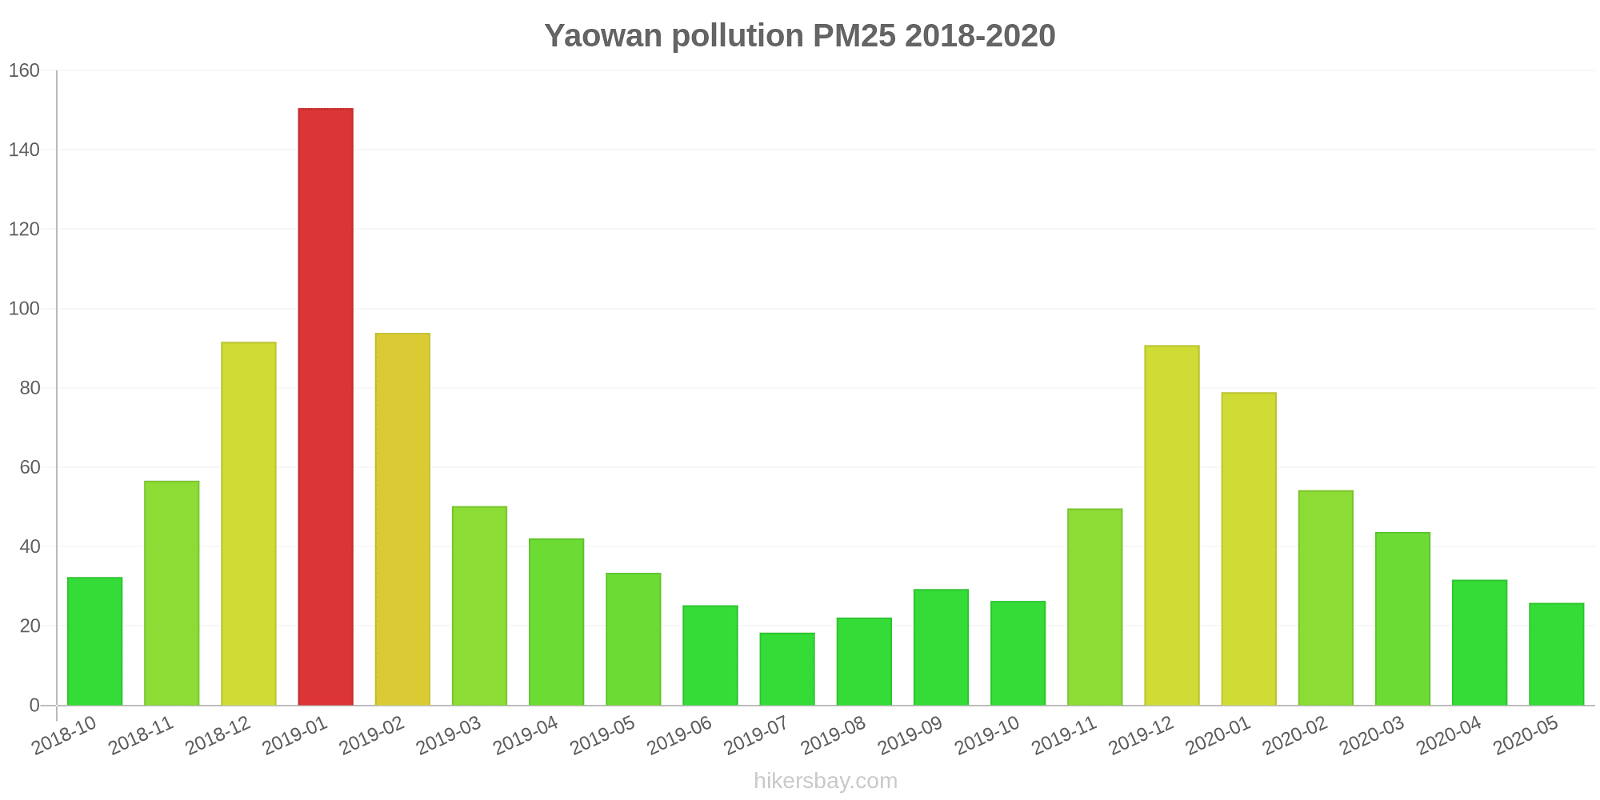
Air pollution in Yaowan from October 2018 to May 2020
index
2020-05
2020-04
2020-03
2020-02
2020-01
2019-12
2019-11
2019-10
2019-09
2019-08
2019-07
2019-06
2019-05
2019-04
2019-03
2019-02
2019-01
2018-12
2018-11
2018-10
pm25
26 (Moderate)
32 (Moderate)
44 (Unhealthy for Sensitive Groups)
54 (Unhealthy for Sensitive Groups)
79 (Very Unhealthy)
91 (Very Unhealthy)
50 (Unhealthy for Sensitive Groups)
26 (Moderate)
29 (Moderate)
22 (Moderate)
18 (Moderate)
25 (Moderate)
33 (Moderate)
42 (Unhealthy for Sensitive Groups)
50 (Unhealthy for Sensitive Groups)
94 (Very Unhealthy)
151 (Very bad Hazardous)
92 (Very Unhealthy)
57 (Unhealthy)
32 (Moderate)
co
731 (Good)
693 (Good)
873 (Good)
841 (Good)
1 (Good)
1 (Good)
711 (Good)
683 (Good)
667 (Good)
682 (Good)
574 (Good)
693 (Good)
638 (Good)
729 (Good)
889 (Good)
1 (Good)
1 (Good)
1 (Good)
1 (Good)
846 (Good)
no2
22 (Good)
23 (Good)
17 (Good)
12 (Good)
29 (Good)
42 (Moderate)
37 (Good)
26 (Good)
24 (Good)
19 (Good)
20 (Good)
25 (Good)
27 (Good)
28 (Good)
34 (Good)
29 (Good)
45 (Moderate)
42 (Moderate)
41 (Moderate)
37 (Good)
o3
125 (Unhealthy for Sensitive Groups)
127 (Unhealthy for Sensitive Groups)
105 (Moderate)
92 (Moderate)
62 (Good)
62 (Good)
85 (Moderate)
101 (Moderate)
163 (Unhealthy)
161 (Unhealthy)
151 (Unhealthy)
147 (Unhealthy for Sensitive Groups)
128 (Unhealthy for Sensitive Groups)
111 (Moderate)
99 (Moderate)
64 (Good)
47 (Good)
41 (Good)
67 (Good)
97 (Moderate)
pm10
48 (Moderate)
55 (Unhealthy for Sensitive Groups)
70 (Unhealthy for Sensitive Groups)
64 (Unhealthy for Sensitive Groups)
95 (Unhealthy)
122 (Very Unhealthy)
84 (Unhealthy)
45 (Moderate)
50 (Unhealthy for Sensitive Groups)
41 (Moderate)
50 (Unhealthy for Sensitive Groups)
50 (Unhealthy for Sensitive Groups)
72 (Unhealthy for Sensitive Groups)
65 (Unhealthy for Sensitive Groups)
79 (Unhealthy for Sensitive Groups)
115 (Very Unhealthy)
187 (Very bad Hazardous)
133 (Very Unhealthy)
85 (Unhealthy)
61 (Unhealthy for Sensitive Groups)
so2
6.7 (Good)
6.8 (Good)
8.7 (Good)
7.9 (Good)
7.2 (Good)
10 (Good)
7.7 (Good)
5.7 (Good)
5.5 (Good)
3.9 (Good)
4.4 (Good)
5 (Good)
6.8 (Good)
7.9 (Good)
8.9 (Good)
7.5 (Good)
9.8 (Good)
14 (Good)
12 (Good)
11 (Good)
data source »
四零三
Friday, May 27, 2022, 12:00 PM
PM10 179 (Very bad Hazardous)
particulate matter (PM10) suspended dust
PM2,5 35 (Unhealthy for Sensitive Groups)
particulate matter (PM2.5) dust
O3 0.04 (Good)
ozone (O3)
NO2 0 (Good)
nitrogen dioxide (NO2)
SO2 0 (Good)
sulfur dioxide (SO2)
白龙岗
Friday, May 27, 2022, 12:00 PM
PM10 179 (Very bad Hazardous)
particulate matter (PM10) suspended dust
PM2,5 35 (Unhealthy for Sensitive Groups)
particulate matter (PM2.5) dust
O3 0.04 (Good)
ozone (O3)
NO2 0 (Good)
nitrogen dioxide (NO2)
SO2 0 (Good)
sulfur dioxide (SO2)
四零三
index
2022-05-27
pm10
56
pm25
56
o3
0.03
no2
0
so2
0
白龙岗
index
2022-05-27
pm10
56
pm25
56
o3
0.03
no2
0
so2
0
四零三
2018-10 2020-05
index
2020-05
2020-04
2020-03
2020-02
2020-01
2019-12
2019-11
2019-10
2019-09
2019-08
2019-07
2019-06
2019-05
2019-04
2019-03
2019-02
2019-01
2018-12
2018-11
2018-10
pm25
26
31
40
51
77
89
49
27
30
24
19
25
35
44
52
92
145
93
59
34
co
764
731
913
817
1
1
622
646
691
696
603
690
619
668
837
1
1
1
1
840
no2
20
22
16
11
28
40
35
23
21
16
17
21
22
23
28
25
41
43
40
35
o3
127
128
104
88
63
63
88
105
167
157
151
156
138
116
104
68
51
42
67
96
pm10
51
56
66
59
93
123
84
47
56
46
53
49
73
66
81
116
188
136
88
63
so2
9.1
7
9.7
9.2
7.7
13
7.4
5.3
5.5
5.3
5.8
6.5
7.5
7
7.9
6.6
8.8
13
11
11
白龙岗
2018-10 2020-05
index
2020-05
2020-04
2020-03
2020-02
2020-01
2019-12
2019-11
2019-10
2019-09
2019-08
2019-07
2019-06
2019-05
2019-04
2019-03
2019-02
2019-01
2018-12
2018-11
2018-10
pm25
25
32
47
58
81
92
50
26
28
21
17
25
32
40
49
96
156
90
55
31
co
698
655
833
864
1
1
799
719
642
667
545
695
656
789
940
1
1
1
1
851
no2
24
25
19
12
30
45
40
30
27
23
23
29
33
33
40
32
49
42
41
38
o3
122
125
106
96
61
61
81
98
158
165
151
137
118
105
93
60
44
40
68
97
pm10
46
54
74
68
97
120
83
43
45
36
48
51
71
63
77
114
185
129
82
60
so2
4.2
6.7
7.7
6.6
6.6
7.9
8
6.1
5.5
2.5
3
3.4
6
8.8
9.9
8.5
11
14
13
11
* Pollution data source:
https://openaq.org
(ChinaAQIData)
The data is licensed under CC-By 4.0
PM10 179 (Very bad Hazardous)
PM2,5 35 (Unhealthy for Sensitive Groups)
O3 0 (Good)
NO2 0 (Good)
SO2 0 (Good)
Data on air pollution from recent days in Yaowan
| index | 2022-05-27 |
|---|---|
| pm10 | 56 Unhealthy for Sensitive Groups |
| pm25 | 56 Unhealthy |
| o3 | 0 Good |
| no2 | 0 Good |
| so2 | 0 Good |

| index | 2020-05 | 2020-04 | 2020-03 | 2020-02 | 2020-01 | 2019-12 | 2019-11 | 2019-10 | 2019-09 | 2019-08 | 2019-07 | 2019-06 | 2019-05 | 2019-04 | 2019-03 | 2019-02 | 2019-01 | 2018-12 | 2018-11 | 2018-10 |
|---|---|---|---|---|---|---|---|---|---|---|---|---|---|---|---|---|---|---|---|---|
| pm25 | 26 (Moderate) | 32 (Moderate) | 44 (Unhealthy for Sensitive Groups) | 54 (Unhealthy for Sensitive Groups) | 79 (Very Unhealthy) | 91 (Very Unhealthy) | 50 (Unhealthy for Sensitive Groups) | 26 (Moderate) | 29 (Moderate) | 22 (Moderate) | 18 (Moderate) | 25 (Moderate) | 33 (Moderate) | 42 (Unhealthy for Sensitive Groups) | 50 (Unhealthy for Sensitive Groups) | 94 (Very Unhealthy) | 151 (Very bad Hazardous) | 92 (Very Unhealthy) | 57 (Unhealthy) | 32 (Moderate) |
| co | 731 (Good) | 693 (Good) | 873 (Good) | 841 (Good) | 1 (Good) | 1 (Good) | 711 (Good) | 683 (Good) | 667 (Good) | 682 (Good) | 574 (Good) | 693 (Good) | 638 (Good) | 729 (Good) | 889 (Good) | 1 (Good) | 1 (Good) | 1 (Good) | 1 (Good) | 846 (Good) |
| no2 | 22 (Good) | 23 (Good) | 17 (Good) | 12 (Good) | 29 (Good) | 42 (Moderate) | 37 (Good) | 26 (Good) | 24 (Good) | 19 (Good) | 20 (Good) | 25 (Good) | 27 (Good) | 28 (Good) | 34 (Good) | 29 (Good) | 45 (Moderate) | 42 (Moderate) | 41 (Moderate) | 37 (Good) |
| o3 | 125 (Unhealthy for Sensitive Groups) | 127 (Unhealthy for Sensitive Groups) | 105 (Moderate) | 92 (Moderate) | 62 (Good) | 62 (Good) | 85 (Moderate) | 101 (Moderate) | 163 (Unhealthy) | 161 (Unhealthy) | 151 (Unhealthy) | 147 (Unhealthy for Sensitive Groups) | 128 (Unhealthy for Sensitive Groups) | 111 (Moderate) | 99 (Moderate) | 64 (Good) | 47 (Good) | 41 (Good) | 67 (Good) | 97 (Moderate) |
| pm10 | 48 (Moderate) | 55 (Unhealthy for Sensitive Groups) | 70 (Unhealthy for Sensitive Groups) | 64 (Unhealthy for Sensitive Groups) | 95 (Unhealthy) | 122 (Very Unhealthy) | 84 (Unhealthy) | 45 (Moderate) | 50 (Unhealthy for Sensitive Groups) | 41 (Moderate) | 50 (Unhealthy for Sensitive Groups) | 50 (Unhealthy for Sensitive Groups) | 72 (Unhealthy for Sensitive Groups) | 65 (Unhealthy for Sensitive Groups) | 79 (Unhealthy for Sensitive Groups) | 115 (Very Unhealthy) | 187 (Very bad Hazardous) | 133 (Very Unhealthy) | 85 (Unhealthy) | 61 (Unhealthy for Sensitive Groups) |
| so2 | 6.7 (Good) | 6.8 (Good) | 8.7 (Good) | 7.9 (Good) | 7.2 (Good) | 10 (Good) | 7.7 (Good) | 5.7 (Good) | 5.5 (Good) | 3.9 (Good) | 4.4 (Good) | 5 (Good) | 6.8 (Good) | 7.9 (Good) | 8.9 (Good) | 7.5 (Good) | 9.8 (Good) | 14 (Good) | 12 (Good) | 11 (Good) |
PM10 179 (Very bad Hazardous)
particulate matter (PM10) suspended dustPM2,5 35 (Unhealthy for Sensitive Groups)
particulate matter (PM2.5) dustO3 0.04 (Good)
ozone (O3)NO2 0 (Good)
nitrogen dioxide (NO2)SO2 0 (Good)
sulfur dioxide (SO2)PM10 179 (Very bad Hazardous)
particulate matter (PM10) suspended dustPM2,5 35 (Unhealthy for Sensitive Groups)
particulate matter (PM2.5) dustO3 0.04 (Good)
ozone (O3)NO2 0 (Good)
nitrogen dioxide (NO2)SO2 0 (Good)
sulfur dioxide (SO2)四零三
| index | 2022-05-27 |
|---|---|
| pm10 | 56 |
| pm25 | 56 |
| o3 | 0.03 |
| no2 | 0 |
| so2 | 0 |
白龙岗
| index | 2022-05-27 |
|---|---|
| pm10 | 56 |
| pm25 | 56 |
| o3 | 0.03 |
| no2 | 0 |
| so2 | 0 |
四零三
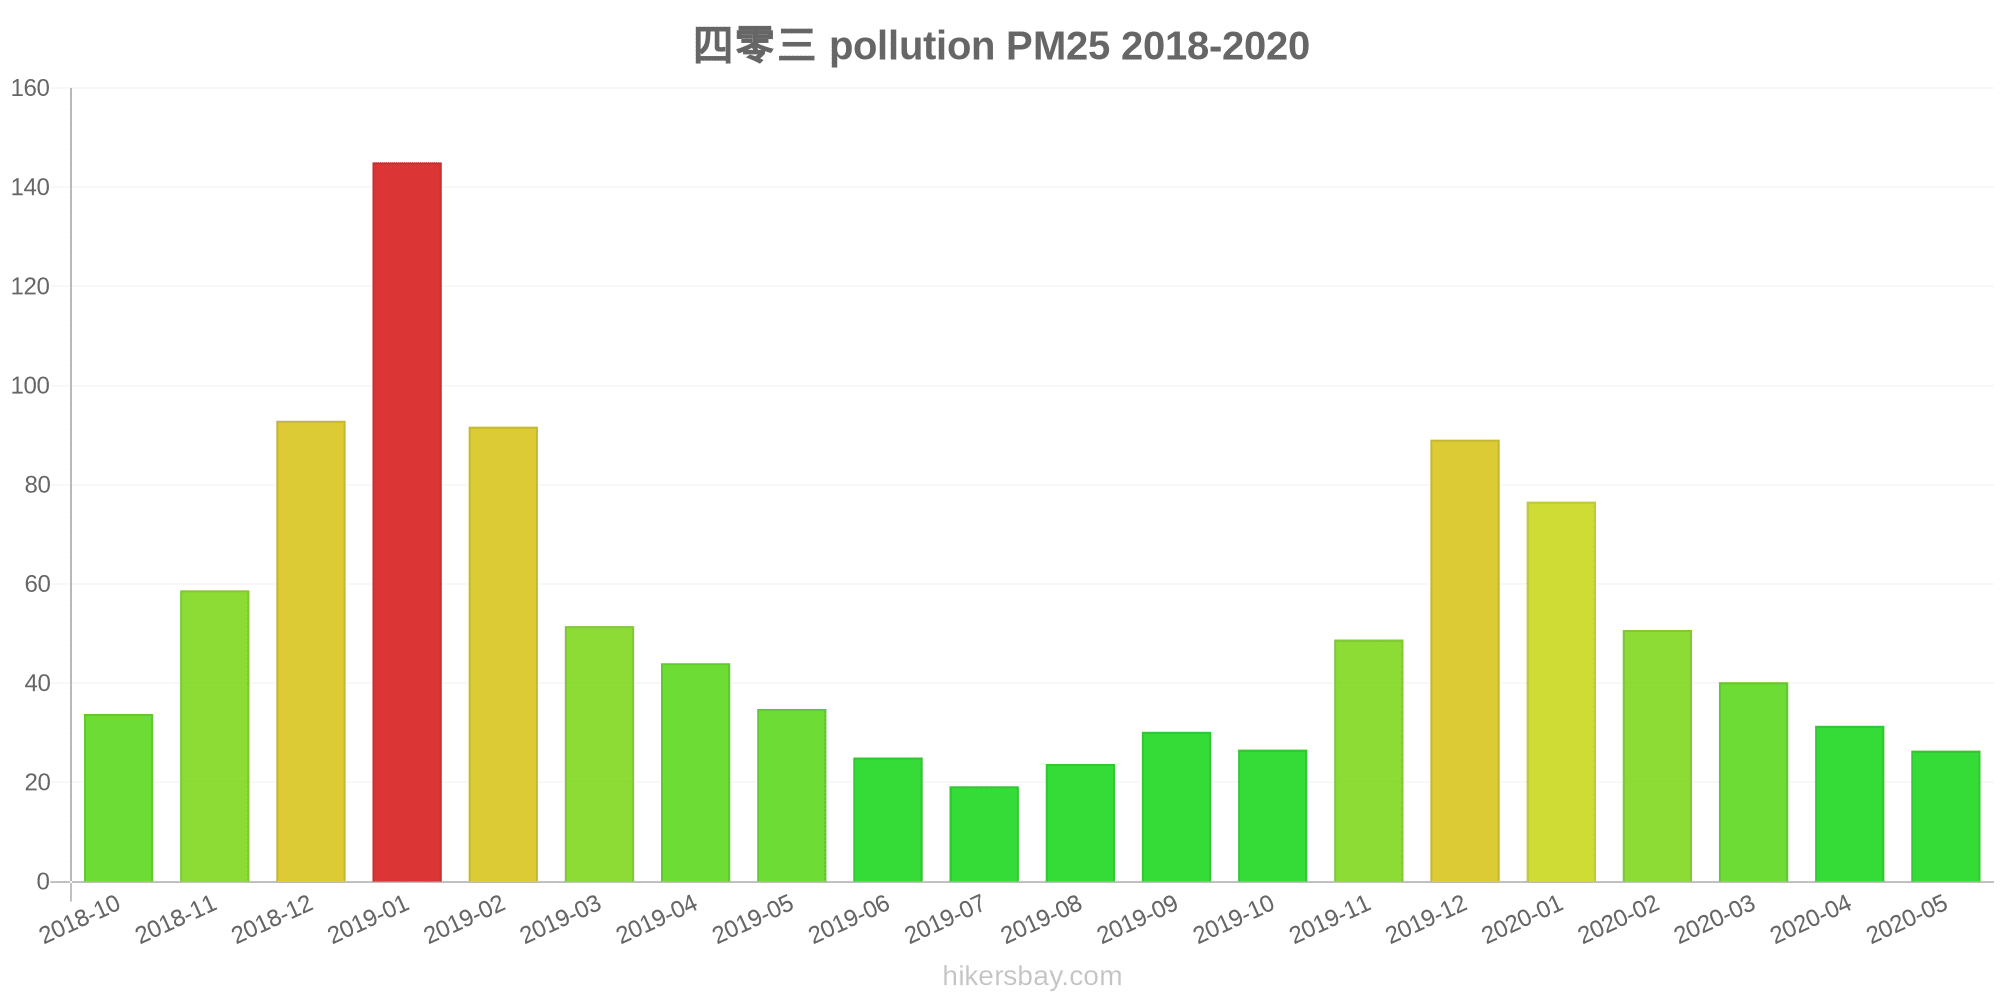
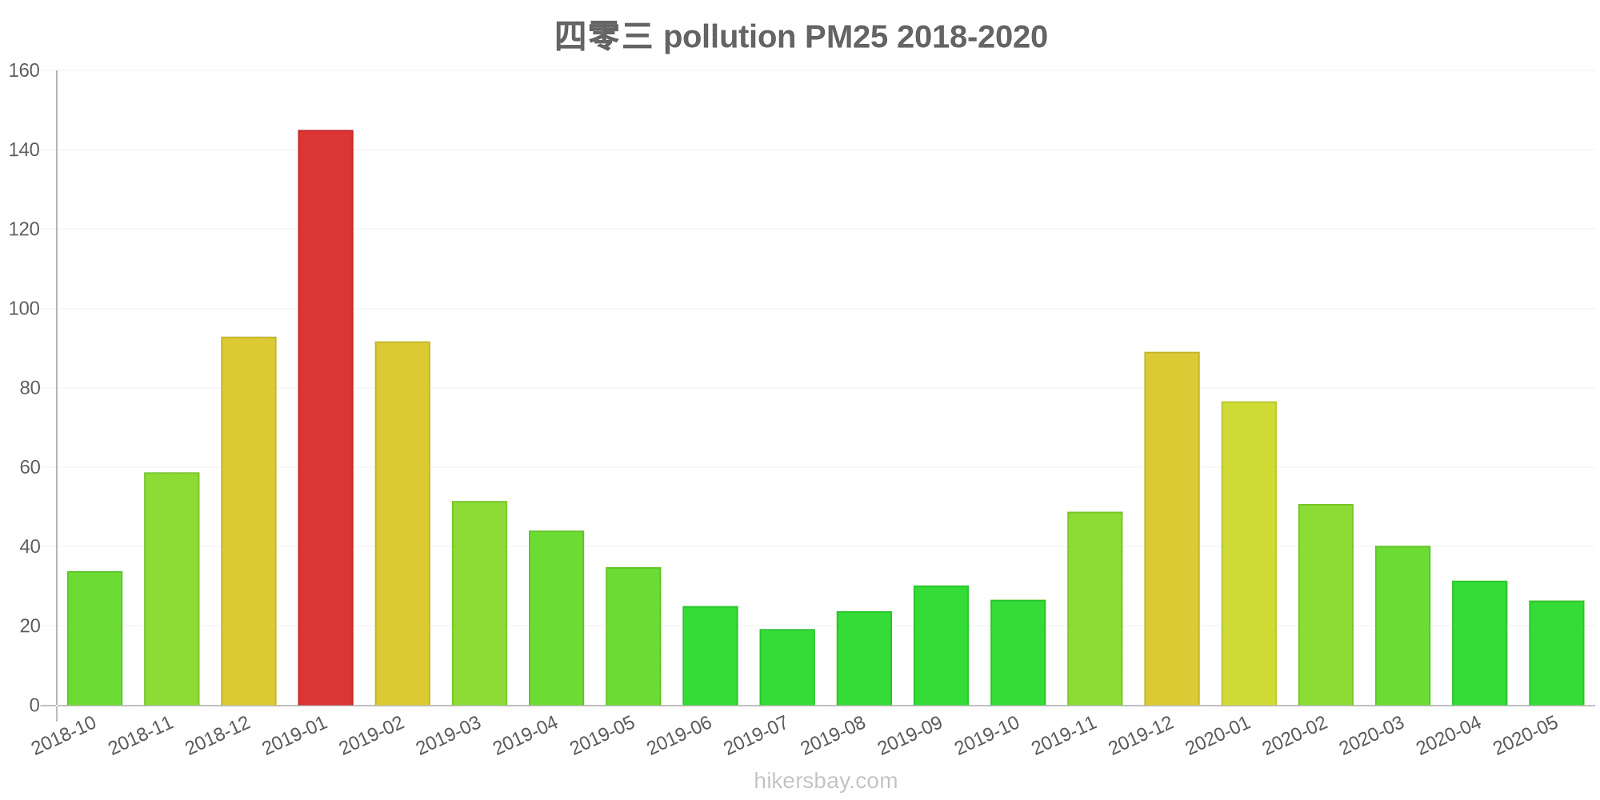
| index | 2020-05 | 2020-04 | 2020-03 | 2020-02 | 2020-01 | 2019-12 | 2019-11 | 2019-10 | 2019-09 | 2019-08 | 2019-07 | 2019-06 | 2019-05 | 2019-04 | 2019-03 | 2019-02 | 2019-01 | 2018-12 | 2018-11 | 2018-10 |
|---|---|---|---|---|---|---|---|---|---|---|---|---|---|---|---|---|---|---|---|---|
| pm25 | 26 | 31 | 40 | 51 | 77 | 89 | 49 | 27 | 30 | 24 | 19 | 25 | 35 | 44 | 52 | 92 | 145 | 93 | 59 | 34 |
| co | 764 | 731 | 913 | 817 | 1 | 1 | 622 | 646 | 691 | 696 | 603 | 690 | 619 | 668 | 837 | 1 | 1 | 1 | 1 | 840 |
| no2 | 20 | 22 | 16 | 11 | 28 | 40 | 35 | 23 | 21 | 16 | 17 | 21 | 22 | 23 | 28 | 25 | 41 | 43 | 40 | 35 |
| o3 | 127 | 128 | 104 | 88 | 63 | 63 | 88 | 105 | 167 | 157 | 151 | 156 | 138 | 116 | 104 | 68 | 51 | 42 | 67 | 96 |
| pm10 | 51 | 56 | 66 | 59 | 93 | 123 | 84 | 47 | 56 | 46 | 53 | 49 | 73 | 66 | 81 | 116 | 188 | 136 | 88 | 63 |
| so2 | 9.1 | 7 | 9.7 | 9.2 | 7.7 | 13 | 7.4 | 5.3 | 5.5 | 5.3 | 5.8 | 6.5 | 7.5 | 7 | 7.9 | 6.6 | 8.8 | 13 | 11 | 11 |
白龙岗

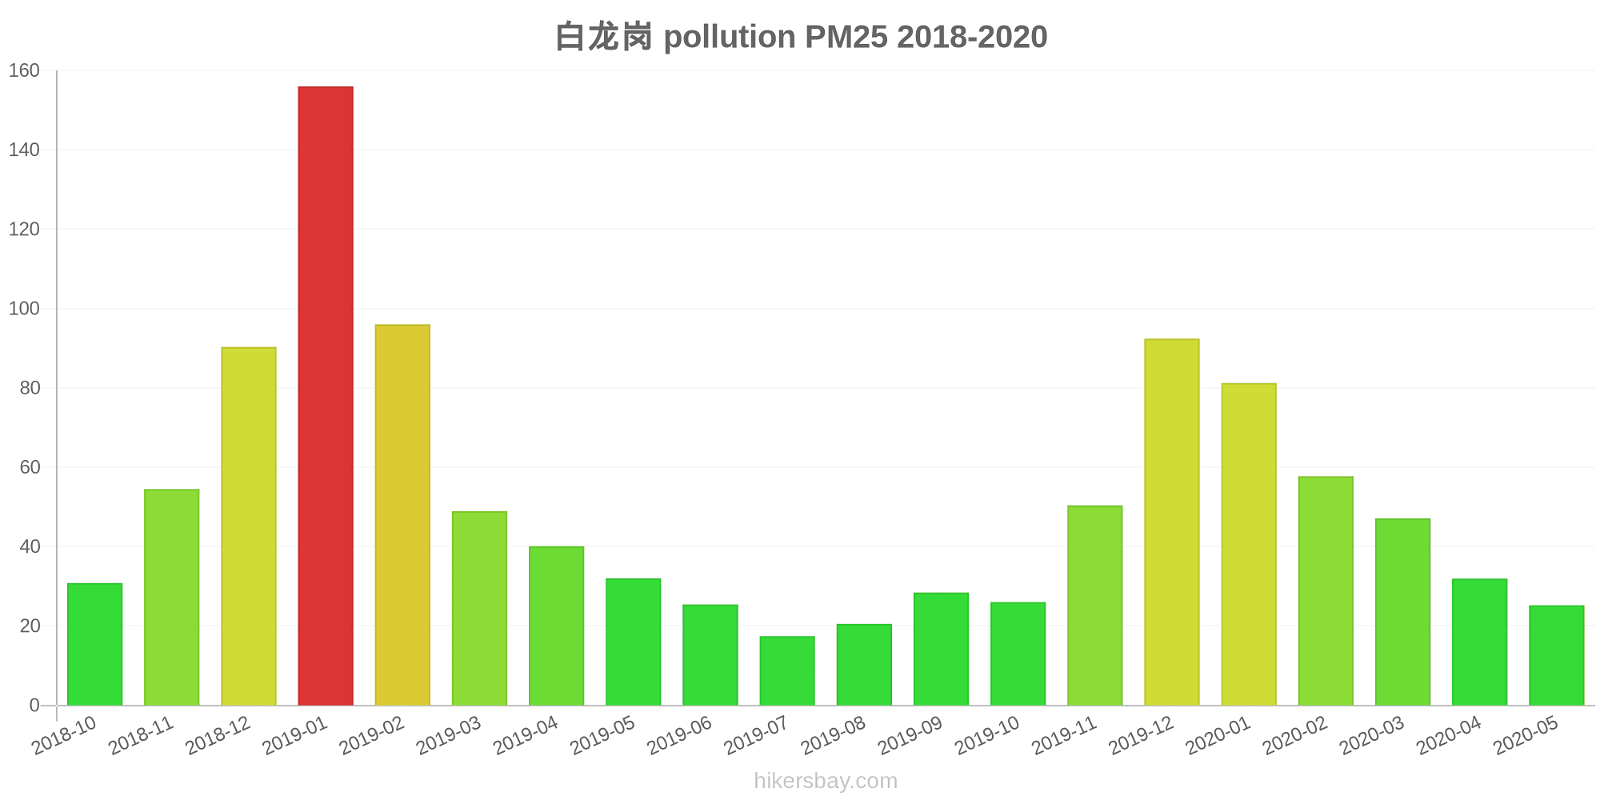
| index | 2020-05 | 2020-04 | 2020-03 | 2020-02 | 2020-01 | 2019-12 | 2019-11 | 2019-10 | 2019-09 | 2019-08 | 2019-07 | 2019-06 | 2019-05 | 2019-04 | 2019-03 | 2019-02 | 2019-01 | 2018-12 | 2018-11 | 2018-10 |
|---|---|---|---|---|---|---|---|---|---|---|---|---|---|---|---|---|---|---|---|---|
| pm25 | 25 | 32 | 47 | 58 | 81 | 92 | 50 | 26 | 28 | 21 | 17 | 25 | 32 | 40 | 49 | 96 | 156 | 90 | 55 | 31 |
| co | 698 | 655 | 833 | 864 | 1 | 1 | 799 | 719 | 642 | 667 | 545 | 695 | 656 | 789 | 940 | 1 | 1 | 1 | 1 | 851 |
| no2 | 24 | 25 | 19 | 12 | 30 | 45 | 40 | 30 | 27 | 23 | 23 | 29 | 33 | 33 | 40 | 32 | 49 | 42 | 41 | 38 |
| o3 | 122 | 125 | 106 | 96 | 61 | 61 | 81 | 98 | 158 | 165 | 151 | 137 | 118 | 105 | 93 | 60 | 44 | 40 | 68 | 97 |
| pm10 | 46 | 54 | 74 | 68 | 97 | 120 | 83 | 43 | 45 | 36 | 48 | 51 | 71 | 63 | 77 | 114 | 185 | 129 | 82 | 60 |
| so2 | 4.2 | 6.7 | 7.7 | 6.6 | 6.6 | 7.9 | 8 | 6.1 | 5.5 | 2.5 | 3 | 3.4 | 6 | 8.8 | 9.9 | 8.5 | 11 | 14 | 13 | 11 |