Air Pollution in Xiejia’ao: Real-time Air Quality Index and smog alert.
Pollution and air quality forecast for Xiejia’ao. Today is Tuesday, June 2, 2026. The following air pollution values have been recorded for Xiejia’ao:- particulate matter (PM10) suspended dust - 179 (Very bad Hazardous)
- particulate matter (PM2.5) dust - 35 (Unhealthy for Sensitive Groups)
- ozone (O3) - 0 (Good)
- nitrogen dioxide (NO2) - 0 (Good)
- sulfur dioxide (SO2) - 0 (Good)

What is the air quality in Xiejia’ao today? Is the air polluted in Xiejia’ao?. Is there smog?
What is the level of PM10 today in Xiejia’ao? (particulate matter (PM10) suspended dust)
The current level of particulate matter PM10 in Xiejia’ao is:
179 (Very bad Hazardous)
The highest PM10 values usually occur in month: 180 (January 2019).
The lowest value of particulate matter PM10 pollution in Xiejia’ao is usually recorded in: July (50).
What is the current level of PM2.5 in Xiejia’ao? (particulate matter (PM2.5) dust)
Today's PM2.5 level is:
35 (Unhealthy for Sensitive Groups)
For comparison, the highest level of PM2.5 in Xiejia’ao in the last 7 days was: 56 (Friday, May 27, 2022) and the lowest: 56 (Friday, May 27, 2022).
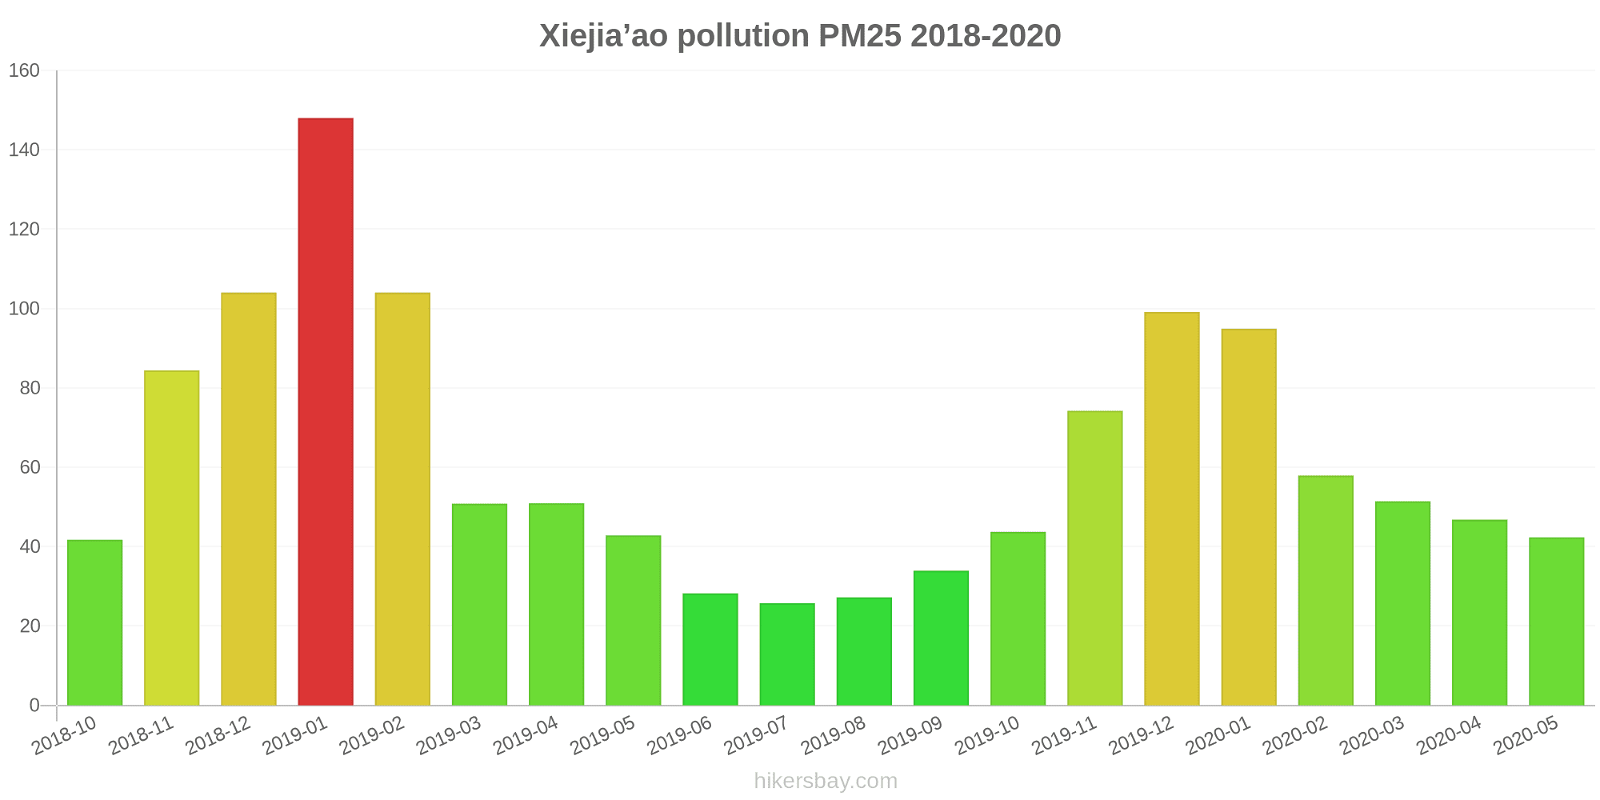
The highest PM2.5 values were recorded: 148 (January 2019).
The lowest level of particulate matter PM2.5 pollution occurs in month: July (26).
How is the O3 level today in Xiejia’ao? (ozone (O3))
0 (Good)
How high is the level of NO2? (nitrogen dioxide (NO2))
0 (Good)
What is the level of SO2 pollution? (sulfur dioxide (SO2))
0 (Good)
Current data Friday, May 27, 2022, 12:00 PM
PM10 179 (Very bad Hazardous)
PM2,5 35 (Unhealthy for Sensitive Groups)
O3 0 (Good)
NO2 0 (Good)
SO2 0 (Good)
Data on air pollution from recent days in Xiejia’ao
index
2022-05-27
pm10
56
Unhealthy for Sensitive Groups
pm25
56
Unhealthy
o3
0
Good
no2
0
Good
so2
0
Good
data source »
Air pollution in Xiejia’ao from October 2018 to May 2020
index
2020-05
2020-04
2020-03
2020-02
2020-01
2019-12
2019-11
2019-10
2019-09
2019-08
2019-07
2019-06
2019-05
2019-04
2019-03
2019-02
2019-01
2018-12
2018-11
2018-10
pm25
42 (Unhealthy for Sensitive Groups)
47 (Unhealthy for Sensitive Groups)
51 (Unhealthy for Sensitive Groups)
58 (Unhealthy)
95 (Very Unhealthy)
99 (Very Unhealthy)
74 (Unhealthy)
44 (Unhealthy for Sensitive Groups)
34 (Moderate)
27 (Moderate)
26 (Moderate)
28 (Moderate)
43 (Unhealthy for Sensitive Groups)
51 (Unhealthy for Sensitive Groups)
51 (Unhealthy for Sensitive Groups)
104 (Very Unhealthy)
148 (Very bad Hazardous)
104 (Very Unhealthy)
84 (Very Unhealthy)
42 (Unhealthy for Sensitive Groups)
co
762 (Good)
746 (Good)
966 (Good)
1 (Good)
1 (Good)
1 (Good)
836 (Good)
707 (Good)
793 (Good)
808 (Good)
788 (Good)
772 (Good)
727 (Good)
803 (Good)
747 (Good)
1 (Good)
1 (Good)
1 (Good)
1 (Good)
899 (Good)
no2
21 (Good)
30 (Good)
26 (Good)
23 (Good)
38 (Good)
52 (Moderate)
45 (Moderate)
34 (Good)
27 (Good)
25 (Good)
24 (Good)
22 (Good)
24 (Good)
25 (Good)
33 (Good)
32 (Good)
50 (Moderate)
45 (Moderate)
45 (Moderate)
42 (Moderate)
o3
138 (Unhealthy for Sensitive Groups)
129 (Unhealthy for Sensitive Groups)
107 (Moderate)
83 (Moderate)
69 (Good)
66 (Good)
92 (Moderate)
103 (Moderate)
156 (Unhealthy)
160 (Unhealthy)
152 (Unhealthy)
161 (Unhealthy)
142 (Unhealthy for Sensitive Groups)
121 (Unhealthy for Sensitive Groups)
109 (Moderate)
75 (Moderate)
54 (Good)
45 (Good)
77 (Moderate)
97 (Moderate)
pm10
66 (Unhealthy for Sensitive Groups)
65 (Unhealthy for Sensitive Groups)
68 (Unhealthy for Sensitive Groups)
59 (Unhealthy for Sensitive Groups)
93 (Unhealthy)
112 (Very Unhealthy)
102 (Unhealthy)
70 (Unhealthy for Sensitive Groups)
64 (Unhealthy for Sensitive Groups)
54 (Unhealthy for Sensitive Groups)
50 (Moderate)
54 (Unhealthy for Sensitive Groups)
95 (Unhealthy)
80 (Unhealthy for Sensitive Groups)
87 (Unhealthy)
125 (Very Unhealthy)
180 (Very bad Hazardous)
146 (Very Unhealthy)
125 (Very Unhealthy)
76 (Unhealthy for Sensitive Groups)
so2
11 (Good)
13 (Good)
11 (Good)
9.3 (Good)
9.9 (Good)
9.8 (Good)
11 (Good)
9.2 (Good)
11 (Good)
7.9 (Good)
6.4 (Good)
8.2 (Good)
14 (Good)
12 (Good)
12 (Good)
9 (Good)
15 (Good)
13 (Good)
13 (Good)
15 (Good)
data source »
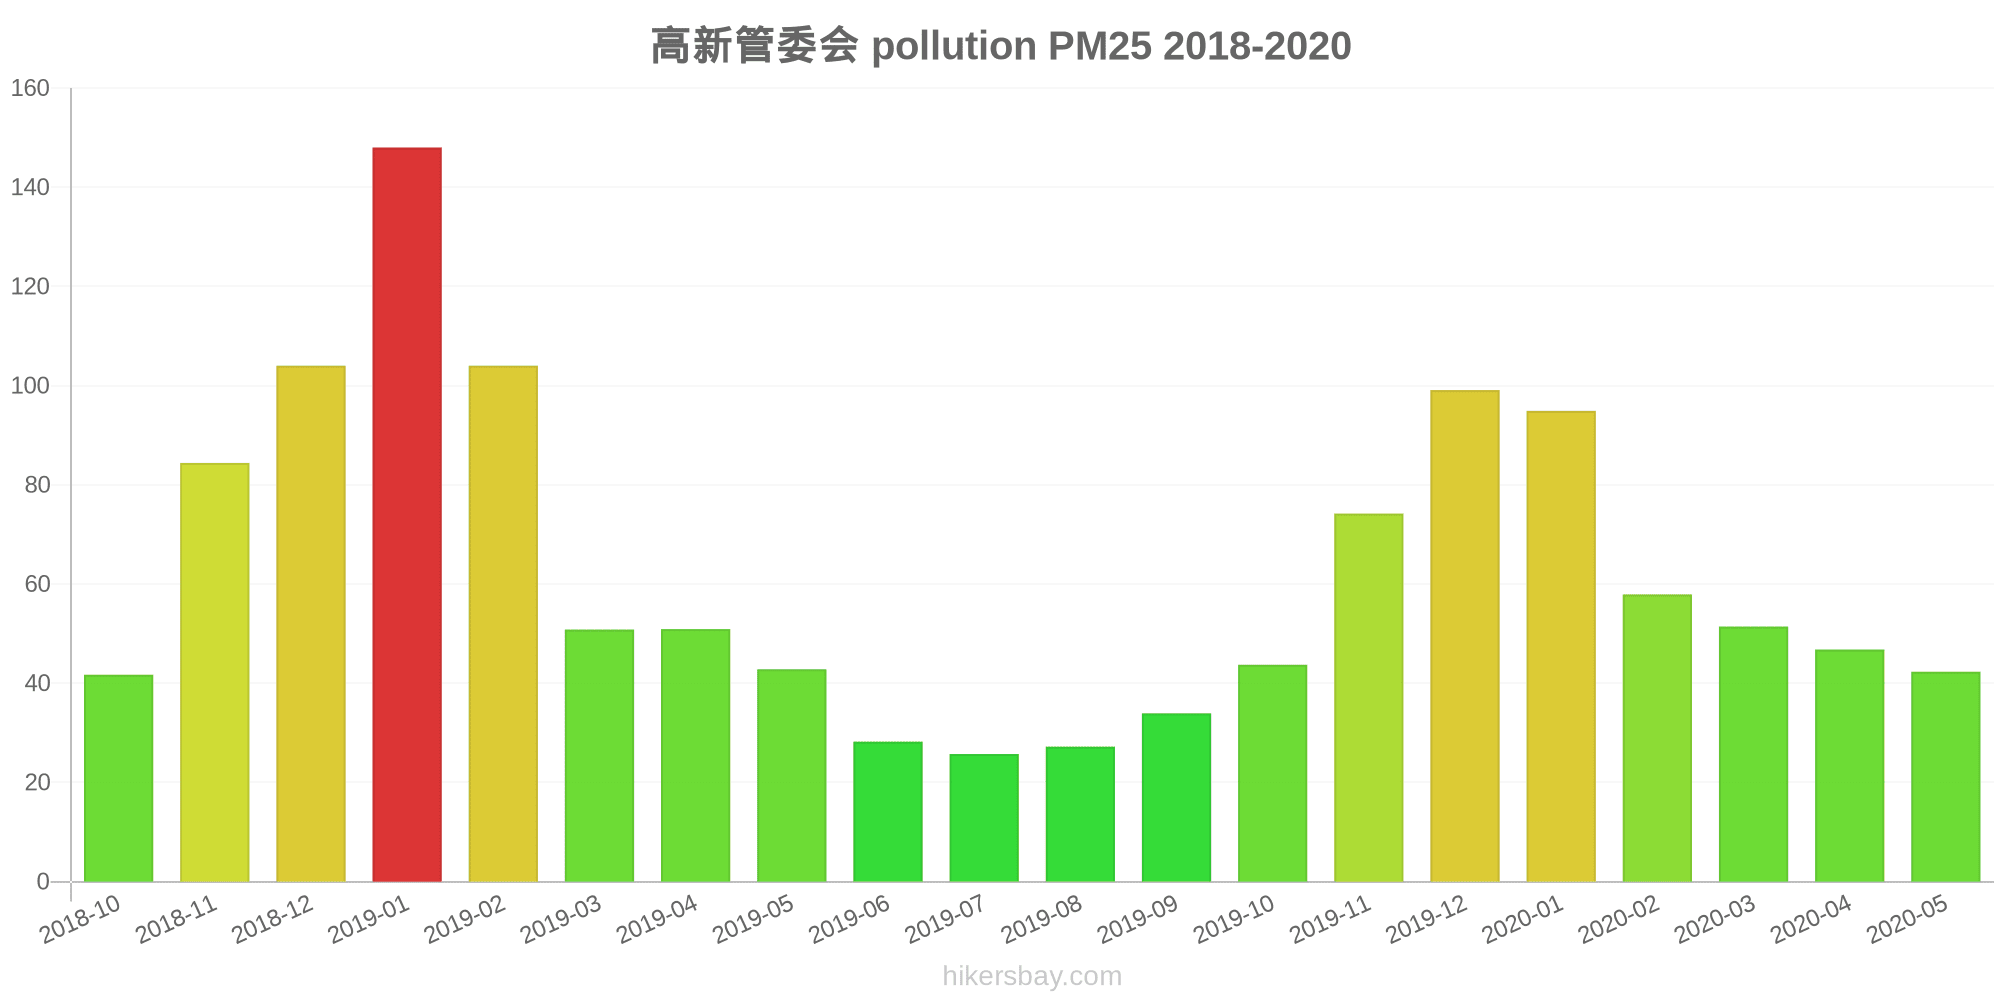
高新管委会
Friday, May 27, 2022, 12:00 PM
PM10 179 (Very bad Hazardous)
particulate matter (PM10) suspended dust
PM2,5 35 (Unhealthy for Sensitive Groups)
particulate matter (PM2.5) dust
O3 0.04 (Good)
ozone (O3)
NO2 0 (Good)
nitrogen dioxide (NO2)
SO2 0 (Good)
sulfur dioxide (SO2)
高新管委会
index
2022-05-27
pm10
56
pm25
56
o3
0.03
no2
0
so2
0
高新管委会
2018-10 2020-05

index
2020-05
2020-04
2020-03
2020-02
2020-01
2019-12
2019-11
2019-10
2019-09
2019-08
2019-07
2019-06
2019-05
2019-04
2019-03
2019-02
2019-01
2018-12
2018-11
2018-10
pm25
42
47
51
58
95
99
74
44
34
27
26
28
43
51
51
104
148
104
84
42
co
762
746
966
1
1
1
836
707
793
808
788
772
727
803
747
1
1
1
1
899
no2
21
30
26
23
38
52
45
34
27
25
24
22
24
25
33
32
50
45
45
42
o3
138
129
107
83
69
66
92
103
156
160
152
161
142
121
109
75
54
45
77
97
pm10
66
65
68
59
93
112
102
70
64
54
50
54
95
80
87
125
180
146
125
76
so2
11
13
11
9.3
9.9
9.8
11
9.2
11
7.9
6.4
8.2
14
12
12
9
15
13
13
15
* Pollution data source:
https://openaq.org
(ChinaAQIData)
The data is licensed under CC-By 4.0
PM10 179 (Very bad Hazardous)
PM2,5 35 (Unhealthy for Sensitive Groups)
O3 0 (Good)
NO2 0 (Good)
SO2 0 (Good)
Data on air pollution from recent days in Xiejia’ao
| index | 2022-05-27 |
|---|---|
| pm10 | 56 Unhealthy for Sensitive Groups |
| pm25 | 56 Unhealthy |
| o3 | 0 Good |
| no2 | 0 Good |
| so2 | 0 Good |

| index | 2020-05 | 2020-04 | 2020-03 | 2020-02 | 2020-01 | 2019-12 | 2019-11 | 2019-10 | 2019-09 | 2019-08 | 2019-07 | 2019-06 | 2019-05 | 2019-04 | 2019-03 | 2019-02 | 2019-01 | 2018-12 | 2018-11 | 2018-10 |
|---|---|---|---|---|---|---|---|---|---|---|---|---|---|---|---|---|---|---|---|---|
| pm25 | 42 (Unhealthy for Sensitive Groups) | 47 (Unhealthy for Sensitive Groups) | 51 (Unhealthy for Sensitive Groups) | 58 (Unhealthy) | 95 (Very Unhealthy) | 99 (Very Unhealthy) | 74 (Unhealthy) | 44 (Unhealthy for Sensitive Groups) | 34 (Moderate) | 27 (Moderate) | 26 (Moderate) | 28 (Moderate) | 43 (Unhealthy for Sensitive Groups) | 51 (Unhealthy for Sensitive Groups) | 51 (Unhealthy for Sensitive Groups) | 104 (Very Unhealthy) | 148 (Very bad Hazardous) | 104 (Very Unhealthy) | 84 (Very Unhealthy) | 42 (Unhealthy for Sensitive Groups) |
| co | 762 (Good) | 746 (Good) | 966 (Good) | 1 (Good) | 1 (Good) | 1 (Good) | 836 (Good) | 707 (Good) | 793 (Good) | 808 (Good) | 788 (Good) | 772 (Good) | 727 (Good) | 803 (Good) | 747 (Good) | 1 (Good) | 1 (Good) | 1 (Good) | 1 (Good) | 899 (Good) |
| no2 | 21 (Good) | 30 (Good) | 26 (Good) | 23 (Good) | 38 (Good) | 52 (Moderate) | 45 (Moderate) | 34 (Good) | 27 (Good) | 25 (Good) | 24 (Good) | 22 (Good) | 24 (Good) | 25 (Good) | 33 (Good) | 32 (Good) | 50 (Moderate) | 45 (Moderate) | 45 (Moderate) | 42 (Moderate) |
| o3 | 138 (Unhealthy for Sensitive Groups) | 129 (Unhealthy for Sensitive Groups) | 107 (Moderate) | 83 (Moderate) | 69 (Good) | 66 (Good) | 92 (Moderate) | 103 (Moderate) | 156 (Unhealthy) | 160 (Unhealthy) | 152 (Unhealthy) | 161 (Unhealthy) | 142 (Unhealthy for Sensitive Groups) | 121 (Unhealthy for Sensitive Groups) | 109 (Moderate) | 75 (Moderate) | 54 (Good) | 45 (Good) | 77 (Moderate) | 97 (Moderate) |
| pm10 | 66 (Unhealthy for Sensitive Groups) | 65 (Unhealthy for Sensitive Groups) | 68 (Unhealthy for Sensitive Groups) | 59 (Unhealthy for Sensitive Groups) | 93 (Unhealthy) | 112 (Very Unhealthy) | 102 (Unhealthy) | 70 (Unhealthy for Sensitive Groups) | 64 (Unhealthy for Sensitive Groups) | 54 (Unhealthy for Sensitive Groups) | 50 (Moderate) | 54 (Unhealthy for Sensitive Groups) | 95 (Unhealthy) | 80 (Unhealthy for Sensitive Groups) | 87 (Unhealthy) | 125 (Very Unhealthy) | 180 (Very bad Hazardous) | 146 (Very Unhealthy) | 125 (Very Unhealthy) | 76 (Unhealthy for Sensitive Groups) |
| so2 | 11 (Good) | 13 (Good) | 11 (Good) | 9.3 (Good) | 9.9 (Good) | 9.8 (Good) | 11 (Good) | 9.2 (Good) | 11 (Good) | 7.9 (Good) | 6.4 (Good) | 8.2 (Good) | 14 (Good) | 12 (Good) | 12 (Good) | 9 (Good) | 15 (Good) | 13 (Good) | 13 (Good) | 15 (Good) |
PM10 179 (Very bad Hazardous)
particulate matter (PM10) suspended dustPM2,5 35 (Unhealthy for Sensitive Groups)
particulate matter (PM2.5) dustO3 0.04 (Good)
ozone (O3)NO2 0 (Good)
nitrogen dioxide (NO2)SO2 0 (Good)
sulfur dioxide (SO2)高新管委会
| index | 2022-05-27 |
|---|---|
| pm10 | 56 |
| pm25 | 56 |
| o3 | 0.03 |
| no2 | 0 |
| so2 | 0 |
高新管委会
| index | 2020-05 | 2020-04 | 2020-03 | 2020-02 | 2020-01 | 2019-12 | 2019-11 | 2019-10 | 2019-09 | 2019-08 | 2019-07 | 2019-06 | 2019-05 | 2019-04 | 2019-03 | 2019-02 | 2019-01 | 2018-12 | 2018-11 | 2018-10 |
|---|---|---|---|---|---|---|---|---|---|---|---|---|---|---|---|---|---|---|---|---|
| pm25 | 42 | 47 | 51 | 58 | 95 | 99 | 74 | 44 | 34 | 27 | 26 | 28 | 43 | 51 | 51 | 104 | 148 | 104 | 84 | 42 |
| co | 762 | 746 | 966 | 1 | 1 | 1 | 836 | 707 | 793 | 808 | 788 | 772 | 727 | 803 | 747 | 1 | 1 | 1 | 1 | 899 |
| no2 | 21 | 30 | 26 | 23 | 38 | 52 | 45 | 34 | 27 | 25 | 24 | 22 | 24 | 25 | 33 | 32 | 50 | 45 | 45 | 42 |
| o3 | 138 | 129 | 107 | 83 | 69 | 66 | 92 | 103 | 156 | 160 | 152 | 161 | 142 | 121 | 109 | 75 | 54 | 45 | 77 | 97 |
| pm10 | 66 | 65 | 68 | 59 | 93 | 112 | 102 | 70 | 64 | 54 | 50 | 54 | 95 | 80 | 87 | 125 | 180 | 146 | 125 | 76 |
| so2 | 11 | 13 | 11 | 9.3 | 9.9 | 9.8 | 11 | 9.2 | 11 | 7.9 | 6.4 | 8.2 | 14 | 12 | 12 | 9 | 15 | 13 | 13 | 15 |