Air Pollution in Xiaowan: Real-time Air Quality Index and smog alert.
Pollution and air quality forecast for Xiaowan. Today is Tuesday, June 2, 2026. The following air pollution values have been recorded for Xiaowan:- particulate matter (PM10) suspended dust - 179 (Very bad Hazardous)
- particulate matter (PM2.5) dust - 35 (Unhealthy for Sensitive Groups)
- ozone (O3) - 0 (Good)
- nitrogen dioxide (NO2) - 0 (Good)
- sulfur dioxide (SO2) - 0 (Good)

What is the air quality in Xiaowan today? Is the air polluted in Xiaowan?. Is there smog?
What is the level of PM10 today in Xiaowan? (particulate matter (PM10) suspended dust)
The current level of particulate matter PM10 in Xiaowan is:
179 (Very bad Hazardous)
The highest PM10 values usually occur in month: 185 (January 2019).
The lowest value of particulate matter PM10 pollution in Xiaowan is usually recorded in: July (49).
What is the current level of PM2.5 in Xiaowan? (particulate matter (PM2.5) dust)
Today's PM2.5 level is:
35 (Unhealthy for Sensitive Groups)
For comparison, the highest level of PM2.5 in Xiaowan in the last 7 days was: 56 (Friday, May 27, 2022) and the lowest: 56 (Friday, May 27, 2022).
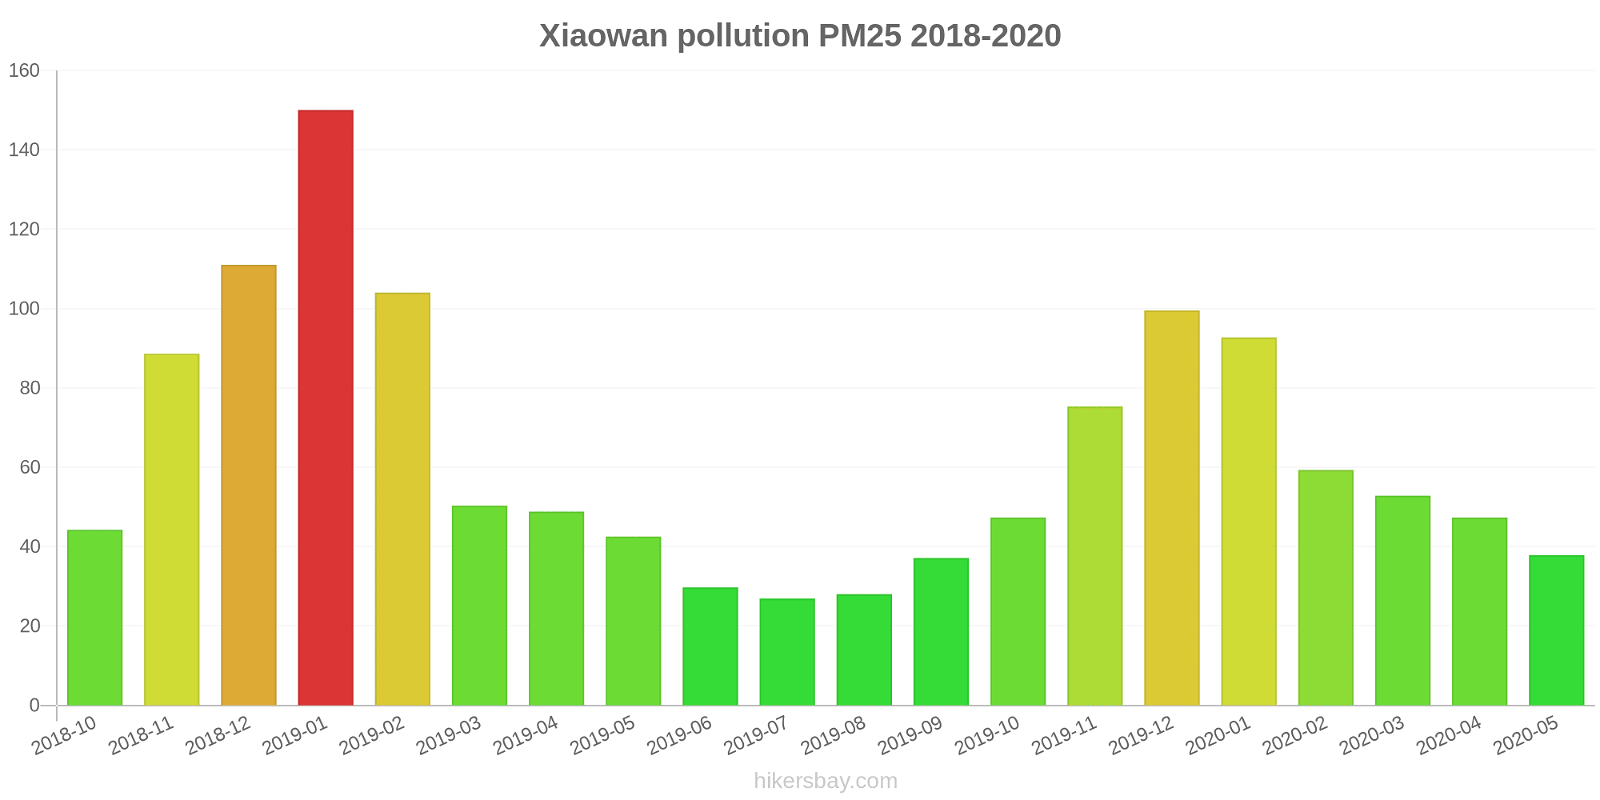
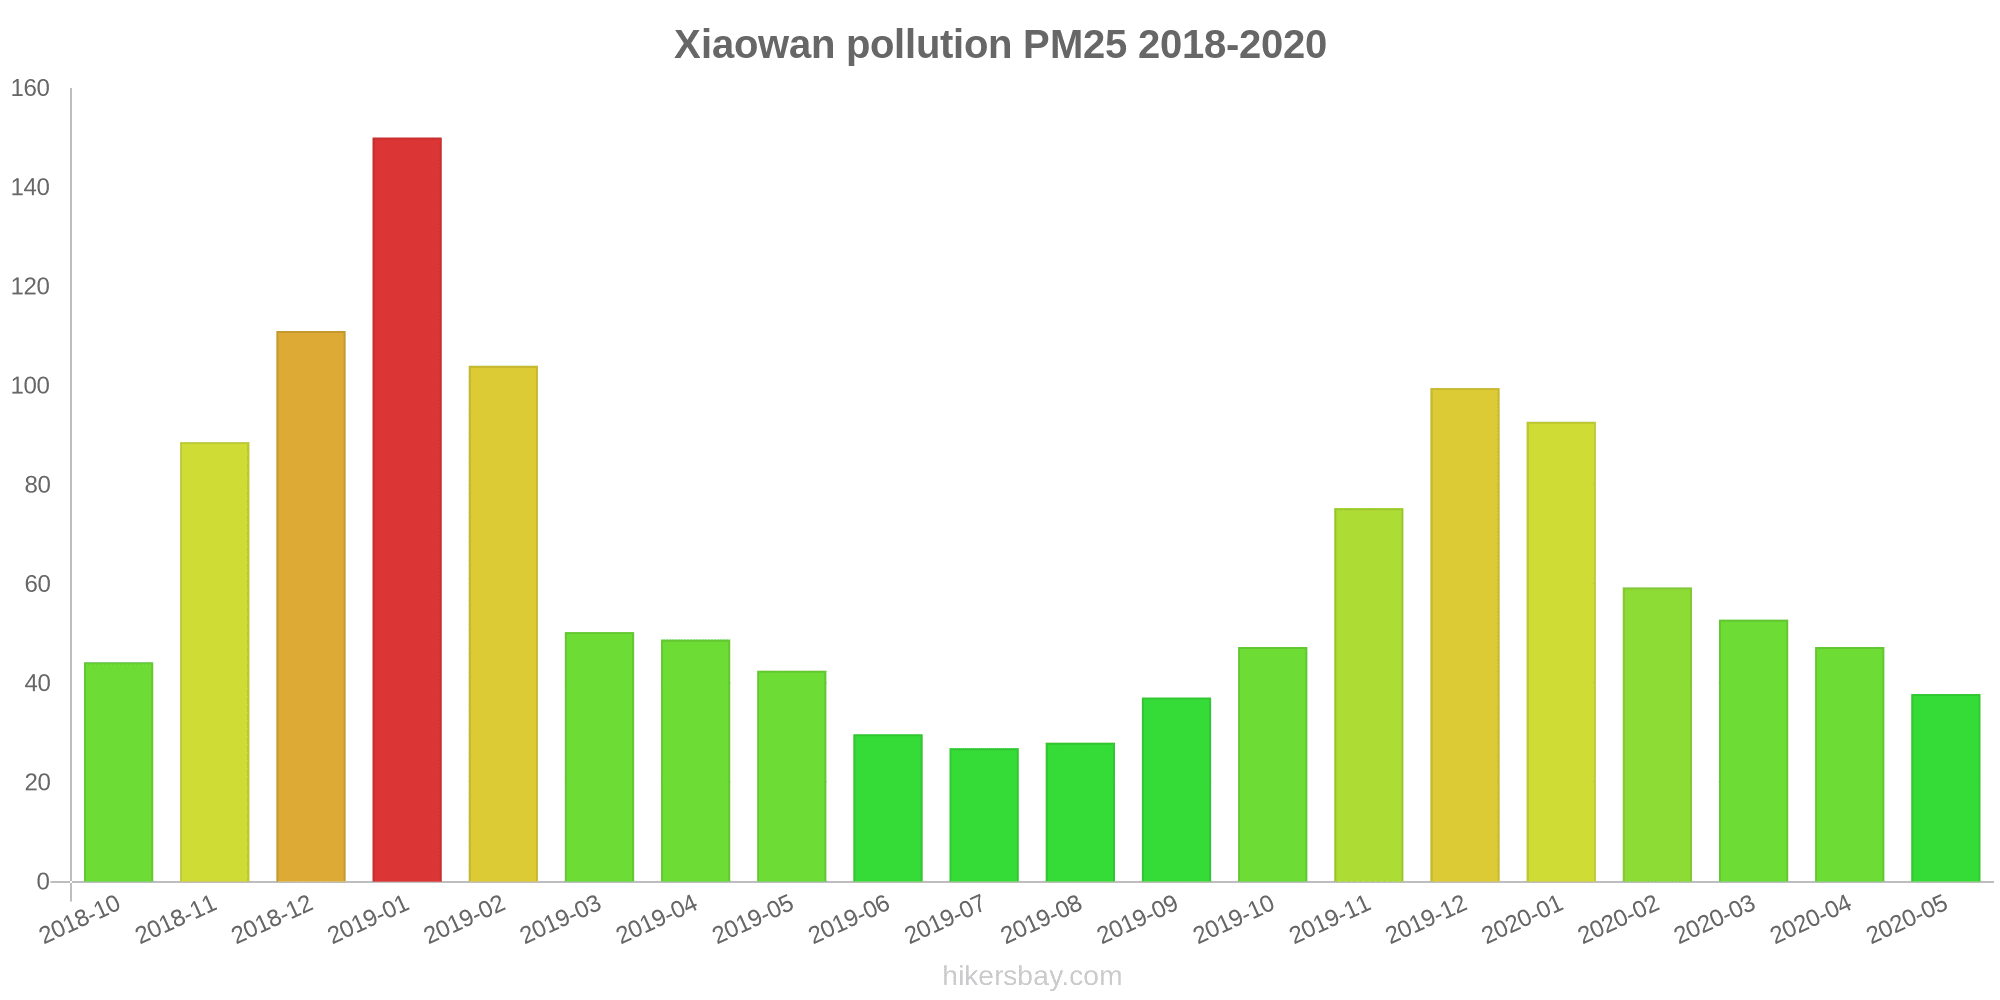
The highest PM2.5 values were recorded: 150 (January 2019).
The lowest level of particulate matter PM2.5 pollution occurs in month: July (27).
How is the O3 level today in Xiaowan? (ozone (O3))
0 (Good)
How high is the level of NO2? (nitrogen dioxide (NO2))
0 (Good)
What is the level of SO2 pollution? (sulfur dioxide (SO2))
0 (Good)
Current data Friday, May 27, 2022, 12:00 PM
PM10 179 (Very bad Hazardous)
PM2,5 35 (Unhealthy for Sensitive Groups)
O3 0 (Good)
NO2 0 (Good)
SO2 0 (Good)
Data on air pollution from recent days in Xiaowan
index
2022-05-27
pm10
56
Unhealthy for Sensitive Groups
pm25
56
Unhealthy
o3
0
Good
no2
0
Good
so2
0
Good
data source »
Air pollution in Xiaowan from October 2018 to May 2020
index
2020-05
2020-04
2020-03
2020-02
2020-01
2019-12
2019-11
2019-10
2019-09
2019-08
2019-07
2019-06
2019-05
2019-04
2019-03
2019-02
2019-01
2018-12
2018-11
2018-10
pm25
38 (Unhealthy for Sensitive Groups)
47 (Unhealthy for Sensitive Groups)
53 (Unhealthy for Sensitive Groups)
59 (Unhealthy)
93 (Very Unhealthy)
100 (Very Unhealthy)
75 (Very Unhealthy)
47 (Unhealthy for Sensitive Groups)
37 (Unhealthy for Sensitive Groups)
28 (Moderate)
27 (Moderate)
30 (Moderate)
43 (Unhealthy for Sensitive Groups)
49 (Unhealthy for Sensitive Groups)
50 (Unhealthy for Sensitive Groups)
104 (Very Unhealthy)
150 (Very bad Hazardous)
111 (Very bad Hazardous)
89 (Very Unhealthy)
44 (Unhealthy for Sensitive Groups)
co
683 (Good)
654 (Good)
976 (Good)
970 (Good)
1 (Good)
924 (Good)
773 (Good)
741 (Good)
767 (Good)
756 (Good)
764 (Good)
715 (Good)
617 (Good)
740 (Good)
631 (Good)
1 (Good)
1 (Good)
1 (Good)
1 (Good)
815 (Good)
no2
20 (Good)
29 (Good)
18 (Good)
13 (Good)
31 (Good)
46 (Moderate)
43 (Moderate)
32 (Good)
28 (Good)
23 (Good)
21 (Good)
20 (Good)
24 (Good)
26 (Good)
35 (Good)
31 (Good)
49 (Moderate)
46 (Moderate)
41 (Moderate)
43 (Moderate)
o3
135 (Unhealthy for Sensitive Groups)
132 (Unhealthy for Sensitive Groups)
107 (Moderate)
85 (Moderate)
70 (Moderate)
63 (Good)
90 (Moderate)
101 (Moderate)
150 (Unhealthy)
156 (Unhealthy)
148 (Unhealthy for Sensitive Groups)
154 (Unhealthy)
137 (Unhealthy for Sensitive Groups)
120 (Unhealthy for Sensitive Groups)
113 (Moderate)
80 (Moderate)
51 (Good)
42 (Good)
78 (Moderate)
103 (Moderate)
pm10
67 (Unhealthy for Sensitive Groups)
68 (Unhealthy for Sensitive Groups)
70 (Unhealthy for Sensitive Groups)
62 (Unhealthy for Sensitive Groups)
96 (Unhealthy)
114 (Very Unhealthy)
104 (Unhealthy)
67 (Unhealthy for Sensitive Groups)
64 (Unhealthy for Sensitive Groups)
56 (Unhealthy for Sensitive Groups)
49 (Moderate)
52 (Unhealthy for Sensitive Groups)
87 (Unhealthy)
81 (Unhealthy)
90 (Unhealthy)
127 (Very Unhealthy)
185 (Very bad Hazardous)
150 (Very bad Hazardous)
130 (Very Unhealthy)
82 (Unhealthy)
so2
12 (Good)
13 (Good)
9.7 (Good)
8.8 (Good)
9.6 (Good)
11 (Good)
11 (Good)
9.4 (Good)
9.5 (Good)
6.6 (Good)
6 (Good)
8.7 (Good)
11 (Good)
10 (Good)
11 (Good)
8.1 (Good)
12 (Good)
11 (Good)
10 (Good)
11 (Good)
data source »
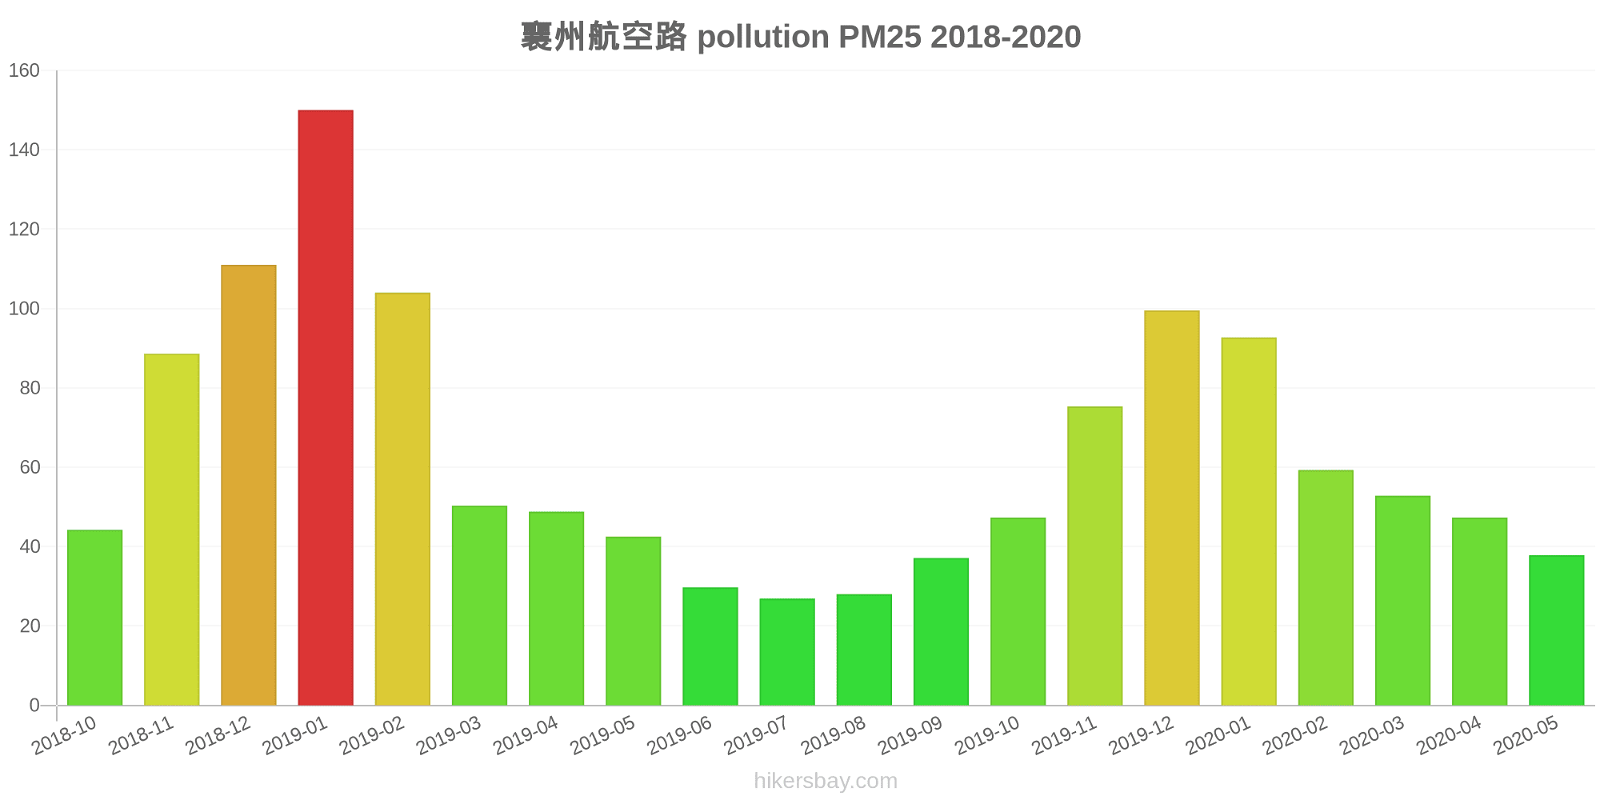
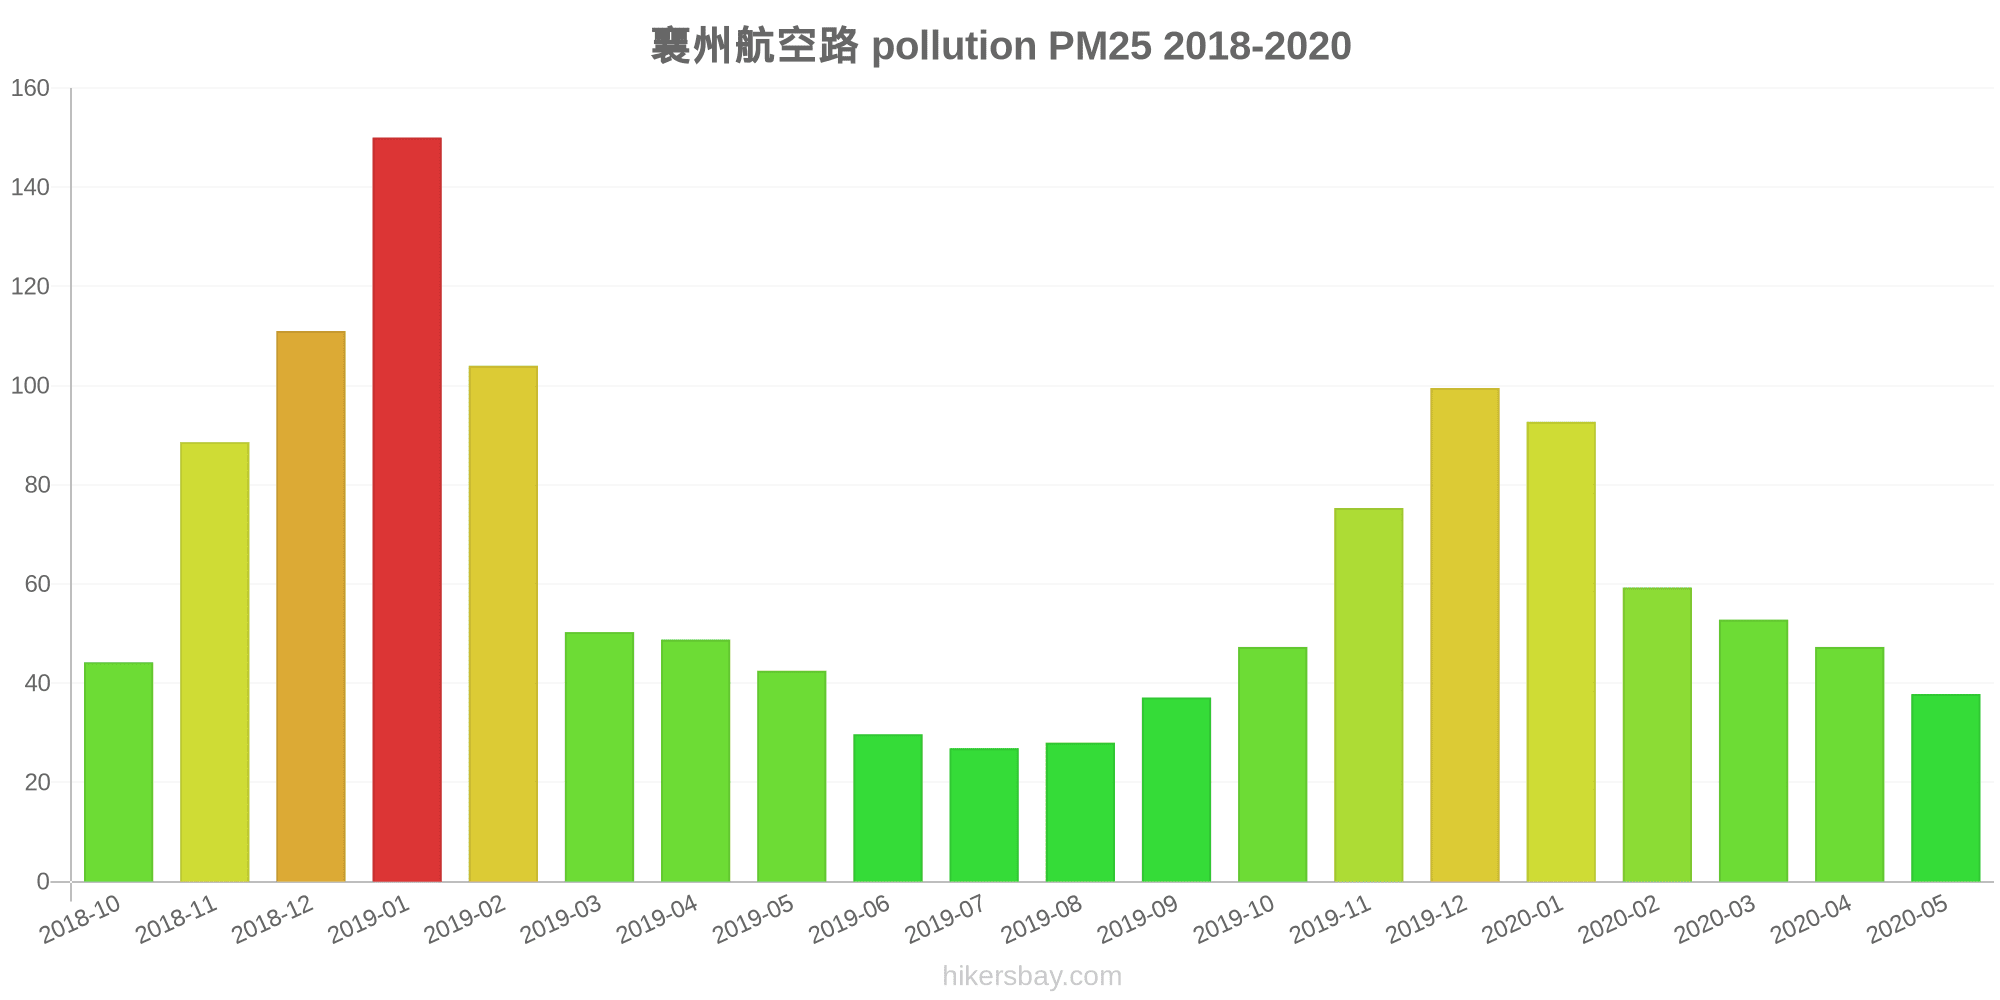
襄州航空路
Friday, May 27, 2022, 12:00 PM
PM10 179 (Very bad Hazardous)
particulate matter (PM10) suspended dust
PM2,5 35 (Unhealthy for Sensitive Groups)
particulate matter (PM2.5) dust
O3 0.04 (Good)
ozone (O3)
NO2 0 (Good)
nitrogen dioxide (NO2)
SO2 0 (Good)
sulfur dioxide (SO2)
襄州航空路
index
2022-05-27
pm10
56
pm25
56
o3
0.03
no2
0
so2
0
襄州航空路
2018-10 2020-05
index
2020-05
2020-04
2020-03
2020-02
2020-01
2019-12
2019-11
2019-10
2019-09
2019-08
2019-07
2019-06
2019-05
2019-04
2019-03
2019-02
2019-01
2018-12
2018-11
2018-10
pm25
38
47
53
59
93
100
75
47
37
28
27
30
43
49
50
104
150
111
89
44
co
683
654
976
970
1
924
773
741
767
756
764
715
617
740
631
1
1
1
1
815
no2
20
29
18
13
31
46
43
32
28
23
21
20
24
26
35
31
49
46
41
43
o3
135
132
107
85
70
63
90
101
150
156
148
154
137
120
113
80
51
42
78
103
pm10
67
68
70
62
96
114
104
67
64
56
49
52
87
81
90
127
185
150
130
82
so2
12
13
9.7
8.8
9.6
11
11
9.4
9.5
6.6
6
8.7
11
10
11
8.1
12
11
10
11
* Pollution data source:
https://openaq.org
(ChinaAQIData)
The data is licensed under CC-By 4.0
PM10 179 (Very bad Hazardous)
PM2,5 35 (Unhealthy for Sensitive Groups)
O3 0 (Good)
NO2 0 (Good)
SO2 0 (Good)
Data on air pollution from recent days in Xiaowan
| index | 2022-05-27 |
|---|---|
| pm10 | 56 Unhealthy for Sensitive Groups |
| pm25 | 56 Unhealthy |
| o3 | 0 Good |
| no2 | 0 Good |
| so2 | 0 Good |
| index | 2020-05 | 2020-04 | 2020-03 | 2020-02 | 2020-01 | 2019-12 | 2019-11 | 2019-10 | 2019-09 | 2019-08 | 2019-07 | 2019-06 | 2019-05 | 2019-04 | 2019-03 | 2019-02 | 2019-01 | 2018-12 | 2018-11 | 2018-10 |
|---|---|---|---|---|---|---|---|---|---|---|---|---|---|---|---|---|---|---|---|---|
| pm25 | 38 (Unhealthy for Sensitive Groups) | 47 (Unhealthy for Sensitive Groups) | 53 (Unhealthy for Sensitive Groups) | 59 (Unhealthy) | 93 (Very Unhealthy) | 100 (Very Unhealthy) | 75 (Very Unhealthy) | 47 (Unhealthy for Sensitive Groups) | 37 (Unhealthy for Sensitive Groups) | 28 (Moderate) | 27 (Moderate) | 30 (Moderate) | 43 (Unhealthy for Sensitive Groups) | 49 (Unhealthy for Sensitive Groups) | 50 (Unhealthy for Sensitive Groups) | 104 (Very Unhealthy) | 150 (Very bad Hazardous) | 111 (Very bad Hazardous) | 89 (Very Unhealthy) | 44 (Unhealthy for Sensitive Groups) |
| co | 683 (Good) | 654 (Good) | 976 (Good) | 970 (Good) | 1 (Good) | 924 (Good) | 773 (Good) | 741 (Good) | 767 (Good) | 756 (Good) | 764 (Good) | 715 (Good) | 617 (Good) | 740 (Good) | 631 (Good) | 1 (Good) | 1 (Good) | 1 (Good) | 1 (Good) | 815 (Good) |
| no2 | 20 (Good) | 29 (Good) | 18 (Good) | 13 (Good) | 31 (Good) | 46 (Moderate) | 43 (Moderate) | 32 (Good) | 28 (Good) | 23 (Good) | 21 (Good) | 20 (Good) | 24 (Good) | 26 (Good) | 35 (Good) | 31 (Good) | 49 (Moderate) | 46 (Moderate) | 41 (Moderate) | 43 (Moderate) |
| o3 | 135 (Unhealthy for Sensitive Groups) | 132 (Unhealthy for Sensitive Groups) | 107 (Moderate) | 85 (Moderate) | 70 (Moderate) | 63 (Good) | 90 (Moderate) | 101 (Moderate) | 150 (Unhealthy) | 156 (Unhealthy) | 148 (Unhealthy for Sensitive Groups) | 154 (Unhealthy) | 137 (Unhealthy for Sensitive Groups) | 120 (Unhealthy for Sensitive Groups) | 113 (Moderate) | 80 (Moderate) | 51 (Good) | 42 (Good) | 78 (Moderate) | 103 (Moderate) |
| pm10 | 67 (Unhealthy for Sensitive Groups) | 68 (Unhealthy for Sensitive Groups) | 70 (Unhealthy for Sensitive Groups) | 62 (Unhealthy for Sensitive Groups) | 96 (Unhealthy) | 114 (Very Unhealthy) | 104 (Unhealthy) | 67 (Unhealthy for Sensitive Groups) | 64 (Unhealthy for Sensitive Groups) | 56 (Unhealthy for Sensitive Groups) | 49 (Moderate) | 52 (Unhealthy for Sensitive Groups) | 87 (Unhealthy) | 81 (Unhealthy) | 90 (Unhealthy) | 127 (Very Unhealthy) | 185 (Very bad Hazardous) | 150 (Very bad Hazardous) | 130 (Very Unhealthy) | 82 (Unhealthy) |
| so2 | 12 (Good) | 13 (Good) | 9.7 (Good) | 8.8 (Good) | 9.6 (Good) | 11 (Good) | 11 (Good) | 9.4 (Good) | 9.5 (Good) | 6.6 (Good) | 6 (Good) | 8.7 (Good) | 11 (Good) | 10 (Good) | 11 (Good) | 8.1 (Good) | 12 (Good) | 11 (Good) | 10 (Good) | 11 (Good) |
PM10 179 (Very bad Hazardous)
particulate matter (PM10) suspended dustPM2,5 35 (Unhealthy for Sensitive Groups)
particulate matter (PM2.5) dustO3 0.04 (Good)
ozone (O3)NO2 0 (Good)
nitrogen dioxide (NO2)SO2 0 (Good)
sulfur dioxide (SO2)襄州航空路
| index | 2022-05-27 |
|---|---|
| pm10 | 56 |
| pm25 | 56 |
| o3 | 0.03 |
| no2 | 0 |
| so2 | 0 |
襄州航空路
| index | 2020-05 | 2020-04 | 2020-03 | 2020-02 | 2020-01 | 2019-12 | 2019-11 | 2019-10 | 2019-09 | 2019-08 | 2019-07 | 2019-06 | 2019-05 | 2019-04 | 2019-03 | 2019-02 | 2019-01 | 2018-12 | 2018-11 | 2018-10 |
|---|---|---|---|---|---|---|---|---|---|---|---|---|---|---|---|---|---|---|---|---|
| pm25 | 38 | 47 | 53 | 59 | 93 | 100 | 75 | 47 | 37 | 28 | 27 | 30 | 43 | 49 | 50 | 104 | 150 | 111 | 89 | 44 |
| co | 683 | 654 | 976 | 970 | 1 | 924 | 773 | 741 | 767 | 756 | 764 | 715 | 617 | 740 | 631 | 1 | 1 | 1 | 1 | 815 |
| no2 | 20 | 29 | 18 | 13 | 31 | 46 | 43 | 32 | 28 | 23 | 21 | 20 | 24 | 26 | 35 | 31 | 49 | 46 | 41 | 43 |
| o3 | 135 | 132 | 107 | 85 | 70 | 63 | 90 | 101 | 150 | 156 | 148 | 154 | 137 | 120 | 113 | 80 | 51 | 42 | 78 | 103 |
| pm10 | 67 | 68 | 70 | 62 | 96 | 114 | 104 | 67 | 64 | 56 | 49 | 52 | 87 | 81 | 90 | 127 | 185 | 150 | 130 | 82 |
| so2 | 12 | 13 | 9.7 | 8.8 | 9.6 | 11 | 11 | 9.4 | 9.5 | 6.6 | 6 | 8.7 | 11 | 10 | 11 | 8.1 | 12 | 11 | 10 | 11 |