Air Pollution in Sanhelian: Real-time Air Quality Index and smog alert.
Pollution and air quality forecast for Sanhelian. Today is Tuesday, June 2, 2026. The following air pollution values have been recorded for Sanhelian:- particulate matter (PM10) suspended dust - 179 (Very bad Hazardous)
- particulate matter (PM2.5) dust - 35 (Unhealthy for Sensitive Groups)
- ozone (O3) - 0 (Good)
- nitrogen dioxide (NO2) - 0 (Good)
- sulfur dioxide (SO2) - 0 (Good)

What is the air quality in Sanhelian today? Is the air polluted in Sanhelian?. Is there smog?
What is the level of PM10 today in Sanhelian? (particulate matter (PM10) suspended dust)
The current level of particulate matter PM10 in Sanhelian is:
179 (Very bad Hazardous)
The highest PM10 values usually occur in month: 99 (January 2019).
The lowest value of particulate matter PM10 pollution in Sanhelian is usually recorded in: March (27).
What is the current level of PM2.5 in Sanhelian? (particulate matter (PM2.5) dust)
Today's PM2.5 level is:
35 (Unhealthy for Sensitive Groups)
For comparison, the highest level of PM2.5 in Sanhelian in the last 7 days was: 56 (Friday, May 27, 2022) and the lowest: 56 (Friday, May 27, 2022).
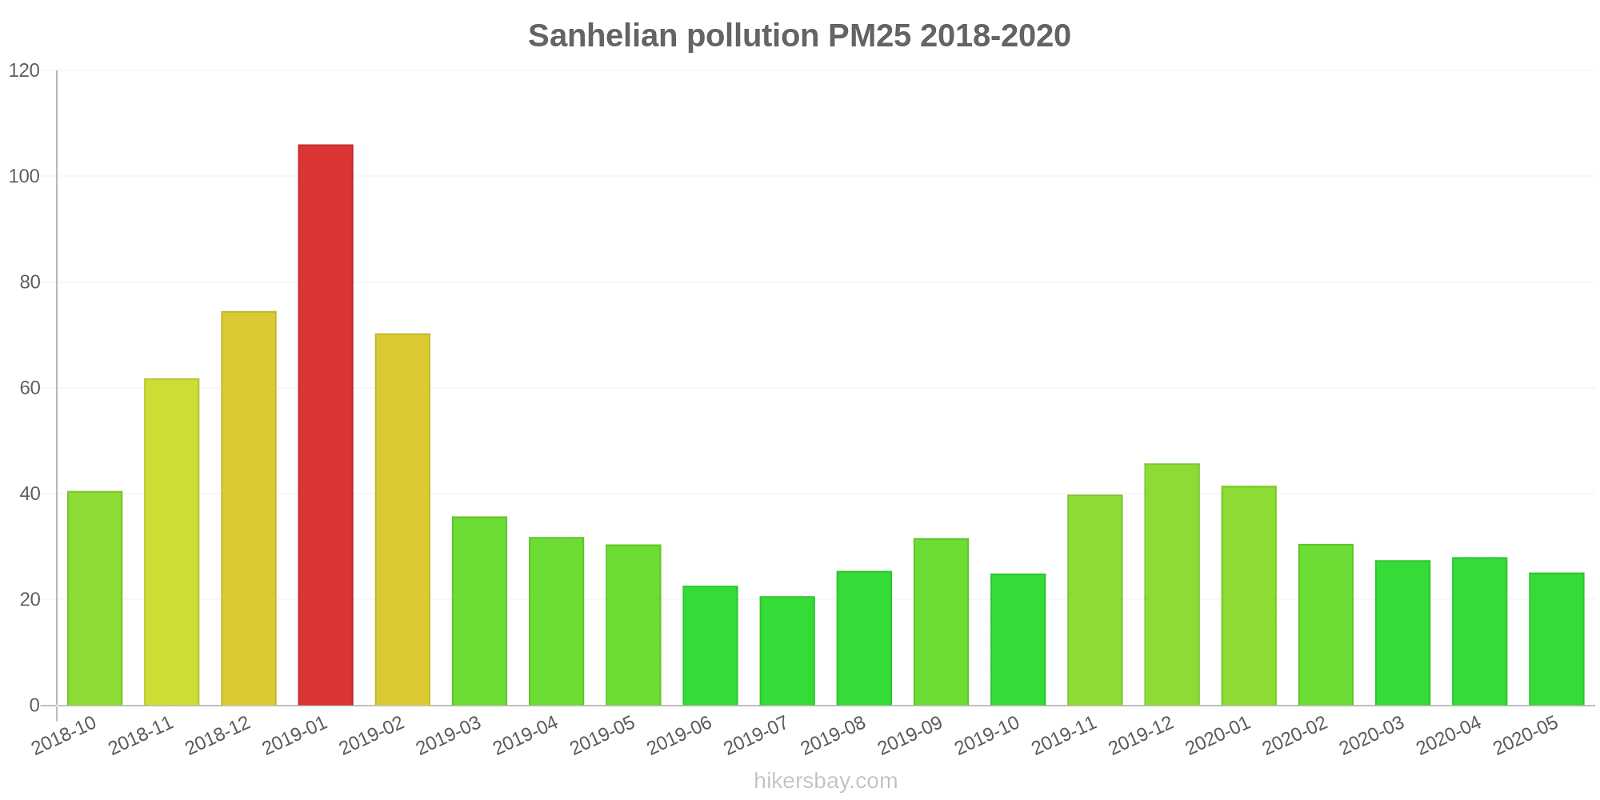
The highest PM2.5 values were recorded: 106 (January 2019).
The lowest level of particulate matter PM2.5 pollution occurs in month: July (21).
How is the O3 level today in Sanhelian? (ozone (O3))
0 (Good)
How high is the level of NO2? (nitrogen dioxide (NO2))
0 (Good)
What is the level of SO2 pollution? (sulfur dioxide (SO2))
0 (Good)
Current data Friday, May 27, 2022, 12:00 PM
PM10 179 (Very bad Hazardous)
PM2,5 35 (Unhealthy for Sensitive Groups)
O3 0 (Good)
NO2 0 (Good)
SO2 0 (Good)
Data on air pollution from recent days in Sanhelian
index
2022-05-27
pm10
56
Unhealthy for Sensitive Groups
pm25
56
Unhealthy
o3
0
Good
no2
0
Good
so2
0
Good
data source »
Air pollution in Sanhelian from October 2018 to May 2020
index
2020-05
2020-04
2020-03
2020-02
2020-01
2019-12
2019-11
2019-10
2019-09
2019-08
2019-07
2019-06
2019-05
2019-04
2019-03
2019-02
2019-01
2018-12
2018-11
2018-10
o3
118 (Moderate)
134 (Unhealthy for Sensitive Groups)
101 (Moderate)
87 (Moderate)
66 (Good)
72 (Moderate)
103 (Moderate)
123 (Unhealthy for Sensitive Groups)
181 (Very Unhealthy)
171 (Unhealthy)
144 (Unhealthy for Sensitive Groups)
158 (Unhealthy)
146 (Unhealthy for Sensitive Groups)
134 (Unhealthy for Sensitive Groups)
112 (Moderate)
69 (Good)
72 (Moderate)
64 (Good)
109 (Moderate)
135 (Unhealthy for Sensitive Groups)
pm25
25 (Moderate)
28 (Moderate)
27 (Moderate)
31 (Moderate)
42 (Unhealthy for Sensitive Groups)
46 (Unhealthy for Sensitive Groups)
40 (Unhealthy for Sensitive Groups)
25 (Moderate)
32 (Moderate)
25 (Moderate)
21 (Moderate)
23 (Moderate)
30 (Moderate)
32 (Moderate)
36 (Unhealthy for Sensitive Groups)
70 (Unhealthy)
106 (Very Unhealthy)
75 (Unhealthy)
62 (Unhealthy)
41 (Unhealthy for Sensitive Groups)
co
639 (Good)
678 (Good)
855 (Good)
794 (Good)
956 (Good)
943 (Good)
899 (Good)
808 (Good)
952 (Good)
988 (Good)
774 (Good)
869 (Good)
797 (Good)
814 (Good)
663 (Good)
1 (Good)
1 (Good)
929 (Good)
924 (Good)
737 (Good)
no2
12 (Good)
18 (Good)
12 (Good)
8 (Good)
20 (Good)
44 (Moderate)
28 (Good)
17 (Good)
18 (Good)
13 (Good)
12 (Good)
14 (Good)
17 (Good)
18 (Good)
25 (Good)
23 (Good)
30 (Good)
26 (Good)
29 (Good)
28 (Good)
pm10
44 (Moderate)
50 (Unhealthy for Sensitive Groups)
27 (Moderate)
48 (Moderate)
67 (Unhealthy for Sensitive Groups)
80 (Unhealthy)
79 (Unhealthy for Sensitive Groups)
50 (Moderate)
55 (Unhealthy for Sensitive Groups)
46 (Moderate)
33 (Moderate)
40 (Moderate)
65 (Unhealthy for Sensitive Groups)
55 (Unhealthy for Sensitive Groups)
63 (Unhealthy for Sensitive Groups)
79 (Unhealthy for Sensitive Groups)
99 (Unhealthy)
93 (Unhealthy)
71 (Unhealthy for Sensitive Groups)
62 (Unhealthy for Sensitive Groups)
so2
9.2 (Good)
9.3 (Good)
7.5 (Good)
6.7 (Good)
6.7 (Good)
10 (Good)
11 (Good)
9.1 (Good)
12 (Good)
9.4 (Good)
7.1 (Good)
5.5 (Good)
6.7 (Good)
7 (Good)
7.7 (Good)
5.2 (Good)
6 (Good)
6.2 (Good)
6 (Good)
5.9 (Good)
data source »
沉湖七壕
Friday, May 27, 2022, 12:00 PM
PM10 179 (Very bad Hazardous)
particulate matter (PM10) suspended dust
PM2,5 35 (Unhealthy for Sensitive Groups)
particulate matter (PM2.5) dust
O3 0.04 (Good)
ozone (O3)
NO2 0 (Good)
nitrogen dioxide (NO2)
SO2 0 (Good)
sulfur dioxide (SO2)
沉湖七壕
index
2022-05-27
pm10
56
pm25
56
o3
0.03
no2
0
so2
0
沉湖七壕
2018-10 2020-05
index
2020-05
2020-04
2020-03
2020-02
2020-01
2019-12
2019-11
2019-10
2019-09
2019-08
2019-07
2019-06
2019-05
2019-04
2019-03
2019-02
2019-01
2018-12
2018-11
2018-10
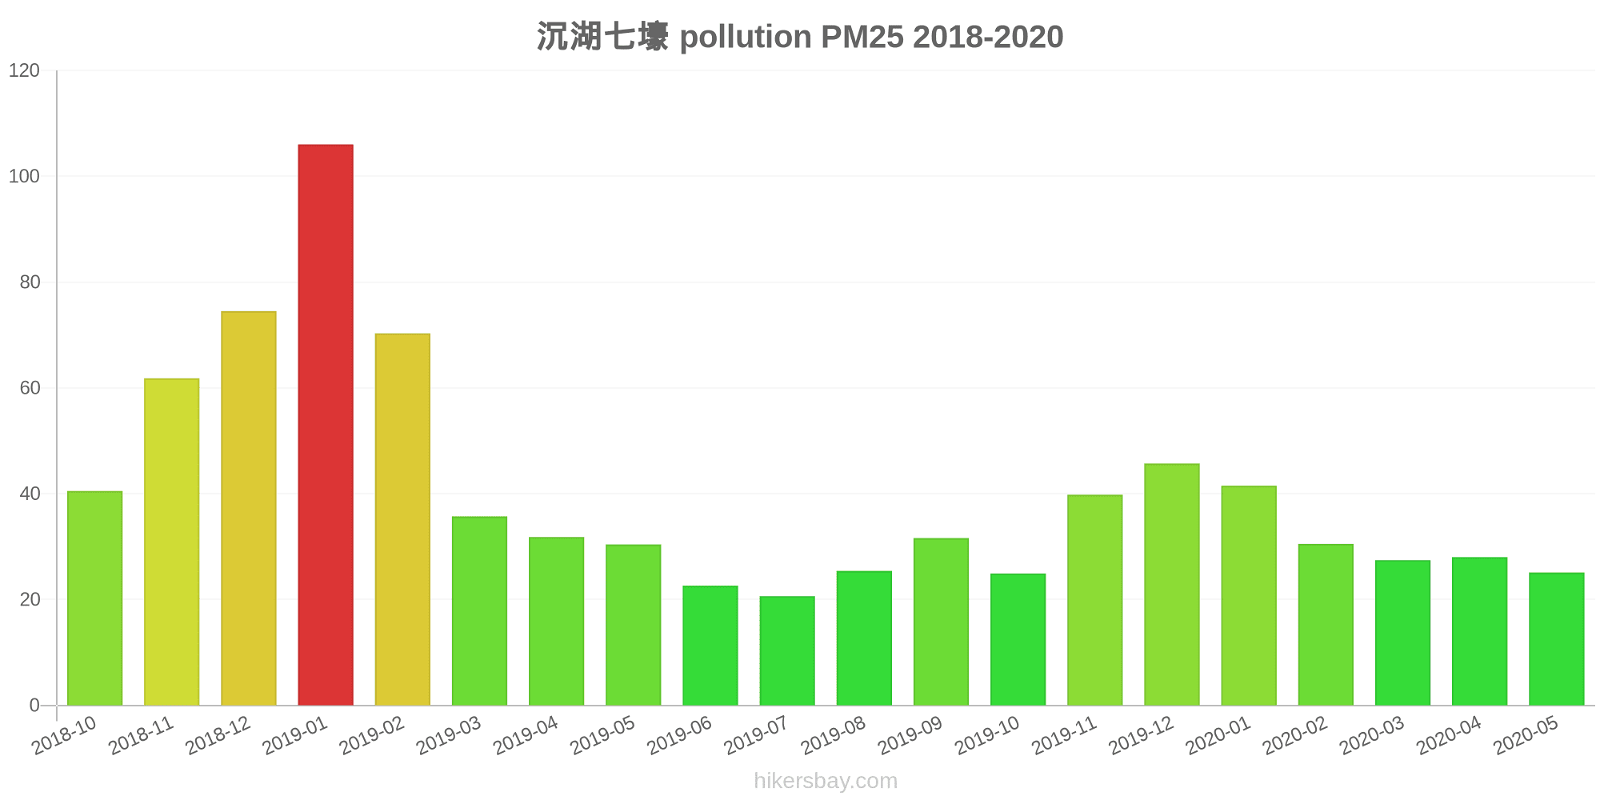
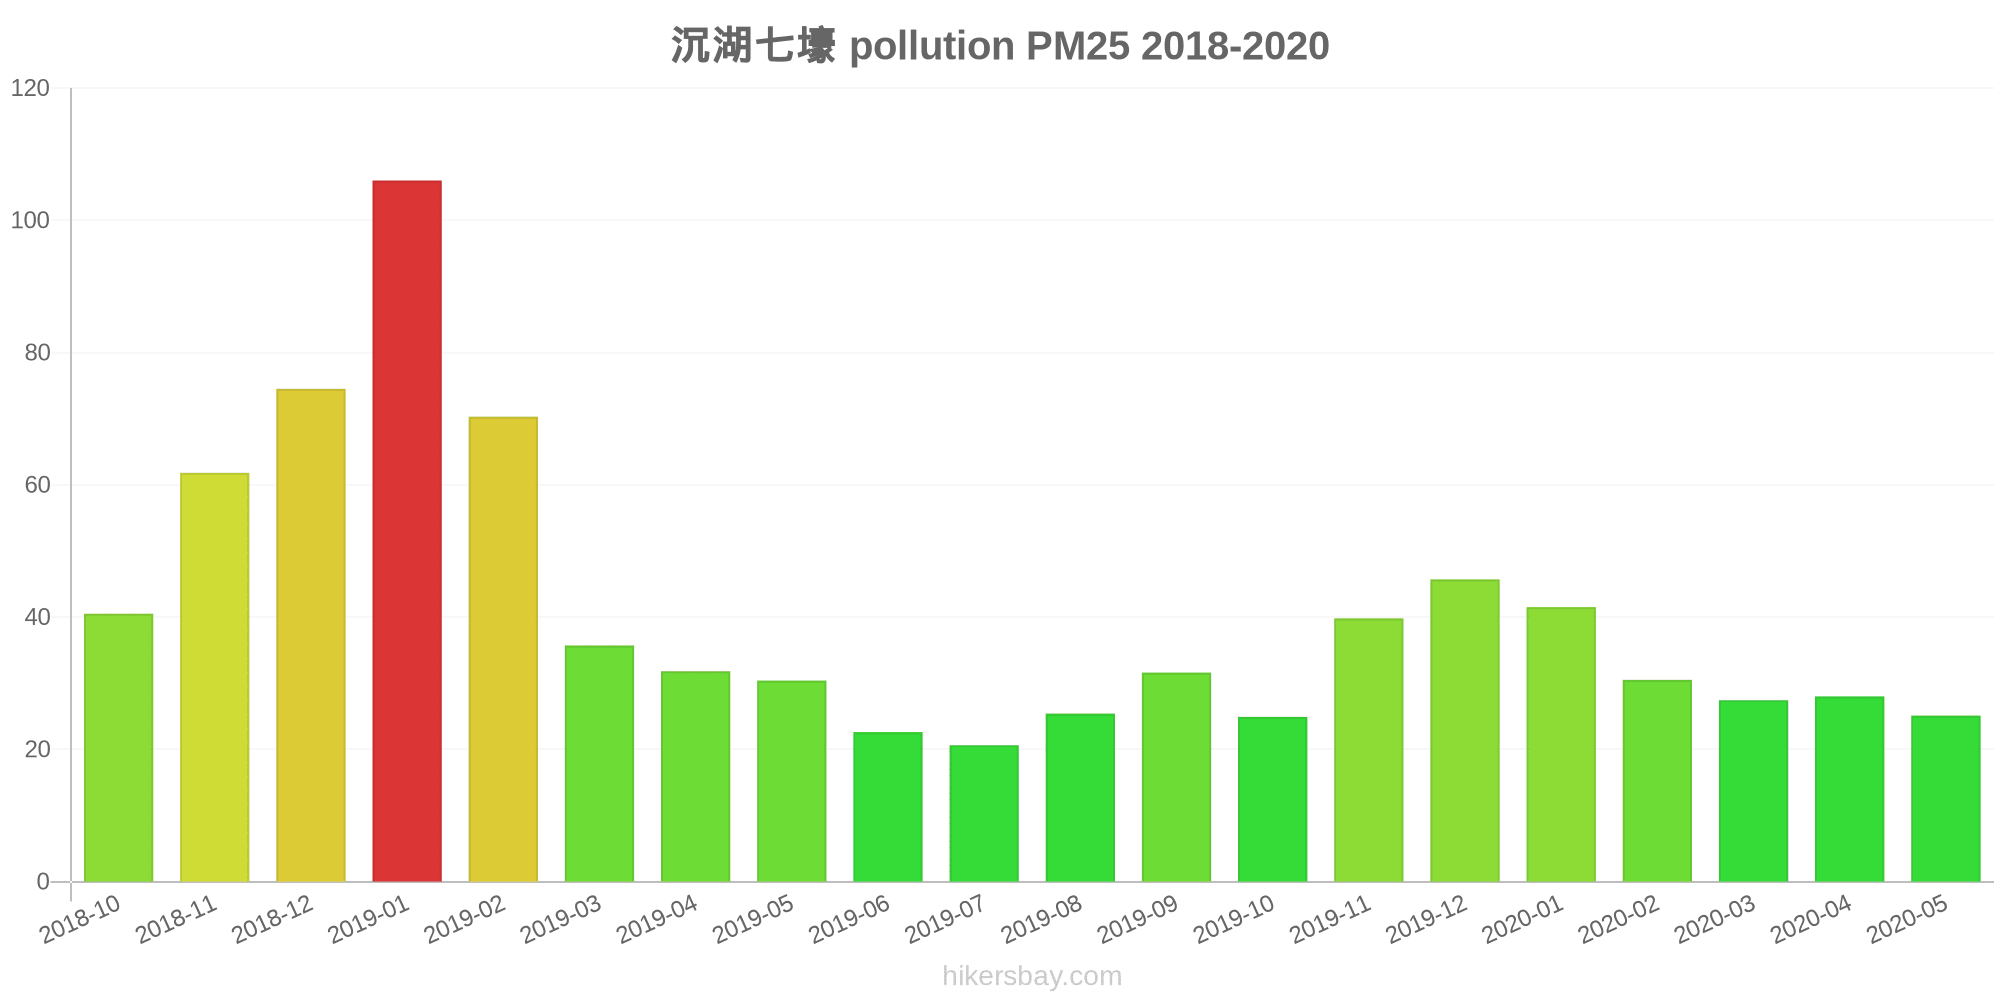
pm25
25
28
27
31
42
46
40
25
32
25
21
23
30
32
36
70
106
75
62
41
co
639
678
855
794
956
943
899
808
952
988
774
869
797
814
663
1
1
929
924
737
no2
12
18
12
8
20
44
28
17
18
13
12
14
17
18
25
23
30
26
29
28
o3
118
134
101
87
66
72
103
123
181
171
144
158
146
134
112
69
72
64
109
135
pm10
44
50
27
48
67
80
79
50
55
46
33
40
65
55
63
79
99
93
71
62
so2
9.2
9.3
7.5
6.7
6.7
10
11
9.1
12
9.4
7.1
5.5
6.7
7
7.7
5.2
6
6.2
6
5.9
* Pollution data source:
https://openaq.org
(ChinaAQIData)
The data is licensed under CC-By 4.0
PM10 179 (Very bad Hazardous)
PM2,5 35 (Unhealthy for Sensitive Groups)
O3 0 (Good)
NO2 0 (Good)
SO2 0 (Good)
Data on air pollution from recent days in Sanhelian
| index | 2022-05-27 |
|---|---|
| pm10 | 56 Unhealthy for Sensitive Groups |
| pm25 | 56 Unhealthy |
| o3 | 0 Good |
| no2 | 0 Good |
| so2 | 0 Good |

| index | 2020-05 | 2020-04 | 2020-03 | 2020-02 | 2020-01 | 2019-12 | 2019-11 | 2019-10 | 2019-09 | 2019-08 | 2019-07 | 2019-06 | 2019-05 | 2019-04 | 2019-03 | 2019-02 | 2019-01 | 2018-12 | 2018-11 | 2018-10 |
|---|---|---|---|---|---|---|---|---|---|---|---|---|---|---|---|---|---|---|---|---|
| o3 | 118 (Moderate) | 134 (Unhealthy for Sensitive Groups) | 101 (Moderate) | 87 (Moderate) | 66 (Good) | 72 (Moderate) | 103 (Moderate) | 123 (Unhealthy for Sensitive Groups) | 181 (Very Unhealthy) | 171 (Unhealthy) | 144 (Unhealthy for Sensitive Groups) | 158 (Unhealthy) | 146 (Unhealthy for Sensitive Groups) | 134 (Unhealthy for Sensitive Groups) | 112 (Moderate) | 69 (Good) | 72 (Moderate) | 64 (Good) | 109 (Moderate) | 135 (Unhealthy for Sensitive Groups) |
| pm25 | 25 (Moderate) | 28 (Moderate) | 27 (Moderate) | 31 (Moderate) | 42 (Unhealthy for Sensitive Groups) | 46 (Unhealthy for Sensitive Groups) | 40 (Unhealthy for Sensitive Groups) | 25 (Moderate) | 32 (Moderate) | 25 (Moderate) | 21 (Moderate) | 23 (Moderate) | 30 (Moderate) | 32 (Moderate) | 36 (Unhealthy for Sensitive Groups) | 70 (Unhealthy) | 106 (Very Unhealthy) | 75 (Unhealthy) | 62 (Unhealthy) | 41 (Unhealthy for Sensitive Groups) |
| co | 639 (Good) | 678 (Good) | 855 (Good) | 794 (Good) | 956 (Good) | 943 (Good) | 899 (Good) | 808 (Good) | 952 (Good) | 988 (Good) | 774 (Good) | 869 (Good) | 797 (Good) | 814 (Good) | 663 (Good) | 1 (Good) | 1 (Good) | 929 (Good) | 924 (Good) | 737 (Good) |
| no2 | 12 (Good) | 18 (Good) | 12 (Good) | 8 (Good) | 20 (Good) | 44 (Moderate) | 28 (Good) | 17 (Good) | 18 (Good) | 13 (Good) | 12 (Good) | 14 (Good) | 17 (Good) | 18 (Good) | 25 (Good) | 23 (Good) | 30 (Good) | 26 (Good) | 29 (Good) | 28 (Good) |
| pm10 | 44 (Moderate) | 50 (Unhealthy for Sensitive Groups) | 27 (Moderate) | 48 (Moderate) | 67 (Unhealthy for Sensitive Groups) | 80 (Unhealthy) | 79 (Unhealthy for Sensitive Groups) | 50 (Moderate) | 55 (Unhealthy for Sensitive Groups) | 46 (Moderate) | 33 (Moderate) | 40 (Moderate) | 65 (Unhealthy for Sensitive Groups) | 55 (Unhealthy for Sensitive Groups) | 63 (Unhealthy for Sensitive Groups) | 79 (Unhealthy for Sensitive Groups) | 99 (Unhealthy) | 93 (Unhealthy) | 71 (Unhealthy for Sensitive Groups) | 62 (Unhealthy for Sensitive Groups) |
| so2 | 9.2 (Good) | 9.3 (Good) | 7.5 (Good) | 6.7 (Good) | 6.7 (Good) | 10 (Good) | 11 (Good) | 9.1 (Good) | 12 (Good) | 9.4 (Good) | 7.1 (Good) | 5.5 (Good) | 6.7 (Good) | 7 (Good) | 7.7 (Good) | 5.2 (Good) | 6 (Good) | 6.2 (Good) | 6 (Good) | 5.9 (Good) |
PM10 179 (Very bad Hazardous)
particulate matter (PM10) suspended dustPM2,5 35 (Unhealthy for Sensitive Groups)
particulate matter (PM2.5) dustO3 0.04 (Good)
ozone (O3)NO2 0 (Good)
nitrogen dioxide (NO2)SO2 0 (Good)
sulfur dioxide (SO2)沉湖七壕
| index | 2022-05-27 |
|---|---|
| pm10 | 56 |
| pm25 | 56 |
| o3 | 0.03 |
| no2 | 0 |
| so2 | 0 |
沉湖七壕
| index | 2020-05 | 2020-04 | 2020-03 | 2020-02 | 2020-01 | 2019-12 | 2019-11 | 2019-10 | 2019-09 | 2019-08 | 2019-07 | 2019-06 | 2019-05 | 2019-04 | 2019-03 | 2019-02 | 2019-01 | 2018-12 | 2018-11 | 2018-10 |
|---|---|---|---|---|---|---|---|---|---|---|---|---|---|---|---|---|---|---|---|---|
| pm25 | 25 | 28 | 27 | 31 | 42 | 46 | 40 | 25 | 32 | 25 | 21 | 23 | 30 | 32 | 36 | 70 | 106 | 75 | 62 | 41 |
| co | 639 | 678 | 855 | 794 | 956 | 943 | 899 | 808 | 952 | 988 | 774 | 869 | 797 | 814 | 663 | 1 | 1 | 929 | 924 | 737 |
| no2 | 12 | 18 | 12 | 8 | 20 | 44 | 28 | 17 | 18 | 13 | 12 | 14 | 17 | 18 | 25 | 23 | 30 | 26 | 29 | 28 |
| o3 | 118 | 134 | 101 | 87 | 66 | 72 | 103 | 123 | 181 | 171 | 144 | 158 | 146 | 134 | 112 | 69 | 72 | 64 | 109 | 135 |
| pm10 | 44 | 50 | 27 | 48 | 67 | 80 | 79 | 50 | 55 | 46 | 33 | 40 | 65 | 55 | 63 | 79 | 99 | 93 | 71 | 62 |
| so2 | 9.2 | 9.3 | 7.5 | 6.7 | 6.7 | 10 | 11 | 9.1 | 12 | 9.4 | 7.1 | 5.5 | 6.7 | 7 | 7.7 | 5.2 | 6 | 6.2 | 6 | 5.9 |