Air Pollution in Pingdi: Real-time Air Quality Index and smog alert.
Pollution and air quality forecast for Pingdi. Today is Tuesday, June 2, 2026. The following air pollution values have been recorded for Pingdi:- particulate matter (PM10) suspended dust - 179 (Very bad Hazardous)
- particulate matter (PM2.5) dust - 35 (Unhealthy for Sensitive Groups)
- ozone (O3) - 0 (Good)
- nitrogen dioxide (NO2) - 0 (Good)
- sulfur dioxide (SO2) - 0 (Good)

What is the air quality in Pingdi today? Is the air polluted in Pingdi?. Is there smog?
What is the level of PM10 today in Pingdi? (particulate matter (PM10) suspended dust)
The current level of particulate matter PM10 in Pingdi is:
179 (Very bad Hazardous)
The highest PM10 values usually occur in month: 107 (January 2019).
The lowest value of particulate matter PM10 pollution in Pingdi is usually recorded in: July (26).
What is the current level of PM2.5 in Pingdi? (particulate matter (PM2.5) dust)
Today's PM2.5 level is:
35 (Unhealthy for Sensitive Groups)
For comparison, the highest level of PM2.5 in Pingdi in the last 7 days was: 56 (Friday, May 27, 2022) and the lowest: 56 (Friday, May 27, 2022).
The highest PM2.5 values were recorded: 75 (January 2019).
The lowest level of particulate matter PM2.5 pollution occurs in month: June (15).
How is the O3 level today in Pingdi? (ozone (O3))
0 (Good)
How high is the level of NO2? (nitrogen dioxide (NO2))
0 (Good)
What is the level of SO2 pollution? (sulfur dioxide (SO2))
0 (Good)
Current data Friday, May 27, 2022, 12:00 PM
PM10 179 (Very bad Hazardous)
PM2,5 35 (Unhealthy for Sensitive Groups)
O3 0 (Good)
NO2 0 (Good)
SO2 0 (Good)
Data on air pollution from recent days in Pingdi
index
2022-05-27
pm10
56
Unhealthy for Sensitive Groups
pm25
56
Unhealthy
o3
0
Good
no2
0
Good
so2
0
Good
data source »
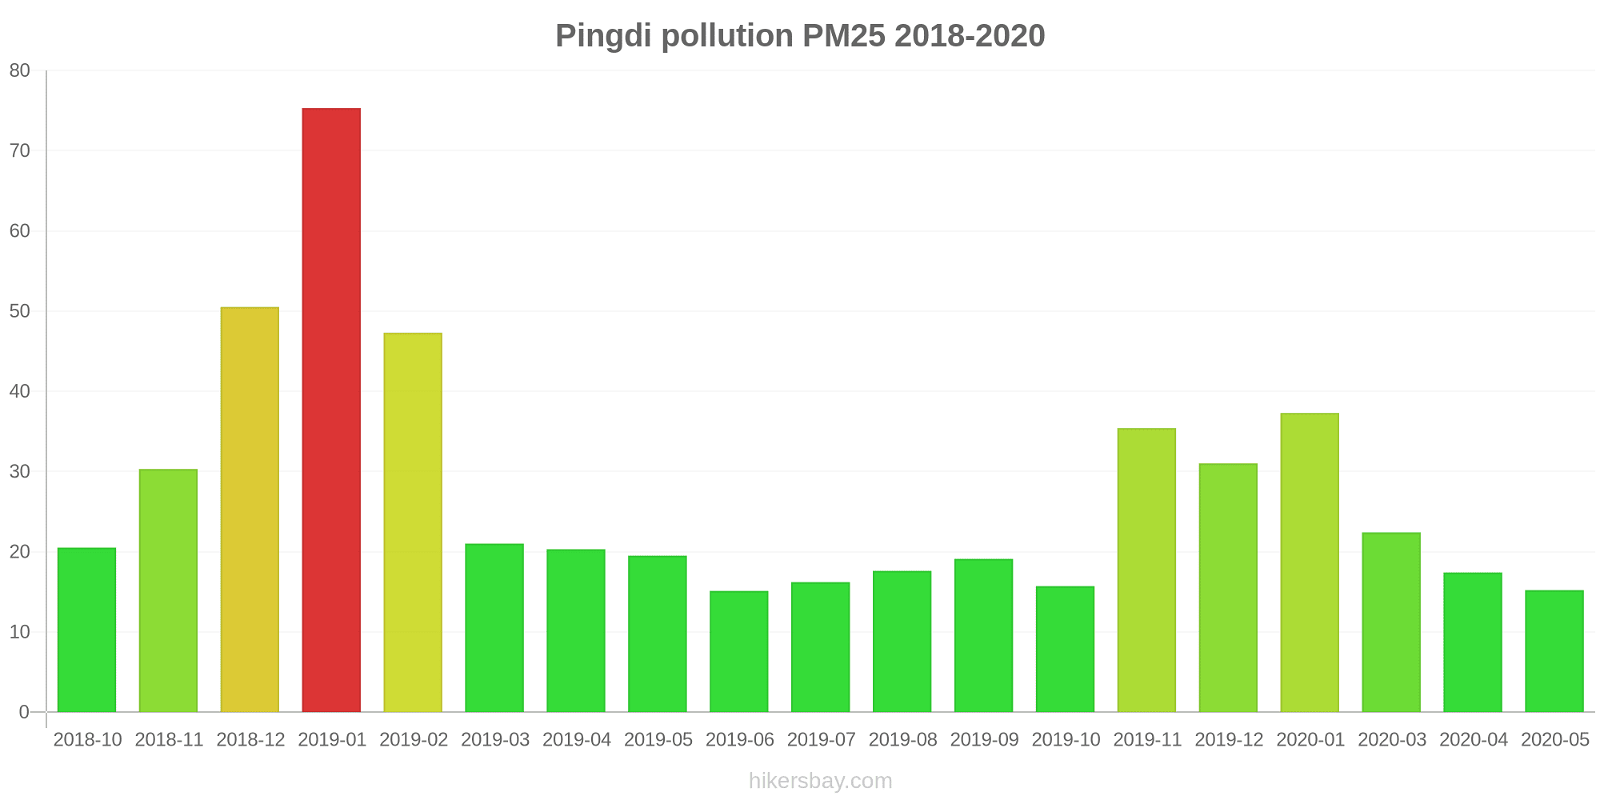
Air pollution in Pingdi from October 2018 to May 2020
index
2020-05
2020-04
2020-03
2020-01
2019-12
2019-11
2019-10
2019-09
2019-08
2019-07
2019-06
2019-05
2019-04
2019-03
2019-02
2019-01
2018-12
2018-11
2018-10
pm25
15 (Moderate)
17 (Moderate)
22 (Moderate)
37 (Unhealthy for Sensitive Groups)
31 (Moderate)
35 (Unhealthy for Sensitive Groups)
16 (Moderate)
19 (Moderate)
18 (Moderate)
16 (Moderate)
15 (Moderate)
20 (Moderate)
20 (Moderate)
21 (Moderate)
47 (Unhealthy for Sensitive Groups)
75 (Very Unhealthy)
51 (Unhealthy for Sensitive Groups)
30 (Moderate)
21 (Moderate)
co
609 (Good)
361 (Good)
312 (Good)
794 (Good)
599 (Good)
638 (Good)
650 (Good)
615 (Good)
497 (Good)
558 (Good)
525 (Good)
595 (Good)
714 (Good)
640 (Good)
886 (Good)
1 (Good)
880 (Good)
820 (Good)
651 (Good)
no2
7.7 (Good)
8.1 (Good)
4.7 (Good)
8.9 (Good)
12 (Good)
12 (Good)
6.8 (Good)
6 (Good)
8.1 (Good)
5.2 (Good)
4.3 (Good)
7.7 (Good)
7 (Good)
9.6 (Good)
7.8 (Good)
15 (Good)
19 (Good)
13 (Good)
11 (Good)
o3
127 (Unhealthy for Sensitive Groups)
117 (Moderate)
116 (Moderate)
75 (Moderate)
78 (Moderate)
89 (Moderate)
92 (Moderate)
116 (Moderate)
108 (Moderate)
135 (Unhealthy for Sensitive Groups)
145 (Unhealthy for Sensitive Groups)
130 (Unhealthy for Sensitive Groups)
123 (Unhealthy for Sensitive Groups)
116 (Moderate)
95 (Moderate)
81 (Moderate)
67 (Good)
94 (Moderate)
109 (Moderate)
pm10
32 (Moderate)
38 (Moderate)
- (Good)
50 (Unhealthy for Sensitive Groups)
46 (Moderate)
55 (Unhealthy for Sensitive Groups)
31 (Moderate)
37 (Moderate)
32 (Moderate)
26 (Moderate)
27 (Moderate)
40 (Moderate)
37 (Moderate)
47 (Moderate)
69 (Unhealthy for Sensitive Groups)
107 (Unhealthy)
100 (Unhealthy)
79 (Unhealthy for Sensitive Groups)
64 (Unhealthy for Sensitive Groups)
so2
6.9 (Good)
5.9 (Good)
7.2 (Good)
5.6 (Good)
5.3 (Good)
5.9 (Good)
5 (Good)
6.2 (Good)
7.3 (Good)
7.7 (Good)
6.9 (Good)
6.5 (Good)
8.4 (Good)
8.3 (Good)
7.9 (Good)
11 (Good)
9.7 (Good)
10 (Good)
8.9 (Good)
data source »
武当山
Friday, May 27, 2022, 12:00 PM
PM10 179 (Very bad Hazardous)
particulate matter (PM10) suspended dust
PM2,5 35 (Unhealthy for Sensitive Groups)
particulate matter (PM2.5) dust
O3 0.04 (Good)
ozone (O3)
NO2 0 (Good)
nitrogen dioxide (NO2)
SO2 0 (Good)
sulfur dioxide (SO2)
武当山
index
2022-05-27
pm10
56
pm25
56
o3
0.03
no2
0
so2
0
武当山
2018-10 2020-05

index
2020-05
2020-04
2020-03
2020-01
2019-12
2019-11
2019-10
2019-09
2019-08
2019-07
2019-06
2019-05
2019-04
2019-03
2019-02
2019-01
2018-12
2018-11
2018-10
pm25
15
17
22
37
31
35
16
19
18
16
15
20
20
21
47
75
51
30
21
co
609
361
312
794
599
638
650
615
497
558
525
595
714
640
886
1
880
820
651
no2
7.7
8.1
4.7
8.9
12
12
6.8
6
8.1
5.2
4.3
7.7
7
9.6
7.8
15
19
13
11
o3
127
117
116
75
78
89
92
116
108
135
145
130
123
116
95
81
67
94
109
pm10
32
38
-
50
46
55
31
37
32
26
27
40
37
47
69
107
100
79
64
so2
6.9
5.9
7.2
5.6
5.3
5.9
5
6.2
7.3
7.7
6.9
6.5
8.4
8.3
7.9
11
9.7
10
8.9
* Pollution data source:
https://openaq.org
(ChinaAQIData)
The data is licensed under CC-By 4.0
PM10 179 (Very bad Hazardous)
PM2,5 35 (Unhealthy for Sensitive Groups)
O3 0 (Good)
NO2 0 (Good)
SO2 0 (Good)
Data on air pollution from recent days in Pingdi
| index | 2022-05-27 |
|---|---|
| pm10 | 56 Unhealthy for Sensitive Groups |
| pm25 | 56 Unhealthy |
| o3 | 0 Good |
| no2 | 0 Good |
| so2 | 0 Good |

| index | 2020-05 | 2020-04 | 2020-03 | 2020-01 | 2019-12 | 2019-11 | 2019-10 | 2019-09 | 2019-08 | 2019-07 | 2019-06 | 2019-05 | 2019-04 | 2019-03 | 2019-02 | 2019-01 | 2018-12 | 2018-11 | 2018-10 |
|---|---|---|---|---|---|---|---|---|---|---|---|---|---|---|---|---|---|---|---|
| pm25 | 15 (Moderate) | 17 (Moderate) | 22 (Moderate) | 37 (Unhealthy for Sensitive Groups) | 31 (Moderate) | 35 (Unhealthy for Sensitive Groups) | 16 (Moderate) | 19 (Moderate) | 18 (Moderate) | 16 (Moderate) | 15 (Moderate) | 20 (Moderate) | 20 (Moderate) | 21 (Moderate) | 47 (Unhealthy for Sensitive Groups) | 75 (Very Unhealthy) | 51 (Unhealthy for Sensitive Groups) | 30 (Moderate) | 21 (Moderate) |
| co | 609 (Good) | 361 (Good) | 312 (Good) | 794 (Good) | 599 (Good) | 638 (Good) | 650 (Good) | 615 (Good) | 497 (Good) | 558 (Good) | 525 (Good) | 595 (Good) | 714 (Good) | 640 (Good) | 886 (Good) | 1 (Good) | 880 (Good) | 820 (Good) | 651 (Good) |
| no2 | 7.7 (Good) | 8.1 (Good) | 4.7 (Good) | 8.9 (Good) | 12 (Good) | 12 (Good) | 6.8 (Good) | 6 (Good) | 8.1 (Good) | 5.2 (Good) | 4.3 (Good) | 7.7 (Good) | 7 (Good) | 9.6 (Good) | 7.8 (Good) | 15 (Good) | 19 (Good) | 13 (Good) | 11 (Good) |
| o3 | 127 (Unhealthy for Sensitive Groups) | 117 (Moderate) | 116 (Moderate) | 75 (Moderate) | 78 (Moderate) | 89 (Moderate) | 92 (Moderate) | 116 (Moderate) | 108 (Moderate) | 135 (Unhealthy for Sensitive Groups) | 145 (Unhealthy for Sensitive Groups) | 130 (Unhealthy for Sensitive Groups) | 123 (Unhealthy for Sensitive Groups) | 116 (Moderate) | 95 (Moderate) | 81 (Moderate) | 67 (Good) | 94 (Moderate) | 109 (Moderate) |
| pm10 | 32 (Moderate) | 38 (Moderate) | - (Good) | 50 (Unhealthy for Sensitive Groups) | 46 (Moderate) | 55 (Unhealthy for Sensitive Groups) | 31 (Moderate) | 37 (Moderate) | 32 (Moderate) | 26 (Moderate) | 27 (Moderate) | 40 (Moderate) | 37 (Moderate) | 47 (Moderate) | 69 (Unhealthy for Sensitive Groups) | 107 (Unhealthy) | 100 (Unhealthy) | 79 (Unhealthy for Sensitive Groups) | 64 (Unhealthy for Sensitive Groups) |
| so2 | 6.9 (Good) | 5.9 (Good) | 7.2 (Good) | 5.6 (Good) | 5.3 (Good) | 5.9 (Good) | 5 (Good) | 6.2 (Good) | 7.3 (Good) | 7.7 (Good) | 6.9 (Good) | 6.5 (Good) | 8.4 (Good) | 8.3 (Good) | 7.9 (Good) | 11 (Good) | 9.7 (Good) | 10 (Good) | 8.9 (Good) |
PM10 179 (Very bad Hazardous)
particulate matter (PM10) suspended dustPM2,5 35 (Unhealthy for Sensitive Groups)
particulate matter (PM2.5) dustO3 0.04 (Good)
ozone (O3)NO2 0 (Good)
nitrogen dioxide (NO2)SO2 0 (Good)
sulfur dioxide (SO2)武当山
| index | 2022-05-27 |
|---|---|
| pm10 | 56 |
| pm25 | 56 |
| o3 | 0.03 |
| no2 | 0 |
| so2 | 0 |
武当山

| index | 2020-05 | 2020-04 | 2020-03 | 2020-01 | 2019-12 | 2019-11 | 2019-10 | 2019-09 | 2019-08 | 2019-07 | 2019-06 | 2019-05 | 2019-04 | 2019-03 | 2019-02 | 2019-01 | 2018-12 | 2018-11 | 2018-10 |
|---|---|---|---|---|---|---|---|---|---|---|---|---|---|---|---|---|---|---|---|
| pm25 | 15 | 17 | 22 | 37 | 31 | 35 | 16 | 19 | 18 | 16 | 15 | 20 | 20 | 21 | 47 | 75 | 51 | 30 | 21 |
| co | 609 | 361 | 312 | 794 | 599 | 638 | 650 | 615 | 497 | 558 | 525 | 595 | 714 | 640 | 886 | 1 | 880 | 820 | 651 |
| no2 | 7.7 | 8.1 | 4.7 | 8.9 | 12 | 12 | 6.8 | 6 | 8.1 | 5.2 | 4.3 | 7.7 | 7 | 9.6 | 7.8 | 15 | 19 | 13 | 11 |
| o3 | 127 | 117 | 116 | 75 | 78 | 89 | 92 | 116 | 108 | 135 | 145 | 130 | 123 | 116 | 95 | 81 | 67 | 94 | 109 |
| pm10 | 32 | 38 | - | 50 | 46 | 55 | 31 | 37 | 32 | 26 | 27 | 40 | 37 | 47 | 69 | 107 | 100 | 79 | 64 |
| so2 | 6.9 | 5.9 | 7.2 | 5.6 | 5.3 | 5.9 | 5 | 6.2 | 7.3 | 7.7 | 6.9 | 6.5 | 8.4 | 8.3 | 7.9 | 11 | 9.7 | 10 | 8.9 |