Air Pollution in Shengli: Real-time Air Quality Index and smog alert.
Pollution and air quality forecast for Shengli. Today is Tuesday, June 16, 2026. The following air pollution values have been recorded for Shengli:- particulate matter (PM10) suspended dust - 7 (Good)
- particulate matter (PM2.5) dust - 2 (Good)
- carbon monoxide (CO) - 100 (Good)
- nitrogen dioxide (NO2) - 8 (Good)
- ozone (O3) - 0 (Good)
- sulfur dioxide (SO2) - 9 (Good)

What is the air quality in Shengli today? Is the air polluted in Shengli?. Is there smog?
What is the level of PM10 today in Shengli? (particulate matter (PM10) suspended dust)
The current level of particulate matter PM10 in Shengli is:
7 (Good)
The highest PM10 values usually occur in month: 125 (December 2018).
The lowest value of particulate matter PM10 pollution in Shengli is usually recorded in: August (30).
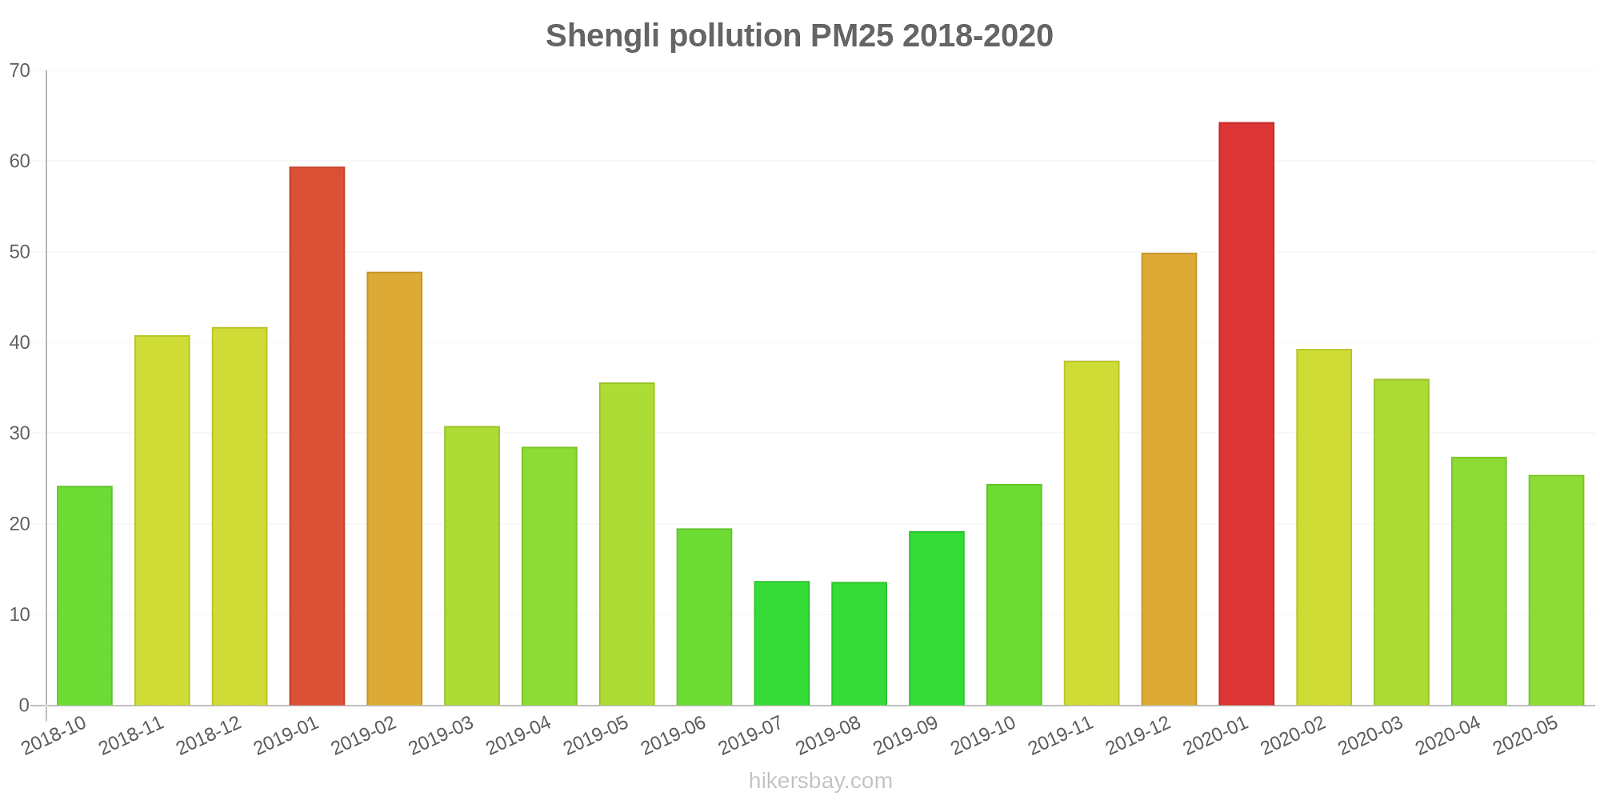
What is the current level of PM2.5 in Shengli? (particulate matter (PM2.5) dust)
Today's PM2.5 level is:
2 (Good)
For comparison, the highest level of PM2.5 in Shengli in the last 7 days was: 24 (Friday, May 27, 2022) and the lowest: 24 (Friday, May 27, 2022).
The highest PM2.5 values were recorded: 64 (January 2020).
The lowest level of particulate matter PM2.5 pollution occurs in month: August (14).
How high is the CO level? (carbon monoxide (CO))
100 (Good)
How high is the level of NO2? (nitrogen dioxide (NO2))
8 (Good)
How is the O3 level today in Shengli? (ozone (O3))
0 (Good)
What is the level of SO2 pollution? (sulfur dioxide (SO2))
9 (Good)
Current data Friday, May 27, 2022, 12:00 PM
PM10 7 (Good)
PM2,5 2 (Good)
CO 100 (Good)
NO2 8 (Good)
O3 0 (Good)
SO2 9 (Good)
Data on air pollution from recent days in Shengli
index
2022-05-27
pm10
32
Moderate
pm25
24
Moderate
co
468
Good
no2
21
Good
o3
32
Good
so2
5
Good
data source »
Air pollution in Shengli from October 2018 to May 2020
index
2020-05
2020-04
2020-03
2020-02
2020-01
2019-12
2019-11
2019-10
2019-09
2019-08
2019-07
2019-06
2019-05
2019-04
2019-03
2019-02
2019-01
2018-12
2018-11
2018-10
pm25
25 (Moderate)
27 (Moderate)
36 (Unhealthy for Sensitive Groups)
39 (Unhealthy for Sensitive Groups)
64 (Unhealthy)
50 (Unhealthy for Sensitive Groups)
38 (Unhealthy for Sensitive Groups)
24 (Moderate)
19 (Moderate)
14 (Moderate)
14 (Moderate)
20 (Moderate)
36 (Unhealthy for Sensitive Groups)
29 (Moderate)
31 (Moderate)
48 (Unhealthy for Sensitive Groups)
59 (Unhealthy)
42 (Unhealthy for Sensitive Groups)
41 (Unhealthy for Sensitive Groups)
24 (Moderate)
co
773 (Good)
703 (Good)
640 (Good)
852 (Good)
1 (Good)
950 (Good)
740 (Good)
747 (Good)
690 (Good)
724 (Good)
634 (Good)
545 (Good)
509 (Good)
518 (Good)
460 (Good)
763 (Good)
883 (Good)
654 (Good)
565 (Good)
508 (Good)
no2
8.8 (Good)
9.9 (Good)
9.6 (Good)
8.4 (Good)
14 (Good)
19 (Good)
19 (Good)
15 (Good)
10 (Good)
11 (Good)
10 (Good)
7.7 (Good)
8.7 (Good)
11 (Good)
11 (Good)
14 (Good)
20 (Good)
17 (Good)
19 (Good)
15 (Good)
o3
131 (Unhealthy for Sensitive Groups)
127 (Unhealthy for Sensitive Groups)
108 (Moderate)
94 (Moderate)
87 (Moderate)
83 (Moderate)
83 (Moderate)
99 (Moderate)
125 (Unhealthy for Sensitive Groups)
119 (Moderate)
146 (Unhealthy for Sensitive Groups)
137 (Unhealthy for Sensitive Groups)
130 (Unhealthy for Sensitive Groups)
130 (Unhealthy for Sensitive Groups)
116 (Moderate)
96 (Moderate)
89 (Moderate)
74 (Moderate)
96 (Moderate)
95 (Moderate)
pm10
72 (Unhealthy for Sensitive Groups)
65 (Unhealthy for Sensitive Groups)
105 (Unhealthy)
69 (Unhealthy for Sensitive Groups)
72 (Unhealthy for Sensitive Groups)
72 (Unhealthy for Sensitive Groups)
65 (Unhealthy for Sensitive Groups)
51 (Unhealthy for Sensitive Groups)
32 (Moderate)
30 (Moderate)
38 (Moderate)
40 (Moderate)
112 (Very Unhealthy)
85 (Unhealthy)
87 (Unhealthy)
92 (Unhealthy)
96 (Unhealthy)
125 (Very Unhealthy)
113 (Very Unhealthy)
60 (Unhealthy for Sensitive Groups)
so2
7.7 (Good)
8.4 (Good)
10 (Good)
13 (Good)
16 (Good)
16 (Good)
13 (Good)
7.7 (Good)
6.8 (Good)
6.3 (Good)
5.7 (Good)
5.2 (Good)
5.1 (Good)
4.9 (Good)
7.2 (Good)
8.5 (Good)
18 (Good)
11 (Good)
12 (Good)
3.3 (Good)
data source »
区环保局
Friday, May 27, 2022, 12:00 PM
PM10 6.7 (Good)
particulate matter (PM10) suspended dust
PM2,5 1.7 (Good)
particulate matter (PM2.5) dust
CO 100 (Good)
carbon monoxide (CO)
NO2 7.6 (Good)
nitrogen dioxide (NO2)
O3 0.02 (Good)
ozone (O3)
SO2 8.6 (Good)
sulfur dioxide (SO2)
区环保局
index
2022-05-27
pm10
32
pm25
24
co
468
no2
21
o3
32
so2
4.6
区环保局
2018-10 2020-05

index
2020-05
2020-04
2020-03
2020-02
2020-01
2019-12
2019-11
2019-10
2019-09
2019-08
2019-07
2019-06
2019-05
2019-04
2019-03
2019-02
2019-01
2018-12
2018-11
2018-10
pm25
25
27
36
39
64
50
38
24
19
14
14
20
36
29
31
48
59
42
41
24
co
773
703
640
852
1
950
740
747
690
724
634
545
509
518
460
763
883
654
565
508
no2
8.8
9.9
9.6
8.4
14
19
19
15
10
11
10
7.7
8.7
11
11
14
20
17
19
15
o3
131
127
108
94
87
83
83
99
125
119
146
137
130
130
116
96
89
74
96
95
pm10
72
65
105
69
72
72
65
51
32
30
38
40
112
85
87
92
96
125
113
60
so2
7.7
8.4
10
13
16
16
13
7.7
6.8
6.3
5.7
5.2
5.1
4.9
7.2
8.5
18
11
12
3.3
* Pollution data source:
https://openaq.org
(ChinaAQIData)
The data is licensed under CC-By 4.0
PM10 7 (Good)
PM2,5 2 (Good)
CO 100 (Good)
NO2 8 (Good)
O3 0 (Good)
SO2 9 (Good)
Data on air pollution from recent days in Shengli
| index | 2022-05-27 |
|---|---|
| pm10 | 32 Moderate |
| pm25 | 24 Moderate |
| co | 468 Good |
| no2 | 21 Good |
| o3 | 32 Good |
| so2 | 5 Good |

| index | 2020-05 | 2020-04 | 2020-03 | 2020-02 | 2020-01 | 2019-12 | 2019-11 | 2019-10 | 2019-09 | 2019-08 | 2019-07 | 2019-06 | 2019-05 | 2019-04 | 2019-03 | 2019-02 | 2019-01 | 2018-12 | 2018-11 | 2018-10 |
|---|---|---|---|---|---|---|---|---|---|---|---|---|---|---|---|---|---|---|---|---|
| pm25 | 25 (Moderate) | 27 (Moderate) | 36 (Unhealthy for Sensitive Groups) | 39 (Unhealthy for Sensitive Groups) | 64 (Unhealthy) | 50 (Unhealthy for Sensitive Groups) | 38 (Unhealthy for Sensitive Groups) | 24 (Moderate) | 19 (Moderate) | 14 (Moderate) | 14 (Moderate) | 20 (Moderate) | 36 (Unhealthy for Sensitive Groups) | 29 (Moderate) | 31 (Moderate) | 48 (Unhealthy for Sensitive Groups) | 59 (Unhealthy) | 42 (Unhealthy for Sensitive Groups) | 41 (Unhealthy for Sensitive Groups) | 24 (Moderate) |
| co | 773 (Good) | 703 (Good) | 640 (Good) | 852 (Good) | 1 (Good) | 950 (Good) | 740 (Good) | 747 (Good) | 690 (Good) | 724 (Good) | 634 (Good) | 545 (Good) | 509 (Good) | 518 (Good) | 460 (Good) | 763 (Good) | 883 (Good) | 654 (Good) | 565 (Good) | 508 (Good) |
| no2 | 8.8 (Good) | 9.9 (Good) | 9.6 (Good) | 8.4 (Good) | 14 (Good) | 19 (Good) | 19 (Good) | 15 (Good) | 10 (Good) | 11 (Good) | 10 (Good) | 7.7 (Good) | 8.7 (Good) | 11 (Good) | 11 (Good) | 14 (Good) | 20 (Good) | 17 (Good) | 19 (Good) | 15 (Good) |
| o3 | 131 (Unhealthy for Sensitive Groups) | 127 (Unhealthy for Sensitive Groups) | 108 (Moderate) | 94 (Moderate) | 87 (Moderate) | 83 (Moderate) | 83 (Moderate) | 99 (Moderate) | 125 (Unhealthy for Sensitive Groups) | 119 (Moderate) | 146 (Unhealthy for Sensitive Groups) | 137 (Unhealthy for Sensitive Groups) | 130 (Unhealthy for Sensitive Groups) | 130 (Unhealthy for Sensitive Groups) | 116 (Moderate) | 96 (Moderate) | 89 (Moderate) | 74 (Moderate) | 96 (Moderate) | 95 (Moderate) |
| pm10 | 72 (Unhealthy for Sensitive Groups) | 65 (Unhealthy for Sensitive Groups) | 105 (Unhealthy) | 69 (Unhealthy for Sensitive Groups) | 72 (Unhealthy for Sensitive Groups) | 72 (Unhealthy for Sensitive Groups) | 65 (Unhealthy for Sensitive Groups) | 51 (Unhealthy for Sensitive Groups) | 32 (Moderate) | 30 (Moderate) | 38 (Moderate) | 40 (Moderate) | 112 (Very Unhealthy) | 85 (Unhealthy) | 87 (Unhealthy) | 92 (Unhealthy) | 96 (Unhealthy) | 125 (Very Unhealthy) | 113 (Very Unhealthy) | 60 (Unhealthy for Sensitive Groups) |
| so2 | 7.7 (Good) | 8.4 (Good) | 10 (Good) | 13 (Good) | 16 (Good) | 16 (Good) | 13 (Good) | 7.7 (Good) | 6.8 (Good) | 6.3 (Good) | 5.7 (Good) | 5.2 (Good) | 5.1 (Good) | 4.9 (Good) | 7.2 (Good) | 8.5 (Good) | 18 (Good) | 11 (Good) | 12 (Good) | 3.3 (Good) |
PM10 6.7 (Good)
particulate matter (PM10) suspended dustPM2,5 1.7 (Good)
particulate matter (PM2.5) dustCO 100 (Good)
carbon monoxide (CO)NO2 7.6 (Good)
nitrogen dioxide (NO2)O3 0.02 (Good)
ozone (O3)SO2 8.6 (Good)
sulfur dioxide (SO2)区环保局
| index | 2022-05-27 |
|---|---|
| pm10 | 32 |
| pm25 | 24 |
| co | 468 |
| no2 | 21 |
| o3 | 32 |
| so2 | 4.6 |
区环保局

| index | 2020-05 | 2020-04 | 2020-03 | 2020-02 | 2020-01 | 2019-12 | 2019-11 | 2019-10 | 2019-09 | 2019-08 | 2019-07 | 2019-06 | 2019-05 | 2019-04 | 2019-03 | 2019-02 | 2019-01 | 2018-12 | 2018-11 | 2018-10 |
|---|---|---|---|---|---|---|---|---|---|---|---|---|---|---|---|---|---|---|---|---|
| pm25 | 25 | 27 | 36 | 39 | 64 | 50 | 38 | 24 | 19 | 14 | 14 | 20 | 36 | 29 | 31 | 48 | 59 | 42 | 41 | 24 |
| co | 773 | 703 | 640 | 852 | 1 | 950 | 740 | 747 | 690 | 724 | 634 | 545 | 509 | 518 | 460 | 763 | 883 | 654 | 565 | 508 |
| no2 | 8.8 | 9.9 | 9.6 | 8.4 | 14 | 19 | 19 | 15 | 10 | 11 | 10 | 7.7 | 8.7 | 11 | 11 | 14 | 20 | 17 | 19 | 15 |
| o3 | 131 | 127 | 108 | 94 | 87 | 83 | 83 | 99 | 125 | 119 | 146 | 137 | 130 | 130 | 116 | 96 | 89 | 74 | 96 | 95 |
| pm10 | 72 | 65 | 105 | 69 | 72 | 72 | 65 | 51 | 32 | 30 | 38 | 40 | 112 | 85 | 87 | 92 | 96 | 125 | 113 | 60 |
| so2 | 7.7 | 8.4 | 10 | 13 | 16 | 16 | 13 | 7.7 | 6.8 | 6.3 | 5.7 | 5.2 | 5.1 | 4.9 | 7.2 | 8.5 | 18 | 11 | 12 | 3.3 |