Air Pollution in Guotang: Real-time Air Quality Index and smog alert.
Pollution and air quality forecast for Guotang. Today is Tuesday, June 2, 2026. The following air pollution values have been recorded for Guotang:- particulate matter (PM10) suspended dust - 179 (Very bad Hazardous)
- particulate matter (PM2.5) dust - 35 (Unhealthy for Sensitive Groups)
- ozone (O3) - 0 (Good)
- nitrogen dioxide (NO2) - 0 (Good)
- sulfur dioxide (SO2) - 0 (Good)

What is the air quality in Guotang today? Is the air polluted in Guotang?. Is there smog?
What is the level of PM10 today in Guotang? (particulate matter (PM10) suspended dust)
The current level of particulate matter PM10 in Guotang is:
179 (Very bad Hazardous)
The highest PM10 values usually occur in month: 103 (March 2019).
The lowest value of particulate matter PM10 pollution in Guotang is usually recorded in: August (37).
What is the current level of PM2.5 in Guotang? (particulate matter (PM2.5) dust)
Today's PM2.5 level is:
35 (Unhealthy for Sensitive Groups)
For comparison, the highest level of PM2.5 in Guotang in the last 7 days was: 56 (Friday, May 27, 2022) and the lowest: 56 (Friday, May 27, 2022).
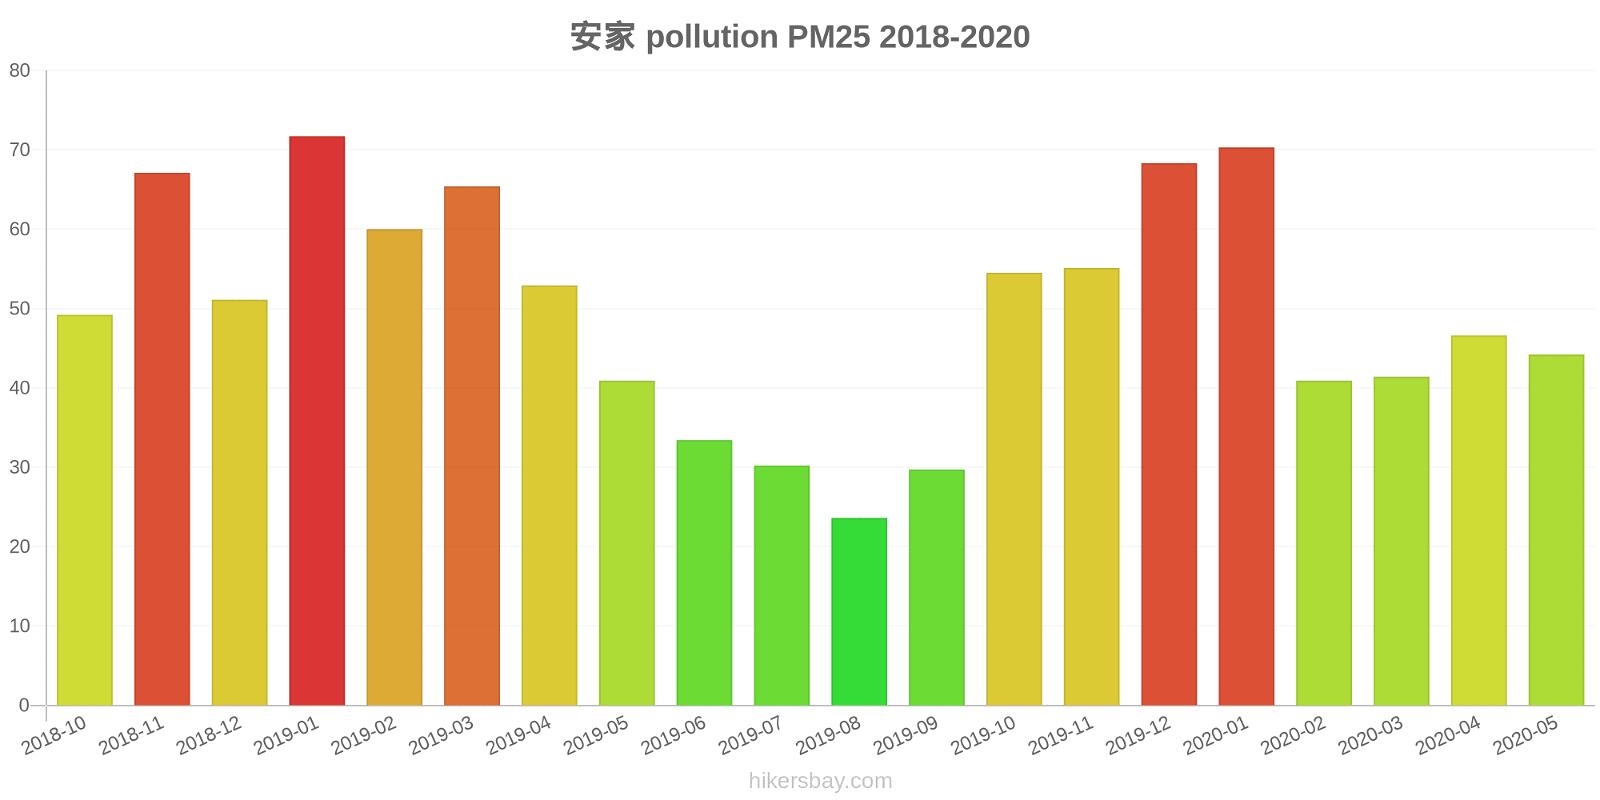
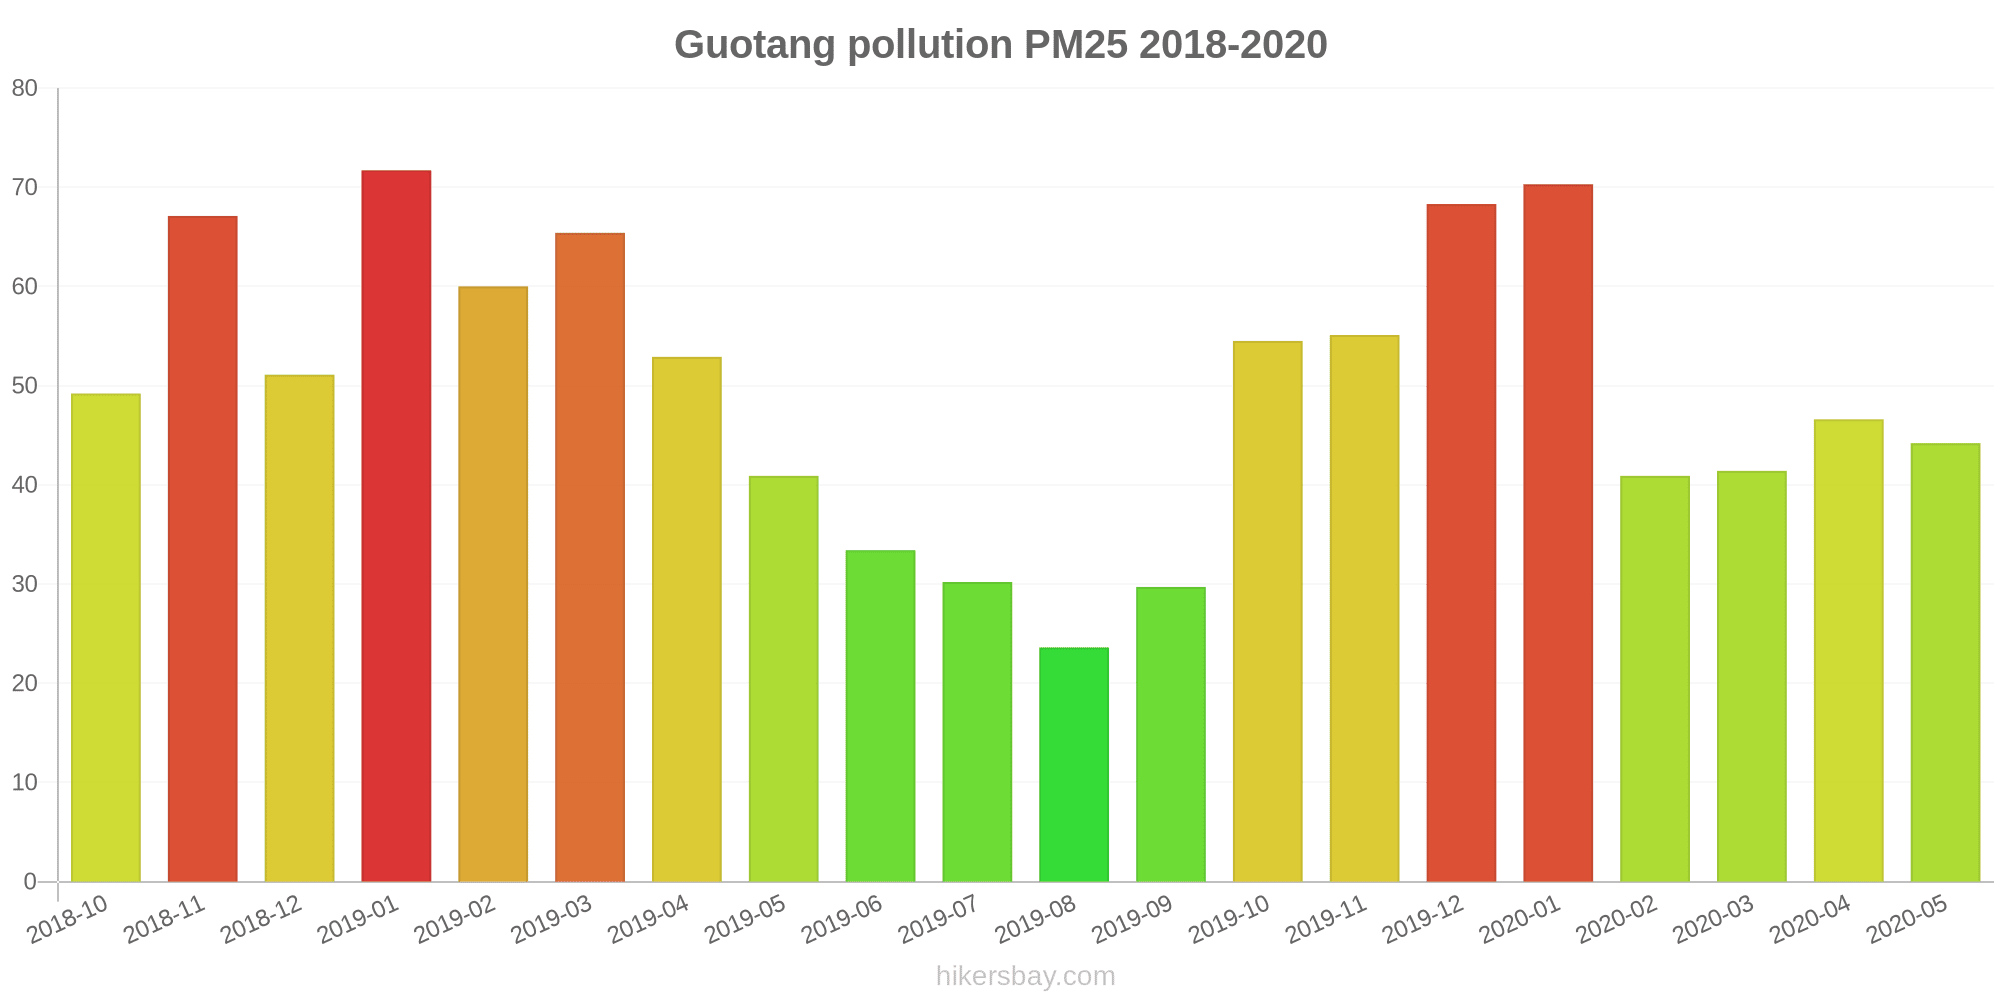
The highest PM2.5 values were recorded: 72 (January 2019).
The lowest level of particulate matter PM2.5 pollution occurs in month: August (24).
How is the O3 level today in Guotang? (ozone (O3))
0 (Good)
How high is the level of NO2? (nitrogen dioxide (NO2))
0 (Good)
What is the level of SO2 pollution? (sulfur dioxide (SO2))
0 (Good)
Current data Friday, May 27, 2022, 12:00 PM
PM10 179 (Very bad Hazardous)
PM2,5 35 (Unhealthy for Sensitive Groups)
O3 0 (Good)
NO2 0 (Good)
SO2 0 (Good)
Data on air pollution from recent days in Guotang
index
2022-05-27
pm10
56
Unhealthy for Sensitive Groups
pm25
56
Unhealthy
o3
0
Good
no2
0
Good
so2
0
Good
data source »
Air pollution in Guotang from October 2018 to May 2020

index
2020-05
2020-04
2020-03
2020-02
2020-01
2019-12
2019-11
2019-10
2019-09
2019-08
2019-07
2019-06
2019-05
2019-04
2019-03
2019-02
2019-01
2018-12
2018-11
2018-10
pm25
44 (Unhealthy for Sensitive Groups)
47 (Unhealthy for Sensitive Groups)
41 (Unhealthy for Sensitive Groups)
41 (Unhealthy for Sensitive Groups)
70 (Unhealthy)
68 (Unhealthy)
55 (Unhealthy)
55 (Unhealthy for Sensitive Groups)
30 (Moderate)
24 (Moderate)
30 (Moderate)
33 (Moderate)
41 (Unhealthy for Sensitive Groups)
53 (Unhealthy for Sensitive Groups)
65 (Unhealthy)
60 (Unhealthy)
72 (Unhealthy)
51 (Unhealthy for Sensitive Groups)
67 (Unhealthy)
49 (Unhealthy for Sensitive Groups)
co
877 (Good)
632 (Good)
602 (Good)
578 (Good)
992 (Good)
864 (Good)
591 (Good)
620 (Good)
561 (Good)
715 (Good)
763 (Good)
746 (Good)
681 (Good)
710 (Good)
742 (Good)
760 (Good)
700 (Good)
826 (Good)
846 (Good)
560 (Good)
no2
29 (Good)
43 (Moderate)
35 (Good)
26 (Good)
40 (Good)
55 (Moderate)
51 (Moderate)
43 (Moderate)
31 (Good)
27 (Good)
29 (Good)
28 (Good)
40 (Good)
39 (Good)
49 (Moderate)
39 (Good)
55 (Moderate)
45 (Moderate)
55 (Moderate)
48 (Moderate)
o3
153 (Unhealthy)
149 (Unhealthy for Sensitive Groups)
115 (Moderate)
97 (Moderate)
72 (Moderate)
79 (Moderate)
114 (Moderate)
139 (Unhealthy for Sensitive Groups)
148 (Unhealthy for Sensitive Groups)
154 (Unhealthy)
171 (Unhealthy)
206 (Very Unhealthy)
186 (Very Unhealthy)
151 (Unhealthy)
128 (Unhealthy for Sensitive Groups)
94 (Moderate)
75 (Moderate)
61 (Good)
96 (Moderate)
126 (Unhealthy for Sensitive Groups)
pm10
62 (Unhealthy for Sensitive Groups)
75 (Unhealthy for Sensitive Groups)
63 (Unhealthy for Sensitive Groups)
54 (Unhealthy for Sensitive Groups)
85 (Unhealthy)
91 (Unhealthy)
99 (Unhealthy)
87 (Unhealthy)
45 (Moderate)
37 (Moderate)
43 (Moderate)
48 (Moderate)
72 (Unhealthy for Sensitive Groups)
81 (Unhealthy)
103 (Unhealthy)
81 (Unhealthy)
101 (Unhealthy)
80 (Unhealthy for Sensitive Groups)
89 (Unhealthy)
75 (Unhealthy for Sensitive Groups)
so2
7 (Good)
12 (Good)
9.4 (Good)
8.7 (Good)
9 (Good)
11 (Good)
12 (Good)
12 (Good)
10 (Good)
9.9 (Good)
9.1 (Good)
9.4 (Good)
12 (Good)
11 (Good)
11 (Good)
9.7 (Good)
13 (Good)
11 (Good)
12 (Good)
15 (Good)
data source »
安家
Friday, May 27, 2022, 12:00 PM
PM10 179 (Very bad Hazardous)
particulate matter (PM10) suspended dust
PM2,5 35 (Unhealthy for Sensitive Groups)
particulate matter (PM2.5) dust
O3 0.04 (Good)
ozone (O3)
NO2 0 (Good)
nitrogen dioxide (NO2)
SO2 0 (Good)
sulfur dioxide (SO2)
安家
index
2022-05-27
pm10
56
pm25
56
o3
0.03
no2
0
so2
0
安家
2018-10 2020-05
index
2020-05
2020-04
2020-03
2020-02
2020-01
2019-12
2019-11
2019-10
2019-09
2019-08
2019-07
2019-06
2019-05
2019-04
2019-03
2019-02
2019-01
2018-12
2018-11
2018-10
pm25
44
47
41
41
70
68
55
55
30
24
30
33
41
53
65
60
72
51
67
49
co
877
632
602
578
992
864
591
620
561
715
763
746
681
710
742
760
700
826
846
560
no2
29
43
35
26
40
55
51
43
31
27
29
28
40
39
49
39
55
45
55
48
o3
153
149
115
97
72
79
114
139
148
154
171
206
186
151
128
94
75
61
96
126
pm10
62
75
63
54
85
91
99
87
45
37
43
48
72
81
103
81
101
80
89
75
so2
7
12
9.4
8.7
9
11
12
12
10
9.9
9.1
9.4
12
11
11
9.7
13
11
12
15
* Pollution data source:
https://openaq.org
(ChinaAQIData)
The data is licensed under CC-By 4.0
PM10 179 (Very bad Hazardous)
PM2,5 35 (Unhealthy for Sensitive Groups)
O3 0 (Good)
NO2 0 (Good)
SO2 0 (Good)
Data on air pollution from recent days in Guotang
| index | 2022-05-27 |
|---|---|
| pm10 | 56 Unhealthy for Sensitive Groups |
| pm25 | 56 Unhealthy |
| o3 | 0 Good |
| no2 | 0 Good |
| so2 | 0 Good |
| index | 2020-05 | 2020-04 | 2020-03 | 2020-02 | 2020-01 | 2019-12 | 2019-11 | 2019-10 | 2019-09 | 2019-08 | 2019-07 | 2019-06 | 2019-05 | 2019-04 | 2019-03 | 2019-02 | 2019-01 | 2018-12 | 2018-11 | 2018-10 |
|---|---|---|---|---|---|---|---|---|---|---|---|---|---|---|---|---|---|---|---|---|
| pm25 | 44 (Unhealthy for Sensitive Groups) | 47 (Unhealthy for Sensitive Groups) | 41 (Unhealthy for Sensitive Groups) | 41 (Unhealthy for Sensitive Groups) | 70 (Unhealthy) | 68 (Unhealthy) | 55 (Unhealthy) | 55 (Unhealthy for Sensitive Groups) | 30 (Moderate) | 24 (Moderate) | 30 (Moderate) | 33 (Moderate) | 41 (Unhealthy for Sensitive Groups) | 53 (Unhealthy for Sensitive Groups) | 65 (Unhealthy) | 60 (Unhealthy) | 72 (Unhealthy) | 51 (Unhealthy for Sensitive Groups) | 67 (Unhealthy) | 49 (Unhealthy for Sensitive Groups) |
| co | 877 (Good) | 632 (Good) | 602 (Good) | 578 (Good) | 992 (Good) | 864 (Good) | 591 (Good) | 620 (Good) | 561 (Good) | 715 (Good) | 763 (Good) | 746 (Good) | 681 (Good) | 710 (Good) | 742 (Good) | 760 (Good) | 700 (Good) | 826 (Good) | 846 (Good) | 560 (Good) |
| no2 | 29 (Good) | 43 (Moderate) | 35 (Good) | 26 (Good) | 40 (Good) | 55 (Moderate) | 51 (Moderate) | 43 (Moderate) | 31 (Good) | 27 (Good) | 29 (Good) | 28 (Good) | 40 (Good) | 39 (Good) | 49 (Moderate) | 39 (Good) | 55 (Moderate) | 45 (Moderate) | 55 (Moderate) | 48 (Moderate) |
| o3 | 153 (Unhealthy) | 149 (Unhealthy for Sensitive Groups) | 115 (Moderate) | 97 (Moderate) | 72 (Moderate) | 79 (Moderate) | 114 (Moderate) | 139 (Unhealthy for Sensitive Groups) | 148 (Unhealthy for Sensitive Groups) | 154 (Unhealthy) | 171 (Unhealthy) | 206 (Very Unhealthy) | 186 (Very Unhealthy) | 151 (Unhealthy) | 128 (Unhealthy for Sensitive Groups) | 94 (Moderate) | 75 (Moderate) | 61 (Good) | 96 (Moderate) | 126 (Unhealthy for Sensitive Groups) |
| pm10 | 62 (Unhealthy for Sensitive Groups) | 75 (Unhealthy for Sensitive Groups) | 63 (Unhealthy for Sensitive Groups) | 54 (Unhealthy for Sensitive Groups) | 85 (Unhealthy) | 91 (Unhealthy) | 99 (Unhealthy) | 87 (Unhealthy) | 45 (Moderate) | 37 (Moderate) | 43 (Moderate) | 48 (Moderate) | 72 (Unhealthy for Sensitive Groups) | 81 (Unhealthy) | 103 (Unhealthy) | 81 (Unhealthy) | 101 (Unhealthy) | 80 (Unhealthy for Sensitive Groups) | 89 (Unhealthy) | 75 (Unhealthy for Sensitive Groups) |
| so2 | 7 (Good) | 12 (Good) | 9.4 (Good) | 8.7 (Good) | 9 (Good) | 11 (Good) | 12 (Good) | 12 (Good) | 10 (Good) | 9.9 (Good) | 9.1 (Good) | 9.4 (Good) | 12 (Good) | 11 (Good) | 11 (Good) | 9.7 (Good) | 13 (Good) | 11 (Good) | 12 (Good) | 15 (Good) |
PM10 179 (Very bad Hazardous)
particulate matter (PM10) suspended dustPM2,5 35 (Unhealthy for Sensitive Groups)
particulate matter (PM2.5) dustO3 0.04 (Good)
ozone (O3)NO2 0 (Good)
nitrogen dioxide (NO2)SO2 0 (Good)
sulfur dioxide (SO2)安家
| index | 2022-05-27 |
|---|---|
| pm10 | 56 |
| pm25 | 56 |
| o3 | 0.03 |
| no2 | 0 |
| so2 | 0 |
安家

| index | 2020-05 | 2020-04 | 2020-03 | 2020-02 | 2020-01 | 2019-12 | 2019-11 | 2019-10 | 2019-09 | 2019-08 | 2019-07 | 2019-06 | 2019-05 | 2019-04 | 2019-03 | 2019-02 | 2019-01 | 2018-12 | 2018-11 | 2018-10 |
|---|---|---|---|---|---|---|---|---|---|---|---|---|---|---|---|---|---|---|---|---|
| pm25 | 44 | 47 | 41 | 41 | 70 | 68 | 55 | 55 | 30 | 24 | 30 | 33 | 41 | 53 | 65 | 60 | 72 | 51 | 67 | 49 |
| co | 877 | 632 | 602 | 578 | 992 | 864 | 591 | 620 | 561 | 715 | 763 | 746 | 681 | 710 | 742 | 760 | 700 | 826 | 846 | 560 |
| no2 | 29 | 43 | 35 | 26 | 40 | 55 | 51 | 43 | 31 | 27 | 29 | 28 | 40 | 39 | 49 | 39 | 55 | 45 | 55 | 48 |
| o3 | 153 | 149 | 115 | 97 | 72 | 79 | 114 | 139 | 148 | 154 | 171 | 206 | 186 | 151 | 128 | 94 | 75 | 61 | 96 | 126 |
| pm10 | 62 | 75 | 63 | 54 | 85 | 91 | 99 | 87 | 45 | 37 | 43 | 48 | 72 | 81 | 103 | 81 | 101 | 80 | 89 | 75 |
| so2 | 7 | 12 | 9.4 | 8.7 | 9 | 11 | 12 | 12 | 10 | 9.9 | 9.1 | 9.4 | 12 | 11 | 11 | 9.7 | 13 | 11 | 12 | 15 |