Air Pollution in Gaochao: Real-time Air Quality Index and smog alert.
Pollution and air quality forecast for Gaochao. Today is Tuesday, June 2, 2026. The following air pollution values have been recorded for Gaochao:- particulate matter (PM10) suspended dust - 179 (Very bad Hazardous)
- particulate matter (PM2.5) dust - 35 (Unhealthy for Sensitive Groups)
- ozone (O3) - 0 (Good)
- nitrogen dioxide (NO2) - 0 (Good)
- sulfur dioxide (SO2) - 0 (Good)

What is the air quality in Gaochao today? Is the air polluted in Gaochao?. Is there smog?
What is the level of PM10 today in Gaochao? (particulate matter (PM10) suspended dust)
The current level of particulate matter PM10 in Gaochao is:
179 (Very bad Hazardous)
The highest PM10 values usually occur in month: 79 (January 2019).
The lowest value of particulate matter PM10 pollution in Gaochao is usually recorded in: August (39).
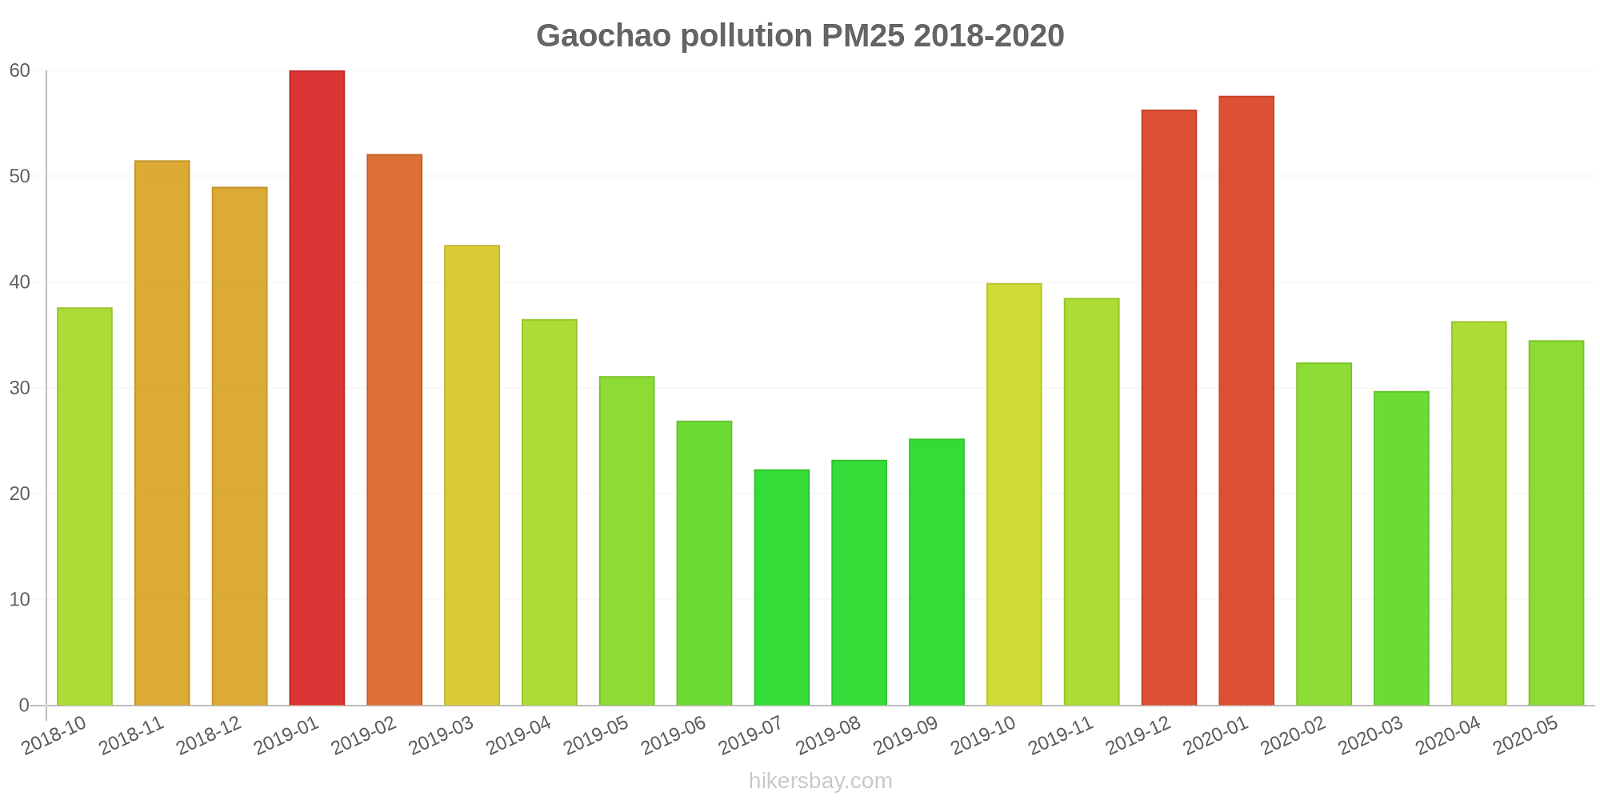
What is the current level of PM2.5 in Gaochao? (particulate matter (PM2.5) dust)
Today's PM2.5 level is:
35 (Unhealthy for Sensitive Groups)
For comparison, the highest level of PM2.5 in Gaochao in the last 7 days was: 56 (Friday, May 27, 2022) and the lowest: 56 (Friday, May 27, 2022).
The highest PM2.5 values were recorded: 60 (January 2019).
The lowest level of particulate matter PM2.5 pollution occurs in month: July (22).
How is the O3 level today in Gaochao? (ozone (O3))
0 (Good)
How high is the level of NO2? (nitrogen dioxide (NO2))
0 (Good)
What is the level of SO2 pollution? (sulfur dioxide (SO2))
0 (Good)
Current data Friday, May 27, 2022, 12:00 PM
PM10 179 (Very bad Hazardous)
PM2,5 35 (Unhealthy for Sensitive Groups)
O3 0 (Good)
NO2 0 (Good)
SO2 0 (Good)
Data on air pollution from recent days in Gaochao
index
2022-05-27
pm10
56
Unhealthy for Sensitive Groups
pm25
56
Unhealthy
o3
0
Good
no2
0
Good
so2
0
Good
data source »
Air pollution in Gaochao from October 2018 to May 2020
index
2020-05
2020-04
2020-03
2020-02
2020-01
2019-12
2019-11
2019-10
2019-09
2019-08
2019-07
2019-06
2019-05
2019-04
2019-03
2019-02
2019-01
2018-12
2018-11
2018-10
pm25
35 (Moderate)
36 (Unhealthy for Sensitive Groups)
30 (Moderate)
32 (Moderate)
58 (Unhealthy)
56 (Unhealthy)
39 (Unhealthy for Sensitive Groups)
40 (Unhealthy for Sensitive Groups)
25 (Moderate)
23 (Moderate)
22 (Moderate)
27 (Moderate)
31 (Moderate)
37 (Unhealthy for Sensitive Groups)
44 (Unhealthy for Sensitive Groups)
52 (Unhealthy for Sensitive Groups)
60 (Unhealthy)
49 (Unhealthy for Sensitive Groups)
52 (Unhealthy for Sensitive Groups)
38 (Unhealthy for Sensitive Groups)
co
937 (Good)
787 (Good)
829 (Good)
704 (Good)
954 (Good)
1 (Good)
927 (Good)
933 (Good)
1 (Good)
1 (Good)
1 (Good)
911 (Good)
789 (Good)
855 (Good)
932 (Good)
1 (Good)
1 (Good)
1 (Good)
1 (Good)
1 (Good)
no2
31 (Good)
41 (Moderate)
35 (Good)
19 (Good)
36 (Good)
52 (Moderate)
43 (Moderate)
38 (Good)
30 (Good)
24 (Good)
25 (Good)
18 (Good)
29 (Good)
34 (Good)
35 (Good)
30 (Good)
56 (Moderate)
60 (Moderate)
52 (Moderate)
46 (Moderate)
o3
156 (Unhealthy)
149 (Unhealthy for Sensitive Groups)
117 (Moderate)
84 (Moderate)
59 (Good)
66 (Good)
93 (Moderate)
114 (Moderate)
150 (Unhealthy)
134 (Unhealthy for Sensitive Groups)
115 (Moderate)
160 (Unhealthy)
117 (Moderate)
132 (Unhealthy for Sensitive Groups)
102 (Moderate)
74 (Moderate)
48 (Good)
53 (Good)
87 (Moderate)
135 (Unhealthy for Sensitive Groups)
pm10
48 (Moderate)
60 (Unhealthy for Sensitive Groups)
47 (Moderate)
42 (Moderate)
67 (Unhealthy for Sensitive Groups)
61 (Unhealthy for Sensitive Groups)
69 (Unhealthy for Sensitive Groups)
68 (Unhealthy for Sensitive Groups)
45 (Moderate)
39 (Moderate)
44 (Moderate)
44 (Moderate)
42 (Moderate)
57 (Unhealthy for Sensitive Groups)
68 (Unhealthy for Sensitive Groups)
67 (Unhealthy for Sensitive Groups)
79 (Unhealthy for Sensitive Groups)
70 (Unhealthy for Sensitive Groups)
58 (Unhealthy for Sensitive Groups)
47 (Moderate)
so2
7.6 (Good)
11 (Good)
9.9 (Good)
5.5 (Good)
5.9 (Good)
12 (Good)
12 (Good)
13 (Good)
12 (Good)
8.4 (Good)
9.4 (Good)
10 (Good)
12 (Good)
12 (Good)
12 (Good)
8.9 (Good)
17 (Good)
16 (Good)
16 (Good)
20 (Good)
data source »
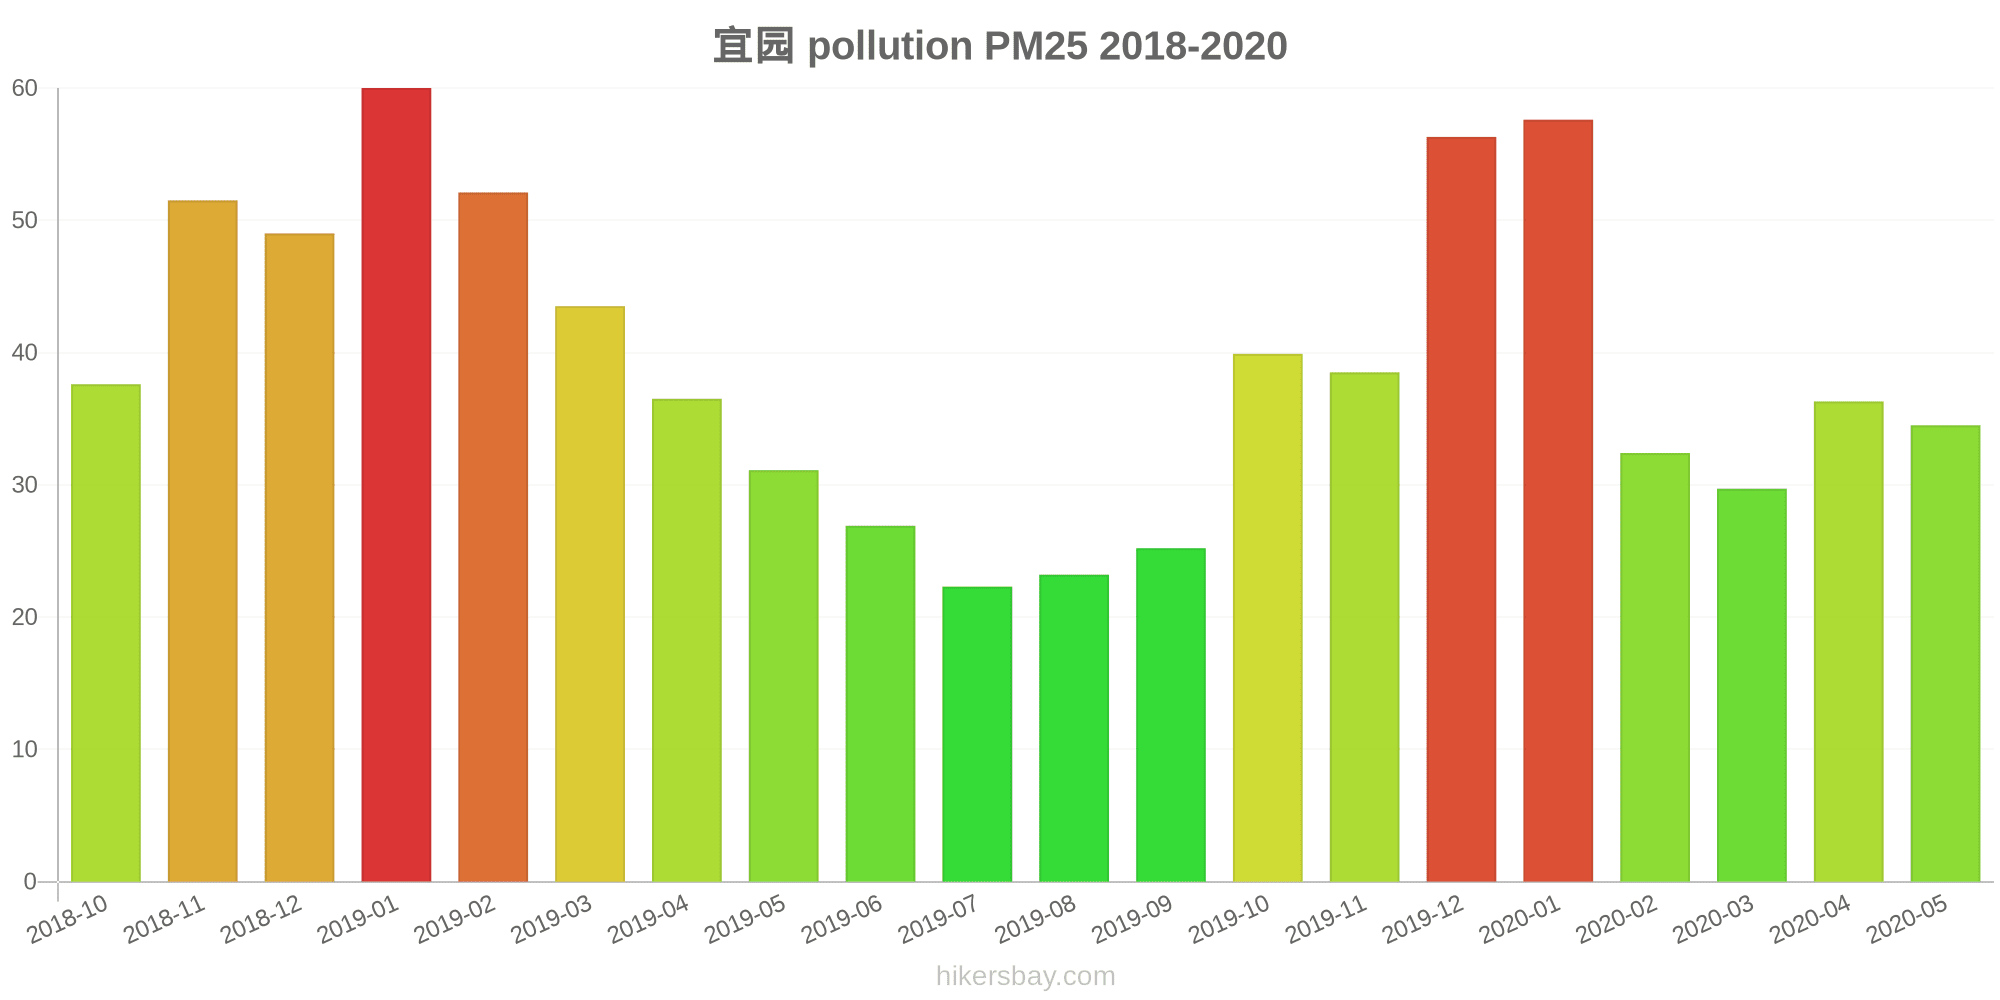
宜园
Friday, May 27, 2022, 12:00 PM
PM10 179 (Very bad Hazardous)
particulate matter (PM10) suspended dust
PM2,5 35 (Unhealthy for Sensitive Groups)
particulate matter (PM2.5) dust
O3 0.04 (Good)
ozone (O3)
NO2 0 (Good)
nitrogen dioxide (NO2)
SO2 0 (Good)
sulfur dioxide (SO2)
宜园
index
2022-05-27
pm10
56
pm25
56
o3
0.03
no2
0
so2
0
宜园
2018-10 2020-05

index
2020-05
2020-04
2020-03
2020-02
2020-01
2019-12
2019-11
2019-10
2019-09
2019-08
2019-07
2019-06
2019-05
2019-04
2019-03
2019-02
2019-01
2018-12
2018-11
2018-10
pm25
35
36
30
32
58
56
39
40
25
23
22
27
31
37
44
52
60
49
52
38
co
937
787
829
704
954
1
927
933
1
1
1
911
789
855
932
1
1
1
1
1
no2
31
41
35
19
36
52
43
38
30
24
25
18
29
34
35
30
56
60
52
46
o3
156
149
117
84
59
66
93
114
150
134
115
160
117
132
102
74
48
53
87
135
so2
7.6
11
9.9
5.5
5.9
12
12
13
12
8.4
9.4
10
12
12
12
8.9
17
16
16
20
pm10
48
60
47
42
67
61
69
68
45
39
44
44
42
57
68
67
79
70
58
47
* Pollution data source:
https://openaq.org
(ChinaAQIData)
The data is licensed under CC-By 4.0
PM10 179 (Very bad Hazardous)
PM2,5 35 (Unhealthy for Sensitive Groups)
O3 0 (Good)
NO2 0 (Good)
SO2 0 (Good)
Data on air pollution from recent days in Gaochao
| index | 2022-05-27 |
|---|---|
| pm10 | 56 Unhealthy for Sensitive Groups |
| pm25 | 56 Unhealthy |
| o3 | 0 Good |
| no2 | 0 Good |
| so2 | 0 Good |

| index | 2020-05 | 2020-04 | 2020-03 | 2020-02 | 2020-01 | 2019-12 | 2019-11 | 2019-10 | 2019-09 | 2019-08 | 2019-07 | 2019-06 | 2019-05 | 2019-04 | 2019-03 | 2019-02 | 2019-01 | 2018-12 | 2018-11 | 2018-10 |
|---|---|---|---|---|---|---|---|---|---|---|---|---|---|---|---|---|---|---|---|---|
| pm25 | 35 (Moderate) | 36 (Unhealthy for Sensitive Groups) | 30 (Moderate) | 32 (Moderate) | 58 (Unhealthy) | 56 (Unhealthy) | 39 (Unhealthy for Sensitive Groups) | 40 (Unhealthy for Sensitive Groups) | 25 (Moderate) | 23 (Moderate) | 22 (Moderate) | 27 (Moderate) | 31 (Moderate) | 37 (Unhealthy for Sensitive Groups) | 44 (Unhealthy for Sensitive Groups) | 52 (Unhealthy for Sensitive Groups) | 60 (Unhealthy) | 49 (Unhealthy for Sensitive Groups) | 52 (Unhealthy for Sensitive Groups) | 38 (Unhealthy for Sensitive Groups) |
| co | 937 (Good) | 787 (Good) | 829 (Good) | 704 (Good) | 954 (Good) | 1 (Good) | 927 (Good) | 933 (Good) | 1 (Good) | 1 (Good) | 1 (Good) | 911 (Good) | 789 (Good) | 855 (Good) | 932 (Good) | 1 (Good) | 1 (Good) | 1 (Good) | 1 (Good) | 1 (Good) |
| no2 | 31 (Good) | 41 (Moderate) | 35 (Good) | 19 (Good) | 36 (Good) | 52 (Moderate) | 43 (Moderate) | 38 (Good) | 30 (Good) | 24 (Good) | 25 (Good) | 18 (Good) | 29 (Good) | 34 (Good) | 35 (Good) | 30 (Good) | 56 (Moderate) | 60 (Moderate) | 52 (Moderate) | 46 (Moderate) |
| o3 | 156 (Unhealthy) | 149 (Unhealthy for Sensitive Groups) | 117 (Moderate) | 84 (Moderate) | 59 (Good) | 66 (Good) | 93 (Moderate) | 114 (Moderate) | 150 (Unhealthy) | 134 (Unhealthy for Sensitive Groups) | 115 (Moderate) | 160 (Unhealthy) | 117 (Moderate) | 132 (Unhealthy for Sensitive Groups) | 102 (Moderate) | 74 (Moderate) | 48 (Good) | 53 (Good) | 87 (Moderate) | 135 (Unhealthy for Sensitive Groups) |
| pm10 | 48 (Moderate) | 60 (Unhealthy for Sensitive Groups) | 47 (Moderate) | 42 (Moderate) | 67 (Unhealthy for Sensitive Groups) | 61 (Unhealthy for Sensitive Groups) | 69 (Unhealthy for Sensitive Groups) | 68 (Unhealthy for Sensitive Groups) | 45 (Moderate) | 39 (Moderate) | 44 (Moderate) | 44 (Moderate) | 42 (Moderate) | 57 (Unhealthy for Sensitive Groups) | 68 (Unhealthy for Sensitive Groups) | 67 (Unhealthy for Sensitive Groups) | 79 (Unhealthy for Sensitive Groups) | 70 (Unhealthy for Sensitive Groups) | 58 (Unhealthy for Sensitive Groups) | 47 (Moderate) |
| so2 | 7.6 (Good) | 11 (Good) | 9.9 (Good) | 5.5 (Good) | 5.9 (Good) | 12 (Good) | 12 (Good) | 13 (Good) | 12 (Good) | 8.4 (Good) | 9.4 (Good) | 10 (Good) | 12 (Good) | 12 (Good) | 12 (Good) | 8.9 (Good) | 17 (Good) | 16 (Good) | 16 (Good) | 20 (Good) |
PM10 179 (Very bad Hazardous)
particulate matter (PM10) suspended dustPM2,5 35 (Unhealthy for Sensitive Groups)
particulate matter (PM2.5) dustO3 0.04 (Good)
ozone (O3)NO2 0 (Good)
nitrogen dioxide (NO2)SO2 0 (Good)
sulfur dioxide (SO2)宜园
| index | 2022-05-27 |
|---|---|
| pm10 | 56 |
| pm25 | 56 |
| o3 | 0.03 |
| no2 | 0 |
| so2 | 0 |
宜园
| index | 2020-05 | 2020-04 | 2020-03 | 2020-02 | 2020-01 | 2019-12 | 2019-11 | 2019-10 | 2019-09 | 2019-08 | 2019-07 | 2019-06 | 2019-05 | 2019-04 | 2019-03 | 2019-02 | 2019-01 | 2018-12 | 2018-11 | 2018-10 |
|---|---|---|---|---|---|---|---|---|---|---|---|---|---|---|---|---|---|---|---|---|
| pm25 | 35 | 36 | 30 | 32 | 58 | 56 | 39 | 40 | 25 | 23 | 22 | 27 | 31 | 37 | 44 | 52 | 60 | 49 | 52 | 38 |
| co | 937 | 787 | 829 | 704 | 954 | 1 | 927 | 933 | 1 | 1 | 1 | 911 | 789 | 855 | 932 | 1 | 1 | 1 | 1 | 1 |
| no2 | 31 | 41 | 35 | 19 | 36 | 52 | 43 | 38 | 30 | 24 | 25 | 18 | 29 | 34 | 35 | 30 | 56 | 60 | 52 | 46 |
| o3 | 156 | 149 | 117 | 84 | 59 | 66 | 93 | 114 | 150 | 134 | 115 | 160 | 117 | 132 | 102 | 74 | 48 | 53 | 87 | 135 |
| so2 | 7.6 | 11 | 9.9 | 5.5 | 5.9 | 12 | 12 | 13 | 12 | 8.4 | 9.4 | 10 | 12 | 12 | 12 | 8.9 | 17 | 16 | 16 | 20 |
| pm10 | 48 | 60 | 47 | 42 | 67 | 61 | 69 | 68 | 45 | 39 | 44 | 44 | 42 | 57 | 68 | 67 | 79 | 70 | 58 | 47 |