Air Pollution in Wangzhuang: Real-time Air Quality Index and smog alert.
Pollution and air quality forecast for Wangzhuang. Today is Tuesday, June 2, 2026. The following air pollution values have been recorded for Wangzhuang:- particulate matter (PM10) suspended dust - 179 (Very bad Hazardous)
- particulate matter (PM2.5) dust - 35 (Unhealthy for Sensitive Groups)
- ozone (O3) - 0 (Good)
- nitrogen dioxide (NO2) - 0 (Good)
- sulfur dioxide (SO2) - 0 (Good)

What is the air quality in Wangzhuang today? Is the air polluted in Wangzhuang?. Is there smog?
What is the level of PM10 today in Wangzhuang? (particulate matter (PM10) suspended dust)
The current level of particulate matter PM10 in Wangzhuang is:
179 (Very bad Hazardous)
The highest PM10 values usually occur in month: 85 (January 2019).
The lowest value of particulate matter PM10 pollution in Wangzhuang is usually recorded in: July (36).
What is the current level of PM2.5 in Wangzhuang? (particulate matter (PM2.5) dust)
Today's PM2.5 level is:
35 (Unhealthy for Sensitive Groups)
For comparison, the highest level of PM2.5 in Wangzhuang in the last 7 days was: 56 (Friday, May 27, 2022) and the lowest: 56 (Friday, May 27, 2022).
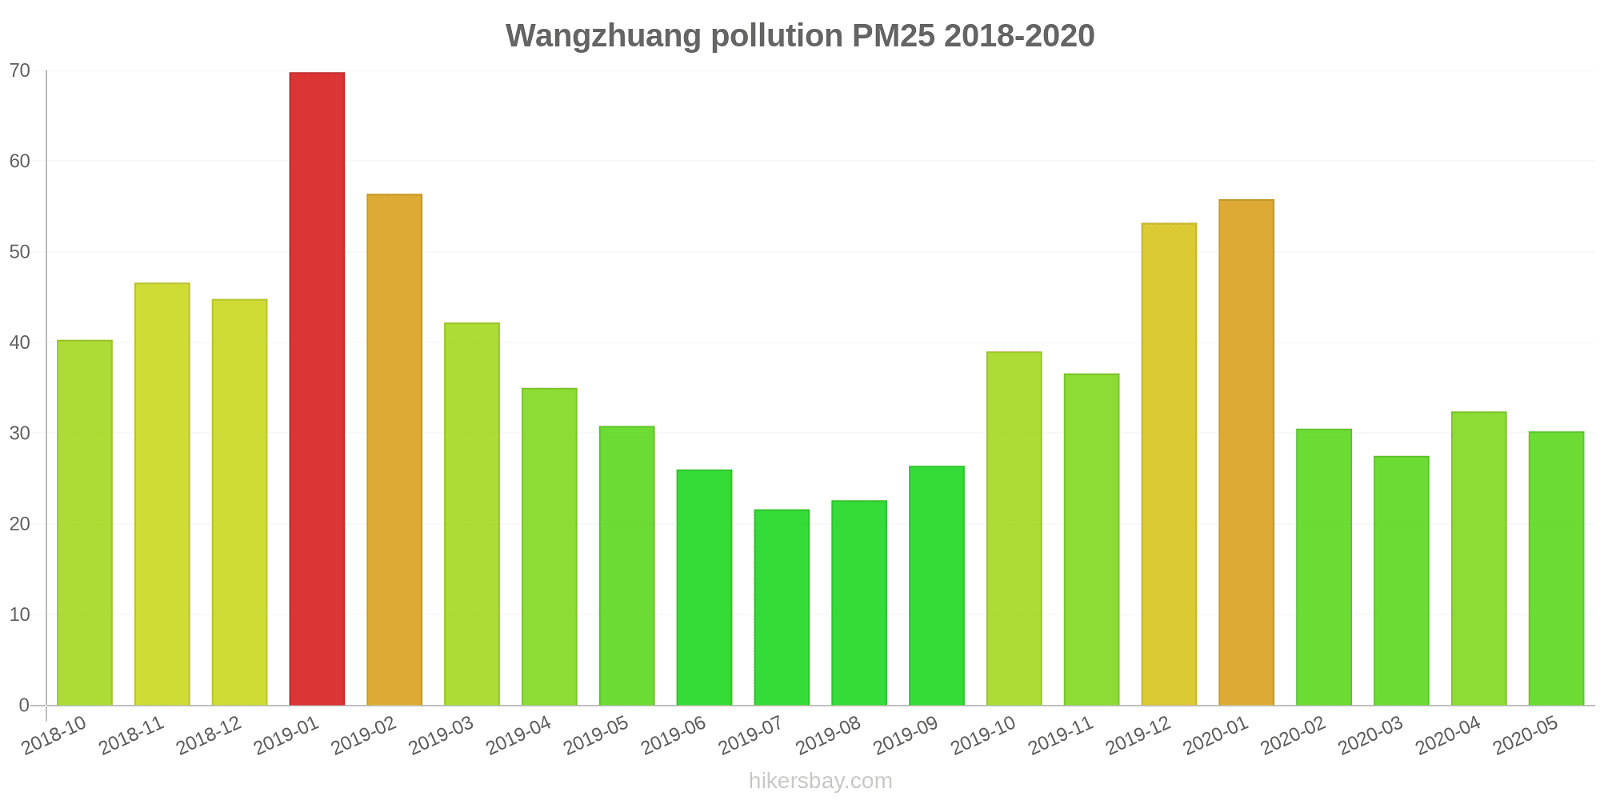
The highest PM2.5 values were recorded: 70 (January 2019).
The lowest level of particulate matter PM2.5 pollution occurs in month: July (22).
How is the O3 level today in Wangzhuang? (ozone (O3))
0 (Good)
How high is the level of NO2? (nitrogen dioxide (NO2))
0 (Good)
What is the level of SO2 pollution? (sulfur dioxide (SO2))
0 (Good)
Current data Friday, May 27, 2022, 12:00 PM
PM10 179 (Very bad Hazardous)
PM2,5 35 (Unhealthy for Sensitive Groups)
O3 0 (Good)
NO2 0 (Good)
SO2 0 (Good)
Data on air pollution from recent days in Wangzhuang
index
2022-05-27
pm10
56
Unhealthy for Sensitive Groups
pm25
56
Unhealthy
o3
0
Good
no2
0
Good
so2
0
Good
data source »
Air pollution in Wangzhuang from October 2018 to May 2020
index
2020-05
2020-04
2020-03
2020-02
2020-01
2019-12
2019-11
2019-10
2019-09
2019-08
2019-07
2019-06
2019-05
2019-04
2019-03
2019-02
2019-01
2018-12
2018-11
2018-10
pm25
30 (Moderate)
32 (Moderate)
28 (Moderate)
31 (Moderate)
56 (Unhealthy)
53 (Unhealthy for Sensitive Groups)
37 (Unhealthy for Sensitive Groups)
39 (Unhealthy for Sensitive Groups)
26 (Moderate)
23 (Moderate)
22 (Moderate)
26 (Moderate)
31 (Moderate)
35 (Unhealthy for Sensitive Groups)
42 (Unhealthy for Sensitive Groups)
56 (Unhealthy)
70 (Unhealthy)
45 (Unhealthy for Sensitive Groups)
47 (Unhealthy for Sensitive Groups)
40 (Unhealthy for Sensitive Groups)
co
1 (Good)
844 (Good)
908 (Good)
687 (Good)
924 (Good)
1 (Good)
891 (Good)
952 (Good)
1 (Good)
1 (Good)
1 (Good)
779 (Good)
469 (Good)
398 (Good)
752 (Good)
2 (Good)
1 (Good)
1 (Good)
945 (Good)
1 (Good)
no2
26 (Good)
45 (Moderate)
37 (Good)
19 (Good)
38 (Good)
56 (Moderate)
31 (Good)
22 (Good)
16 (Good)
18 (Good)
23 (Good)
18 (Good)
27 (Good)
28 (Good)
33 (Good)
25 (Good)
42 (Moderate)
41 (Moderate)
41 (Moderate)
29 (Good)
o3
162 (Unhealthy)
152 (Unhealthy)
123 (Unhealthy for Sensitive Groups)
104 (Moderate)
62 (Good)
72 (Moderate)
106 (Moderate)
124 (Unhealthy for Sensitive Groups)
173 (Unhealthy)
201 (Very Unhealthy)
153 (Unhealthy)
154 (Unhealthy)
129 (Unhealthy for Sensitive Groups)
124 (Unhealthy for Sensitive Groups)
102 (Moderate)
59 (Good)
50 (Good)
45 (Good)
80 (Moderate)
117 (Moderate)
pm10
50 (Moderate)
64 (Unhealthy for Sensitive Groups)
53 (Unhealthy for Sensitive Groups)
46 (Moderate)
82 (Unhealthy)
70 (Unhealthy for Sensitive Groups)
68 (Unhealthy for Sensitive Groups)
68 (Unhealthy for Sensitive Groups)
44 (Moderate)
37 (Moderate)
36 (Moderate)
48 (Moderate)
61 (Unhealthy for Sensitive Groups)
62 (Unhealthy for Sensitive Groups)
74 (Unhealthy for Sensitive Groups)
74 (Unhealthy for Sensitive Groups)
85 (Unhealthy)
73 (Unhealthy for Sensitive Groups)
67 (Unhealthy for Sensitive Groups)
62 (Unhealthy for Sensitive Groups)
so2
7.5 (Good)
12 (Good)
9 (Good)
5.3 (Good)
6.5 (Good)
14 (Good)
14 (Good)
14 (Good)
11 (Good)
8 (Good)
8.4 (Good)
10 (Good)
14 (Good)
13 (Good)
14 (Good)
10 (Good)
14 (Good)
23 (Good)
21 (Good)
19 (Good)
data source »
宜兴市环保局
Friday, May 27, 2022, 12:00 PM
PM10 179 (Very bad Hazardous)
particulate matter (PM10) suspended dust
PM2,5 35 (Unhealthy for Sensitive Groups)
particulate matter (PM2.5) dust
O3 0.04 (Good)
ozone (O3)
NO2 0 (Good)
nitrogen dioxide (NO2)
SO2 0 (Good)
sulfur dioxide (SO2)
宜兴市环保局
index
2022-05-27
pm10
56
pm25
56
o3
0.03
no2
0
so2
0
宜兴市环保局
2018-10 2020-05
index
2020-05
2020-04
2020-03
2020-02
2020-01
2019-12
2019-11
2019-10
2019-09
2019-08
2019-07
2019-06
2019-05
2019-04
2019-03
2019-02
2019-01
2018-12
2018-11
2018-10
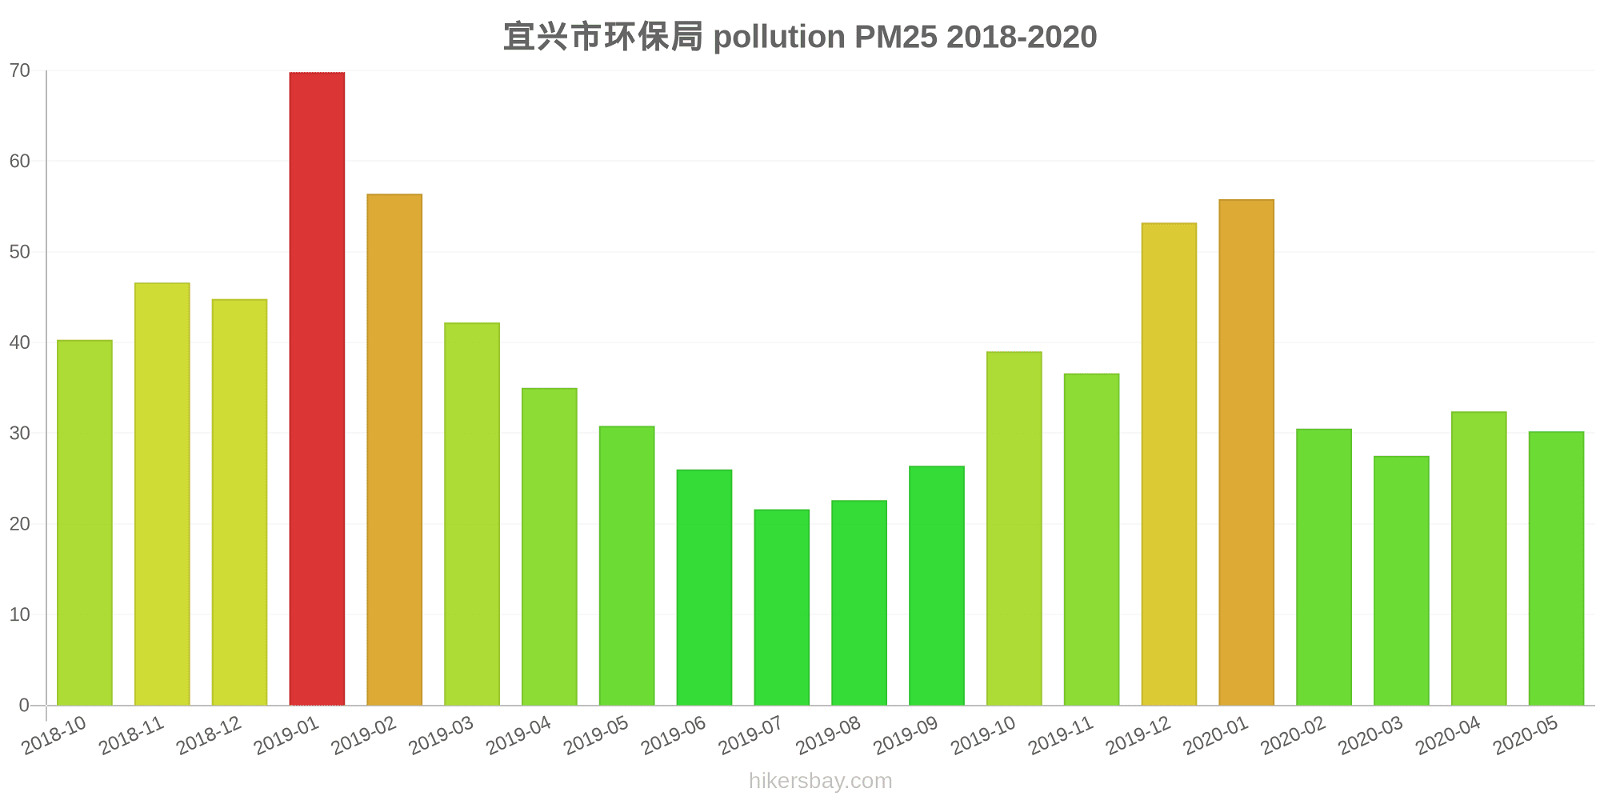
pm25
30
32
28
31
56
53
37
39
26
23
22
26
31
35
42
56
70
45
47
40
co
1
844
908
687
924
1
891
952
1
1
1
779
469
398
752
2
1
1
945
1
no2
26
45
37
19
38
56
31
22
16
18
23
18
27
28
33
25
42
41
41
29
o3
162
152
123
104
62
72
106
124
173
201
153
154
129
124
102
59
50
45
80
117
pm10
50
64
53
46
82
70
68
68
44
37
36
48
61
62
74
74
85
73
67
62
so2
7.5
12
9
5.3
6.5
14
14
14
11
8
8.4
10
14
13
14
10
14
23
21
19
* Pollution data source:
https://openaq.org
(ChinaAQIData)
The data is licensed under CC-By 4.0
PM10 179 (Very bad Hazardous)
PM2,5 35 (Unhealthy for Sensitive Groups)
O3 0 (Good)
NO2 0 (Good)
SO2 0 (Good)
Data on air pollution from recent days in Wangzhuang
| index | 2022-05-27 |
|---|---|
| pm10 | 56 Unhealthy for Sensitive Groups |
| pm25 | 56 Unhealthy |
| o3 | 0 Good |
| no2 | 0 Good |
| so2 | 0 Good |

| index | 2020-05 | 2020-04 | 2020-03 | 2020-02 | 2020-01 | 2019-12 | 2019-11 | 2019-10 | 2019-09 | 2019-08 | 2019-07 | 2019-06 | 2019-05 | 2019-04 | 2019-03 | 2019-02 | 2019-01 | 2018-12 | 2018-11 | 2018-10 |
|---|---|---|---|---|---|---|---|---|---|---|---|---|---|---|---|---|---|---|---|---|
| pm25 | 30 (Moderate) | 32 (Moderate) | 28 (Moderate) | 31 (Moderate) | 56 (Unhealthy) | 53 (Unhealthy for Sensitive Groups) | 37 (Unhealthy for Sensitive Groups) | 39 (Unhealthy for Sensitive Groups) | 26 (Moderate) | 23 (Moderate) | 22 (Moderate) | 26 (Moderate) | 31 (Moderate) | 35 (Unhealthy for Sensitive Groups) | 42 (Unhealthy for Sensitive Groups) | 56 (Unhealthy) | 70 (Unhealthy) | 45 (Unhealthy for Sensitive Groups) | 47 (Unhealthy for Sensitive Groups) | 40 (Unhealthy for Sensitive Groups) |
| co | 1 (Good) | 844 (Good) | 908 (Good) | 687 (Good) | 924 (Good) | 1 (Good) | 891 (Good) | 952 (Good) | 1 (Good) | 1 (Good) | 1 (Good) | 779 (Good) | 469 (Good) | 398 (Good) | 752 (Good) | 2 (Good) | 1 (Good) | 1 (Good) | 945 (Good) | 1 (Good) |
| no2 | 26 (Good) | 45 (Moderate) | 37 (Good) | 19 (Good) | 38 (Good) | 56 (Moderate) | 31 (Good) | 22 (Good) | 16 (Good) | 18 (Good) | 23 (Good) | 18 (Good) | 27 (Good) | 28 (Good) | 33 (Good) | 25 (Good) | 42 (Moderate) | 41 (Moderate) | 41 (Moderate) | 29 (Good) |
| o3 | 162 (Unhealthy) | 152 (Unhealthy) | 123 (Unhealthy for Sensitive Groups) | 104 (Moderate) | 62 (Good) | 72 (Moderate) | 106 (Moderate) | 124 (Unhealthy for Sensitive Groups) | 173 (Unhealthy) | 201 (Very Unhealthy) | 153 (Unhealthy) | 154 (Unhealthy) | 129 (Unhealthy for Sensitive Groups) | 124 (Unhealthy for Sensitive Groups) | 102 (Moderate) | 59 (Good) | 50 (Good) | 45 (Good) | 80 (Moderate) | 117 (Moderate) |
| pm10 | 50 (Moderate) | 64 (Unhealthy for Sensitive Groups) | 53 (Unhealthy for Sensitive Groups) | 46 (Moderate) | 82 (Unhealthy) | 70 (Unhealthy for Sensitive Groups) | 68 (Unhealthy for Sensitive Groups) | 68 (Unhealthy for Sensitive Groups) | 44 (Moderate) | 37 (Moderate) | 36 (Moderate) | 48 (Moderate) | 61 (Unhealthy for Sensitive Groups) | 62 (Unhealthy for Sensitive Groups) | 74 (Unhealthy for Sensitive Groups) | 74 (Unhealthy for Sensitive Groups) | 85 (Unhealthy) | 73 (Unhealthy for Sensitive Groups) | 67 (Unhealthy for Sensitive Groups) | 62 (Unhealthy for Sensitive Groups) |
| so2 | 7.5 (Good) | 12 (Good) | 9 (Good) | 5.3 (Good) | 6.5 (Good) | 14 (Good) | 14 (Good) | 14 (Good) | 11 (Good) | 8 (Good) | 8.4 (Good) | 10 (Good) | 14 (Good) | 13 (Good) | 14 (Good) | 10 (Good) | 14 (Good) | 23 (Good) | 21 (Good) | 19 (Good) |
PM10 179 (Very bad Hazardous)
particulate matter (PM10) suspended dustPM2,5 35 (Unhealthy for Sensitive Groups)
particulate matter (PM2.5) dustO3 0.04 (Good)
ozone (O3)NO2 0 (Good)
nitrogen dioxide (NO2)SO2 0 (Good)
sulfur dioxide (SO2)宜兴市环保局
| index | 2022-05-27 |
|---|---|
| pm10 | 56 |
| pm25 | 56 |
| o3 | 0.03 |
| no2 | 0 |
| so2 | 0 |
宜兴市环保局

| index | 2020-05 | 2020-04 | 2020-03 | 2020-02 | 2020-01 | 2019-12 | 2019-11 | 2019-10 | 2019-09 | 2019-08 | 2019-07 | 2019-06 | 2019-05 | 2019-04 | 2019-03 | 2019-02 | 2019-01 | 2018-12 | 2018-11 | 2018-10 |
|---|---|---|---|---|---|---|---|---|---|---|---|---|---|---|---|---|---|---|---|---|
| pm25 | 30 | 32 | 28 | 31 | 56 | 53 | 37 | 39 | 26 | 23 | 22 | 26 | 31 | 35 | 42 | 56 | 70 | 45 | 47 | 40 |
| co | 1 | 844 | 908 | 687 | 924 | 1 | 891 | 952 | 1 | 1 | 1 | 779 | 469 | 398 | 752 | 2 | 1 | 1 | 945 | 1 |
| no2 | 26 | 45 | 37 | 19 | 38 | 56 | 31 | 22 | 16 | 18 | 23 | 18 | 27 | 28 | 33 | 25 | 42 | 41 | 41 | 29 |
| o3 | 162 | 152 | 123 | 104 | 62 | 72 | 106 | 124 | 173 | 201 | 153 | 154 | 129 | 124 | 102 | 59 | 50 | 45 | 80 | 117 |
| pm10 | 50 | 64 | 53 | 46 | 82 | 70 | 68 | 68 | 44 | 37 | 36 | 48 | 61 | 62 | 74 | 74 | 85 | 73 | 67 | 62 |
| so2 | 7.5 | 12 | 9 | 5.3 | 6.5 | 14 | 14 | 14 | 11 | 8 | 8.4 | 10 | 14 | 13 | 14 | 10 | 14 | 23 | 21 | 19 |