Air Pollution in Tianmuhu: Real-time Air Quality Index and smog alert.
Pollution and air quality forecast for Tianmuhu. Today is Tuesday, June 2, 2026. The following air pollution values have been recorded for Tianmuhu:- particulate matter (PM10) suspended dust - 179 (Very bad Hazardous)
- particulate matter (PM2.5) dust - 35 (Unhealthy for Sensitive Groups)
- ozone (O3) - 0 (Good)
- nitrogen dioxide (NO2) - 0 (Good)
- sulfur dioxide (SO2) - 0 (Good)

What is the air quality in Tianmuhu today? Is the air polluted in Tianmuhu?. Is there smog?
What is the level of PM10 today in Tianmuhu? (particulate matter (PM10) suspended dust)
The current level of particulate matter PM10 in Tianmuhu is:
179 (Very bad Hazardous)
The highest PM10 values usually occur in month: 106 (January 2019).
The lowest value of particulate matter PM10 pollution in Tianmuhu is usually recorded in: July (40).
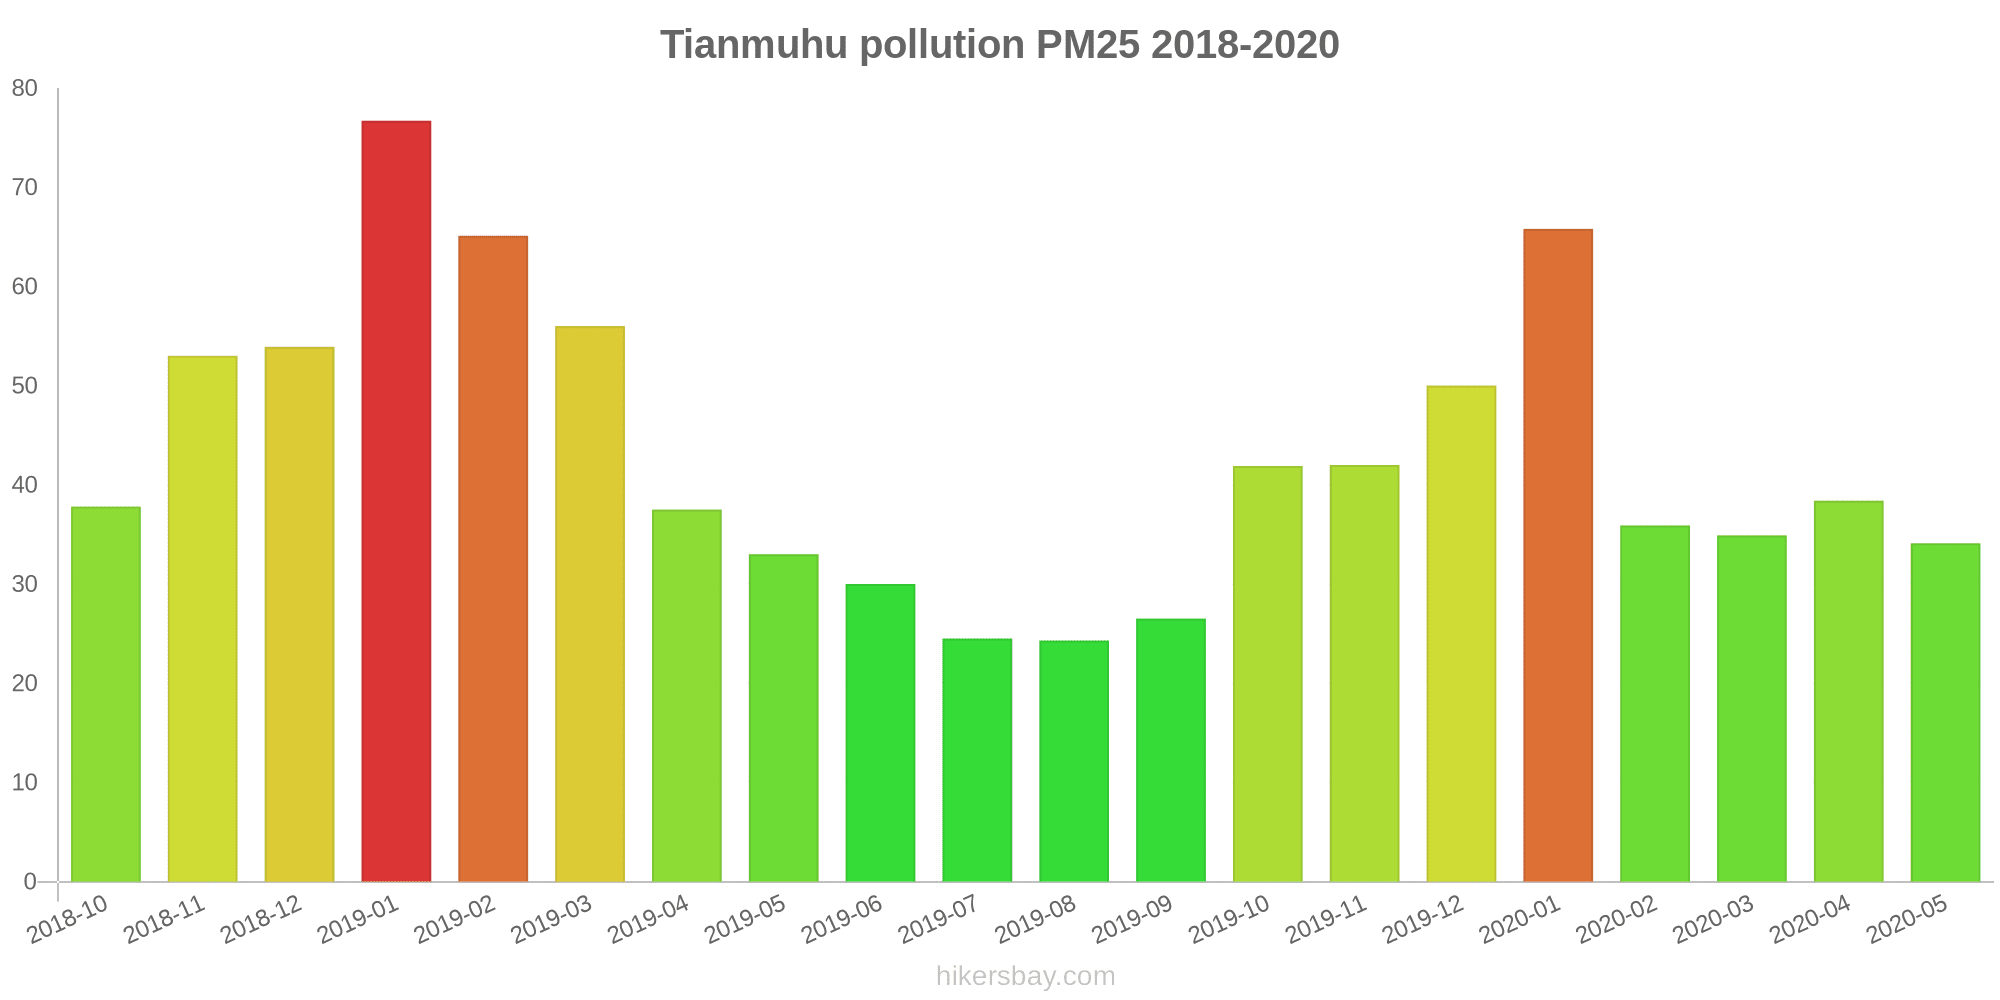
What is the current level of PM2.5 in Tianmuhu? (particulate matter (PM2.5) dust)
Today's PM2.5 level is:
35 (Unhealthy for Sensitive Groups)
For comparison, the highest level of PM2.5 in Tianmuhu in the last 7 days was: 56 (Friday, May 27, 2022) and the lowest: 56 (Friday, May 27, 2022).
The highest PM2.5 values were recorded: 77 (January 2019).
The lowest level of particulate matter PM2.5 pollution occurs in month: August (24).
How is the O3 level today in Tianmuhu? (ozone (O3))
0 (Good)
How high is the level of NO2? (nitrogen dioxide (NO2))
0 (Good)
What is the level of SO2 pollution? (sulfur dioxide (SO2))
0 (Good)
Current data Friday, May 27, 2022, 12:00 PM
PM10 179 (Very bad Hazardous)
PM2,5 35 (Unhealthy for Sensitive Groups)
O3 0 (Good)
NO2 0 (Good)
SO2 0 (Good)
Data on air pollution from recent days in Tianmuhu
index
2022-05-27
pm10
56
Unhealthy for Sensitive Groups
pm25
56
Unhealthy
o3
0
Good
no2
0
Good
so2
0
Good
data source »
Air pollution in Tianmuhu from October 2018 to May 2020

index
2020-05
2020-04
2020-03
2020-02
2020-01
2019-12
2019-11
2019-10
2019-09
2019-08
2019-07
2019-06
2019-05
2019-04
2019-03
2019-02
2019-01
2018-12
2018-11
2018-10
pm25
34 (Moderate)
38 (Unhealthy for Sensitive Groups)
35 (Moderate)
36 (Unhealthy for Sensitive Groups)
66 (Unhealthy)
50 (Unhealthy for Sensitive Groups)
42 (Unhealthy for Sensitive Groups)
42 (Unhealthy for Sensitive Groups)
27 (Moderate)
24 (Moderate)
25 (Moderate)
30 (Moderate)
33 (Moderate)
38 (Unhealthy for Sensitive Groups)
56 (Unhealthy)
65 (Unhealthy)
77 (Very Unhealthy)
54 (Unhealthy for Sensitive Groups)
53 (Unhealthy for Sensitive Groups)
38 (Unhealthy for Sensitive Groups)
co
1 (Good)
1 (Good)
691 (Good)
662 (Good)
962 (Good)
854 (Good)
840 (Good)
860 (Good)
875 (Good)
1 (Good)
784 (Good)
1 (Good)
1 (Good)
1 (Good)
1 (Good)
1 (Good)
1 (Good)
1 (Good)
1 (Good)
941 (Good)
no2
21 (Good)
36 (Good)
31 (Good)
12 (Good)
25 (Good)
40 (Good)
39 (Good)
38 (Good)
27 (Good)
21 (Good)
19 (Good)
22 (Good)
28 (Good)
31 (Good)
36 (Good)
32 (Good)
50 (Moderate)
45 (Moderate)
47 (Moderate)
42 (Moderate)
o3
156 (Unhealthy)
150 (Unhealthy)
116 (Moderate)
93 (Moderate)
64 (Good)
68 (Good)
92 (Moderate)
112 (Moderate)
145 (Unhealthy for Sensitive Groups)
159 (Unhealthy)
137 (Unhealthy for Sensitive Groups)
177 (Unhealthy)
151 (Unhealthy)
131 (Unhealthy for Sensitive Groups)
122 (Unhealthy for Sensitive Groups)
78 (Moderate)
62 (Good)
57 (Good)
99 (Moderate)
139 (Unhealthy for Sensitive Groups)
pm10
54 (Unhealthy for Sensitive Groups)
68 (Unhealthy for Sensitive Groups)
62 (Unhealthy for Sensitive Groups)
53 (Unhealthy for Sensitive Groups)
91 (Unhealthy)
88 (Unhealthy)
90 (Unhealthy)
81 (Unhealthy)
51 (Unhealthy for Sensitive Groups)
41 (Moderate)
40 (Moderate)
45 (Moderate)
59 (Unhealthy for Sensitive Groups)
64 (Unhealthy for Sensitive Groups)
86 (Unhealthy)
85 (Unhealthy)
106 (Unhealthy)
80 (Unhealthy)
76 (Unhealthy for Sensitive Groups)
66 (Unhealthy for Sensitive Groups)
so2
11 (Good)
13 (Good)
9.4 (Good)
6 (Good)
5.8 (Good)
8.3 (Good)
10 (Good)
9.7 (Good)
7.3 (Good)
5.5 (Good)
5.9 (Good)
6.7 (Good)
7 (Good)
6 (Good)
11 (Good)
6.5 (Good)
7.3 (Good)
7.3 (Good)
7.8 (Good)
10 (Good)
data source »
燕山子站
Friday, May 27, 2022, 12:00 PM
PM10 179 (Very bad Hazardous)
particulate matter (PM10) suspended dust
PM2,5 35 (Unhealthy for Sensitive Groups)
particulate matter (PM2.5) dust
O3 0.04 (Good)
ozone (O3)
NO2 0 (Good)
nitrogen dioxide (NO2)
SO2 0 (Good)
sulfur dioxide (SO2)
燕山子站
index
2022-05-27
pm10
56
pm25
56
o3
0.03
no2
0
so2
0
燕山子站
2018-10 2020-05

index
2020-05
2020-04
2020-03
2020-02
2020-01
2019-12
2019-11
2019-10
2019-09
2019-08
2019-07
2019-06
2019-05
2019-04
2019-03
2019-02
2019-01
2018-12
2018-11
2018-10
pm25
34
38
35
36
66
50
42
42
27
24
25
30
33
38
56
65
77
54
53
38
co
1
1
691
662
962
854
840
860
875
1
784
1
1
1
1
1
1
1
1
941
no2
21
36
31
12
25
40
39
38
27
21
19
22
28
31
36
32
50
45
47
42
o3
156
150
116
93
64
68
92
112
145
159
137
177
151
131
122
78
62
57
99
139
pm10
54
68
62
53
91
88
90
81
51
41
40
45
59
64
86
85
106
80
76
66
so2
11
13
9.4
6
5.8
8.3
10
9.7
7.3
5.5
5.9
6.7
7
6
11
6.5
7.3
7.3
7.8
10
* Pollution data source:
https://openaq.org
(ChinaAQIData)
The data is licensed under CC-By 4.0
PM10 179 (Very bad Hazardous)
PM2,5 35 (Unhealthy for Sensitive Groups)
O3 0 (Good)
NO2 0 (Good)
SO2 0 (Good)
Data on air pollution from recent days in Tianmuhu
| index | 2022-05-27 |
|---|---|
| pm10 | 56 Unhealthy for Sensitive Groups |
| pm25 | 56 Unhealthy |
| o3 | 0 Good |
| no2 | 0 Good |
| so2 | 0 Good |
| index | 2020-05 | 2020-04 | 2020-03 | 2020-02 | 2020-01 | 2019-12 | 2019-11 | 2019-10 | 2019-09 | 2019-08 | 2019-07 | 2019-06 | 2019-05 | 2019-04 | 2019-03 | 2019-02 | 2019-01 | 2018-12 | 2018-11 | 2018-10 |
|---|---|---|---|---|---|---|---|---|---|---|---|---|---|---|---|---|---|---|---|---|
| pm25 | 34 (Moderate) | 38 (Unhealthy for Sensitive Groups) | 35 (Moderate) | 36 (Unhealthy for Sensitive Groups) | 66 (Unhealthy) | 50 (Unhealthy for Sensitive Groups) | 42 (Unhealthy for Sensitive Groups) | 42 (Unhealthy for Sensitive Groups) | 27 (Moderate) | 24 (Moderate) | 25 (Moderate) | 30 (Moderate) | 33 (Moderate) | 38 (Unhealthy for Sensitive Groups) | 56 (Unhealthy) | 65 (Unhealthy) | 77 (Very Unhealthy) | 54 (Unhealthy for Sensitive Groups) | 53 (Unhealthy for Sensitive Groups) | 38 (Unhealthy for Sensitive Groups) |
| co | 1 (Good) | 1 (Good) | 691 (Good) | 662 (Good) | 962 (Good) | 854 (Good) | 840 (Good) | 860 (Good) | 875 (Good) | 1 (Good) | 784 (Good) | 1 (Good) | 1 (Good) | 1 (Good) | 1 (Good) | 1 (Good) | 1 (Good) | 1 (Good) | 1 (Good) | 941 (Good) |
| no2 | 21 (Good) | 36 (Good) | 31 (Good) | 12 (Good) | 25 (Good) | 40 (Good) | 39 (Good) | 38 (Good) | 27 (Good) | 21 (Good) | 19 (Good) | 22 (Good) | 28 (Good) | 31 (Good) | 36 (Good) | 32 (Good) | 50 (Moderate) | 45 (Moderate) | 47 (Moderate) | 42 (Moderate) |
| o3 | 156 (Unhealthy) | 150 (Unhealthy) | 116 (Moderate) | 93 (Moderate) | 64 (Good) | 68 (Good) | 92 (Moderate) | 112 (Moderate) | 145 (Unhealthy for Sensitive Groups) | 159 (Unhealthy) | 137 (Unhealthy for Sensitive Groups) | 177 (Unhealthy) | 151 (Unhealthy) | 131 (Unhealthy for Sensitive Groups) | 122 (Unhealthy for Sensitive Groups) | 78 (Moderate) | 62 (Good) | 57 (Good) | 99 (Moderate) | 139 (Unhealthy for Sensitive Groups) |
| pm10 | 54 (Unhealthy for Sensitive Groups) | 68 (Unhealthy for Sensitive Groups) | 62 (Unhealthy for Sensitive Groups) | 53 (Unhealthy for Sensitive Groups) | 91 (Unhealthy) | 88 (Unhealthy) | 90 (Unhealthy) | 81 (Unhealthy) | 51 (Unhealthy for Sensitive Groups) | 41 (Moderate) | 40 (Moderate) | 45 (Moderate) | 59 (Unhealthy for Sensitive Groups) | 64 (Unhealthy for Sensitive Groups) | 86 (Unhealthy) | 85 (Unhealthy) | 106 (Unhealthy) | 80 (Unhealthy) | 76 (Unhealthy for Sensitive Groups) | 66 (Unhealthy for Sensitive Groups) |
| so2 | 11 (Good) | 13 (Good) | 9.4 (Good) | 6 (Good) | 5.8 (Good) | 8.3 (Good) | 10 (Good) | 9.7 (Good) | 7.3 (Good) | 5.5 (Good) | 5.9 (Good) | 6.7 (Good) | 7 (Good) | 6 (Good) | 11 (Good) | 6.5 (Good) | 7.3 (Good) | 7.3 (Good) | 7.8 (Good) | 10 (Good) |
PM10 179 (Very bad Hazardous)
particulate matter (PM10) suspended dustPM2,5 35 (Unhealthy for Sensitive Groups)
particulate matter (PM2.5) dustO3 0.04 (Good)
ozone (O3)NO2 0 (Good)
nitrogen dioxide (NO2)SO2 0 (Good)
sulfur dioxide (SO2)燕山子站
| index | 2022-05-27 |
|---|---|
| pm10 | 56 |
| pm25 | 56 |
| o3 | 0.03 |
| no2 | 0 |
| so2 | 0 |
燕山子站

| index | 2020-05 | 2020-04 | 2020-03 | 2020-02 | 2020-01 | 2019-12 | 2019-11 | 2019-10 | 2019-09 | 2019-08 | 2019-07 | 2019-06 | 2019-05 | 2019-04 | 2019-03 | 2019-02 | 2019-01 | 2018-12 | 2018-11 | 2018-10 |
|---|---|---|---|---|---|---|---|---|---|---|---|---|---|---|---|---|---|---|---|---|
| pm25 | 34 | 38 | 35 | 36 | 66 | 50 | 42 | 42 | 27 | 24 | 25 | 30 | 33 | 38 | 56 | 65 | 77 | 54 | 53 | 38 |
| co | 1 | 1 | 691 | 662 | 962 | 854 | 840 | 860 | 875 | 1 | 784 | 1 | 1 | 1 | 1 | 1 | 1 | 1 | 1 | 941 |
| no2 | 21 | 36 | 31 | 12 | 25 | 40 | 39 | 38 | 27 | 21 | 19 | 22 | 28 | 31 | 36 | 32 | 50 | 45 | 47 | 42 |
| o3 | 156 | 150 | 116 | 93 | 64 | 68 | 92 | 112 | 145 | 159 | 137 | 177 | 151 | 131 | 122 | 78 | 62 | 57 | 99 | 139 |
| pm10 | 54 | 68 | 62 | 53 | 91 | 88 | 90 | 81 | 51 | 41 | 40 | 45 | 59 | 64 | 86 | 85 | 106 | 80 | 76 | 66 |
| so2 | 11 | 13 | 9.4 | 6 | 5.8 | 8.3 | 10 | 9.7 | 7.3 | 5.5 | 5.9 | 6.7 | 7 | 6 | 11 | 6.5 | 7.3 | 7.3 | 7.8 | 10 |