Air Pollution in Nancun: Real-time Air Quality Index and smog alert.
Pollution and air quality forecast for Nancun. Today is Tuesday, June 16, 2026. The following air pollution values have been recorded for Nancun:- particulate matter (PM10) suspended dust - 7 (Good)
- particulate matter (PM2.5) dust - 2 (Good)
- carbon monoxide (CO) - 100 (Good)
- nitrogen dioxide (NO2) - 8 (Good)
- ozone (O3) - 0 (Good)
- sulfur dioxide (SO2) - 9 (Good)

What is the air quality in Nancun today? Is the air polluted in Nancun?. Is there smog?
What is the level of PM10 today in Nancun? (particulate matter (PM10) suspended dust)
The current level of particulate matter PM10 in Nancun is:
7 (Good)
The highest PM10 values usually occur in month: 94 (January 2019).
The lowest value of particulate matter PM10 pollution in Nancun is usually recorded in: August (43).
What is the current level of PM2.5 in Nancun? (particulate matter (PM2.5) dust)
Today's PM2.5 level is:
2 (Good)
For comparison, the highest level of PM2.5 in Nancun in the last 7 days was: 24 (Friday, May 27, 2022) and the lowest: 24 (Friday, May 27, 2022).
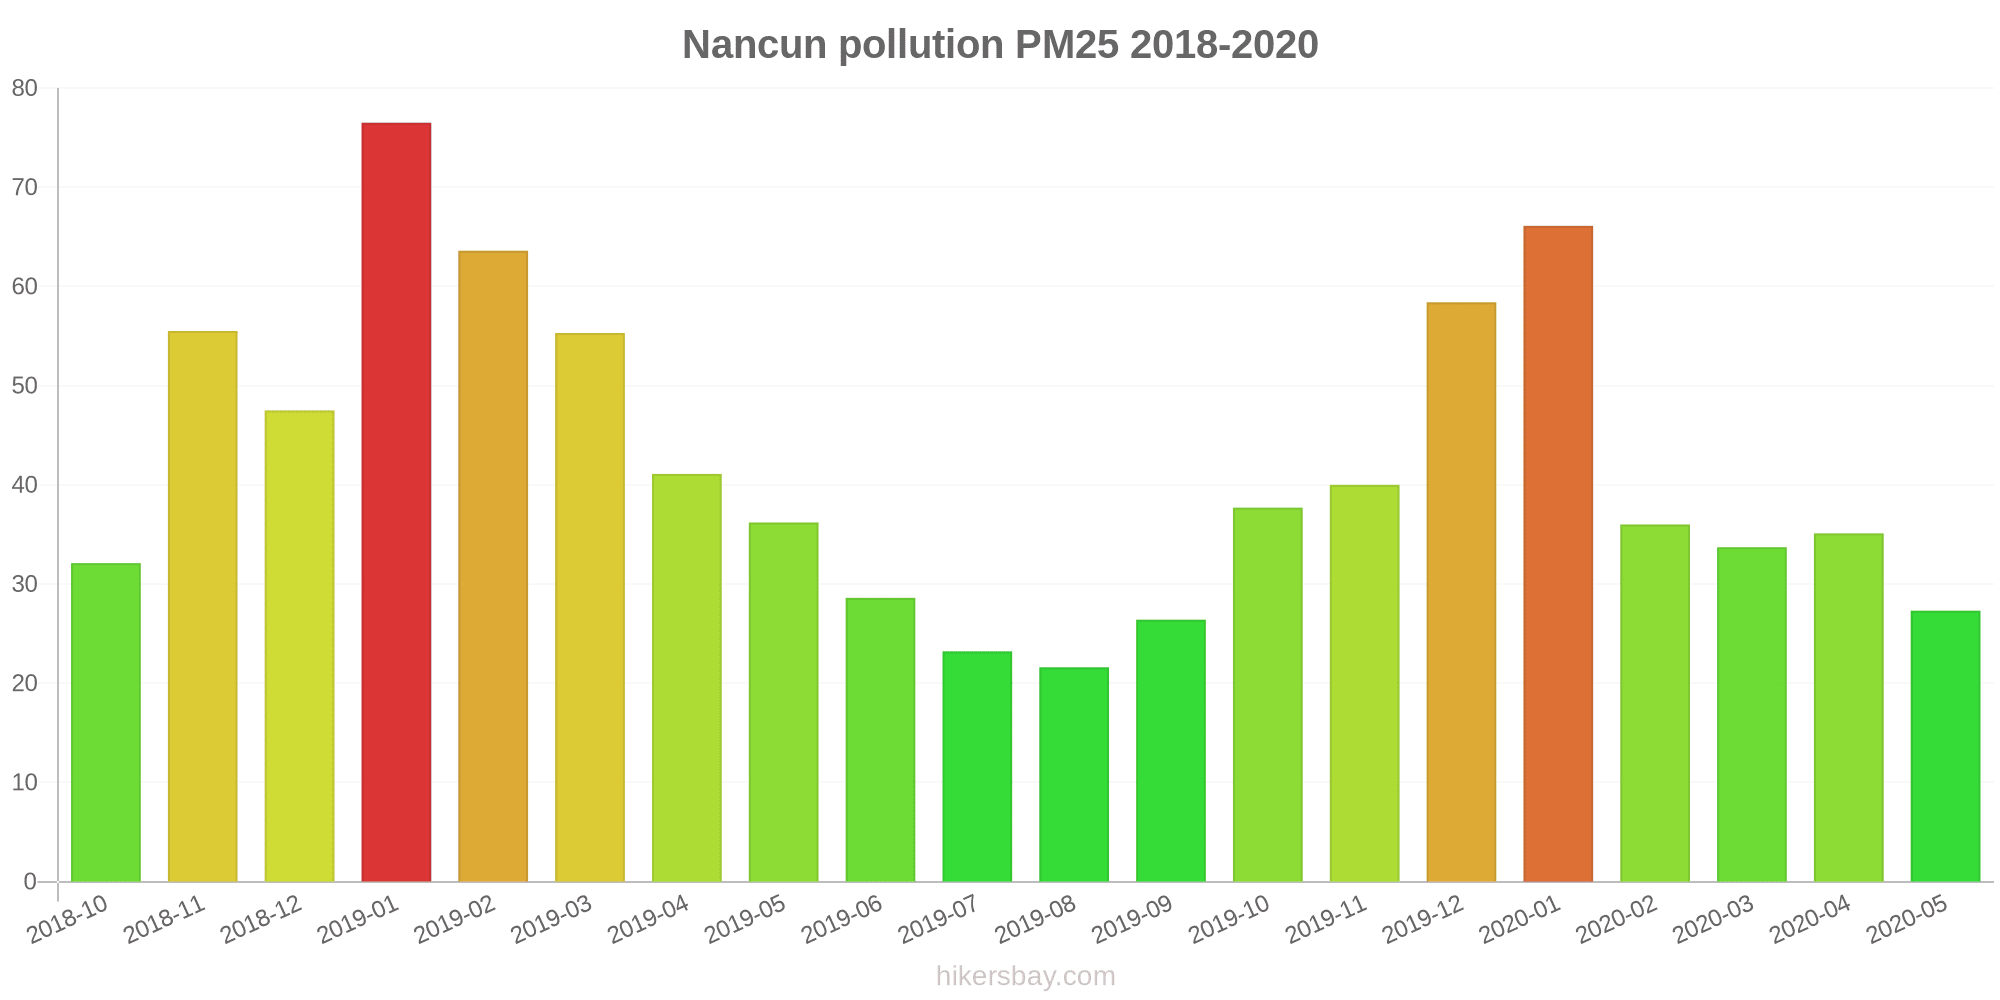
The highest PM2.5 values were recorded: 77 (January 2019).
The lowest level of particulate matter PM2.5 pollution occurs in month: August (22).
How high is the CO level? (carbon monoxide (CO))
100 (Good)
How high is the level of NO2? (nitrogen dioxide (NO2))
8 (Good)
How is the O3 level today in Nancun? (ozone (O3))
0 (Good)
What is the level of SO2 pollution? (sulfur dioxide (SO2))
9 (Good)
Current data Friday, May 27, 2022, 12:00 PM
PM10 7 (Good)
PM2,5 2 (Good)
CO 100 (Good)
NO2 8 (Good)
O3 0 (Good)
SO2 9 (Good)
Data on air pollution from recent days in Nancun
index
2022-05-27
pm10
32
Moderate
pm25
24
Moderate
co
468
Good
no2
21
Good
o3
32
Good
so2
5
Good
data source »
Air pollution in Nancun from October 2018 to May 2020

index
2020-05
2020-04
2020-03
2020-02
2020-01
2019-12
2019-11
2019-10
2019-09
2019-08
2019-07
2019-06
2019-05
2019-04
2019-03
2019-02
2019-01
2018-12
2018-11
2018-10
pm25
27 (Moderate)
35 (Unhealthy for Sensitive Groups)
34 (Moderate)
36 (Unhealthy for Sensitive Groups)
66 (Unhealthy)
58 (Unhealthy)
40 (Unhealthy for Sensitive Groups)
38 (Unhealthy for Sensitive Groups)
26 (Moderate)
22 (Moderate)
23 (Moderate)
29 (Moderate)
36 (Unhealthy for Sensitive Groups)
41 (Unhealthy for Sensitive Groups)
55 (Unhealthy)
64 (Unhealthy)
77 (Very Unhealthy)
48 (Unhealthy for Sensitive Groups)
56 (Unhealthy)
32 (Moderate)
co
808 (Good)
699 (Good)
567 (Good)
596 (Good)
818 (Good)
768 (Good)
805 (Good)
920 (Good)
811 (Good)
799 (Good)
851 (Good)
897 (Good)
801 (Good)
924 (Good)
893 (Good)
985 (Good)
1 (Good)
1 (Good)
1 (Good)
930 (Good)
no2
22 (Good)
40 (Good)
35 (Good)
21 (Good)
32 (Good)
46 (Moderate)
41 (Moderate)
36 (Good)
22 (Good)
23 (Good)
19 (Good)
25 (Good)
29 (Good)
36 (Good)
44 (Moderate)
37 (Good)
55 (Moderate)
43 (Moderate)
37 (Good)
27 (Good)
o3
138 (Unhealthy for Sensitive Groups)
127 (Unhealthy for Sensitive Groups)
94 (Moderate)
78 (Moderate)
57 (Good)
62 (Good)
96 (Moderate)
120 (Unhealthy for Sensitive Groups)
173 (Unhealthy)
170 (Unhealthy)
154 (Unhealthy)
195 (Very Unhealthy)
165 (Unhealthy)
132 (Unhealthy for Sensitive Groups)
110 (Moderate)
77 (Moderate)
65 (Good)
54 (Good)
85 (Moderate)
120 (Unhealthy for Sensitive Groups)
pm10
55 (Unhealthy for Sensitive Groups)
65 (Unhealthy for Sensitive Groups)
55 (Unhealthy for Sensitive Groups)
49 (Moderate)
76 (Unhealthy for Sensitive Groups)
77 (Unhealthy for Sensitive Groups)
87 (Unhealthy)
84 (Unhealthy)
54 (Unhealthy for Sensitive Groups)
43 (Moderate)
47 (Moderate)
54 (Unhealthy for Sensitive Groups)
73 (Unhealthy for Sensitive Groups)
66 (Unhealthy for Sensitive Groups)
83 (Unhealthy)
79 (Unhealthy for Sensitive Groups)
94 (Unhealthy)
82 (Unhealthy)
88 (Unhealthy)
77 (Unhealthy for Sensitive Groups)
so2
7.3 (Good)
11 (Good)
9.7 (Good)
7.3 (Good)
8.2 (Good)
8.2 (Good)
8.7 (Good)
13 (Good)
9.5 (Good)
8.7 (Good)
5.4 (Good)
9.6 (Good)
12 (Good)
12 (Good)
14 (Good)
10 (Good)
12 (Good)
10 (Good)
11 (Good)
11 (Good)
data source »
Ma'anshan Tian Ping Fu Zhuang
Friday, May 27, 2022, 12:00 PM
PM10 6.7 (Good)
particulate matter (PM10) suspended dust
PM2,5 1.7 (Good)
particulate matter (PM2.5) dust
CO 100 (Good)
carbon monoxide (CO)
NO2 7.6 (Good)
nitrogen dioxide (NO2)
O3 0.02 (Good)
ozone (O3)
SO2 8.6 (Good)
sulfur dioxide (SO2)
Ma'anshan Tian Ping Fu Zhuang
index
2022-05-27
pm10
32
pm25
24
co
468
no2
21
o3
32
so2
4.6
天平服装
2018-10 2020-05

index
2020-05
2020-04
2020-03
2020-02
2020-01
2019-12
2019-11
2019-10
2019-09
2019-08
2019-07
2019-06
2019-05
2019-04
2019-03
2019-02
2019-01
2018-12
2018-11
2018-10
pm25
27
35
34
36
66
58
40
38
26
22
23
29
36
41
55
64
77
48
56
32
co
808
699
567
596
818
768
805
920
811
799
851
897
801
924
893
985
1
1
1
930
no2
22
40
35
21
32
46
41
36
22
23
19
25
29
36
44
37
55
43
37
27
o3
138
127
94
78
57
62
96
120
173
170
154
195
165
132
110
77
65
54
85
120
pm10
55
65
55
49
76
77
87
84
54
43
47
54
73
66
83
79
94
82
88
77
so2
7.3
11
9.7
7.3
8.2
8.2
8.7
13
9.5
8.7
5.4
9.6
12
12
14
10
12
10
11
11
* Pollution data source:
https://openaq.org
(ChinaAQIData)
The data is licensed under CC-By 4.0
PM10 7 (Good)
PM2,5 2 (Good)
CO 100 (Good)
NO2 8 (Good)
O3 0 (Good)
SO2 9 (Good)
Data on air pollution from recent days in Nancun
| index | 2022-05-27 |
|---|---|
| pm10 | 32 Moderate |
| pm25 | 24 Moderate |
| co | 468 Good |
| no2 | 21 Good |
| o3 | 32 Good |
| so2 | 5 Good |
| index | 2020-05 | 2020-04 | 2020-03 | 2020-02 | 2020-01 | 2019-12 | 2019-11 | 2019-10 | 2019-09 | 2019-08 | 2019-07 | 2019-06 | 2019-05 | 2019-04 | 2019-03 | 2019-02 | 2019-01 | 2018-12 | 2018-11 | 2018-10 |
|---|---|---|---|---|---|---|---|---|---|---|---|---|---|---|---|---|---|---|---|---|
| pm25 | 27 (Moderate) | 35 (Unhealthy for Sensitive Groups) | 34 (Moderate) | 36 (Unhealthy for Sensitive Groups) | 66 (Unhealthy) | 58 (Unhealthy) | 40 (Unhealthy for Sensitive Groups) | 38 (Unhealthy for Sensitive Groups) | 26 (Moderate) | 22 (Moderate) | 23 (Moderate) | 29 (Moderate) | 36 (Unhealthy for Sensitive Groups) | 41 (Unhealthy for Sensitive Groups) | 55 (Unhealthy) | 64 (Unhealthy) | 77 (Very Unhealthy) | 48 (Unhealthy for Sensitive Groups) | 56 (Unhealthy) | 32 (Moderate) |
| co | 808 (Good) | 699 (Good) | 567 (Good) | 596 (Good) | 818 (Good) | 768 (Good) | 805 (Good) | 920 (Good) | 811 (Good) | 799 (Good) | 851 (Good) | 897 (Good) | 801 (Good) | 924 (Good) | 893 (Good) | 985 (Good) | 1 (Good) | 1 (Good) | 1 (Good) | 930 (Good) |
| no2 | 22 (Good) | 40 (Good) | 35 (Good) | 21 (Good) | 32 (Good) | 46 (Moderate) | 41 (Moderate) | 36 (Good) | 22 (Good) | 23 (Good) | 19 (Good) | 25 (Good) | 29 (Good) | 36 (Good) | 44 (Moderate) | 37 (Good) | 55 (Moderate) | 43 (Moderate) | 37 (Good) | 27 (Good) |
| o3 | 138 (Unhealthy for Sensitive Groups) | 127 (Unhealthy for Sensitive Groups) | 94 (Moderate) | 78 (Moderate) | 57 (Good) | 62 (Good) | 96 (Moderate) | 120 (Unhealthy for Sensitive Groups) | 173 (Unhealthy) | 170 (Unhealthy) | 154 (Unhealthy) | 195 (Very Unhealthy) | 165 (Unhealthy) | 132 (Unhealthy for Sensitive Groups) | 110 (Moderate) | 77 (Moderate) | 65 (Good) | 54 (Good) | 85 (Moderate) | 120 (Unhealthy for Sensitive Groups) |
| pm10 | 55 (Unhealthy for Sensitive Groups) | 65 (Unhealthy for Sensitive Groups) | 55 (Unhealthy for Sensitive Groups) | 49 (Moderate) | 76 (Unhealthy for Sensitive Groups) | 77 (Unhealthy for Sensitive Groups) | 87 (Unhealthy) | 84 (Unhealthy) | 54 (Unhealthy for Sensitive Groups) | 43 (Moderate) | 47 (Moderate) | 54 (Unhealthy for Sensitive Groups) | 73 (Unhealthy for Sensitive Groups) | 66 (Unhealthy for Sensitive Groups) | 83 (Unhealthy) | 79 (Unhealthy for Sensitive Groups) | 94 (Unhealthy) | 82 (Unhealthy) | 88 (Unhealthy) | 77 (Unhealthy for Sensitive Groups) |
| so2 | 7.3 (Good) | 11 (Good) | 9.7 (Good) | 7.3 (Good) | 8.2 (Good) | 8.2 (Good) | 8.7 (Good) | 13 (Good) | 9.5 (Good) | 8.7 (Good) | 5.4 (Good) | 9.6 (Good) | 12 (Good) | 12 (Good) | 14 (Good) | 10 (Good) | 12 (Good) | 10 (Good) | 11 (Good) | 11 (Good) |
PM10 6.7 (Good)
particulate matter (PM10) suspended dustPM2,5 1.7 (Good)
particulate matter (PM2.5) dustCO 100 (Good)
carbon monoxide (CO)NO2 7.6 (Good)
nitrogen dioxide (NO2)O3 0.02 (Good)
ozone (O3)SO2 8.6 (Good)
sulfur dioxide (SO2)Ma'anshan Tian Ping Fu Zhuang
| index | 2022-05-27 |
|---|---|
| pm10 | 32 |
| pm25 | 24 |
| co | 468 |
| no2 | 21 |
| o3 | 32 |
| so2 | 4.6 |
天平服装
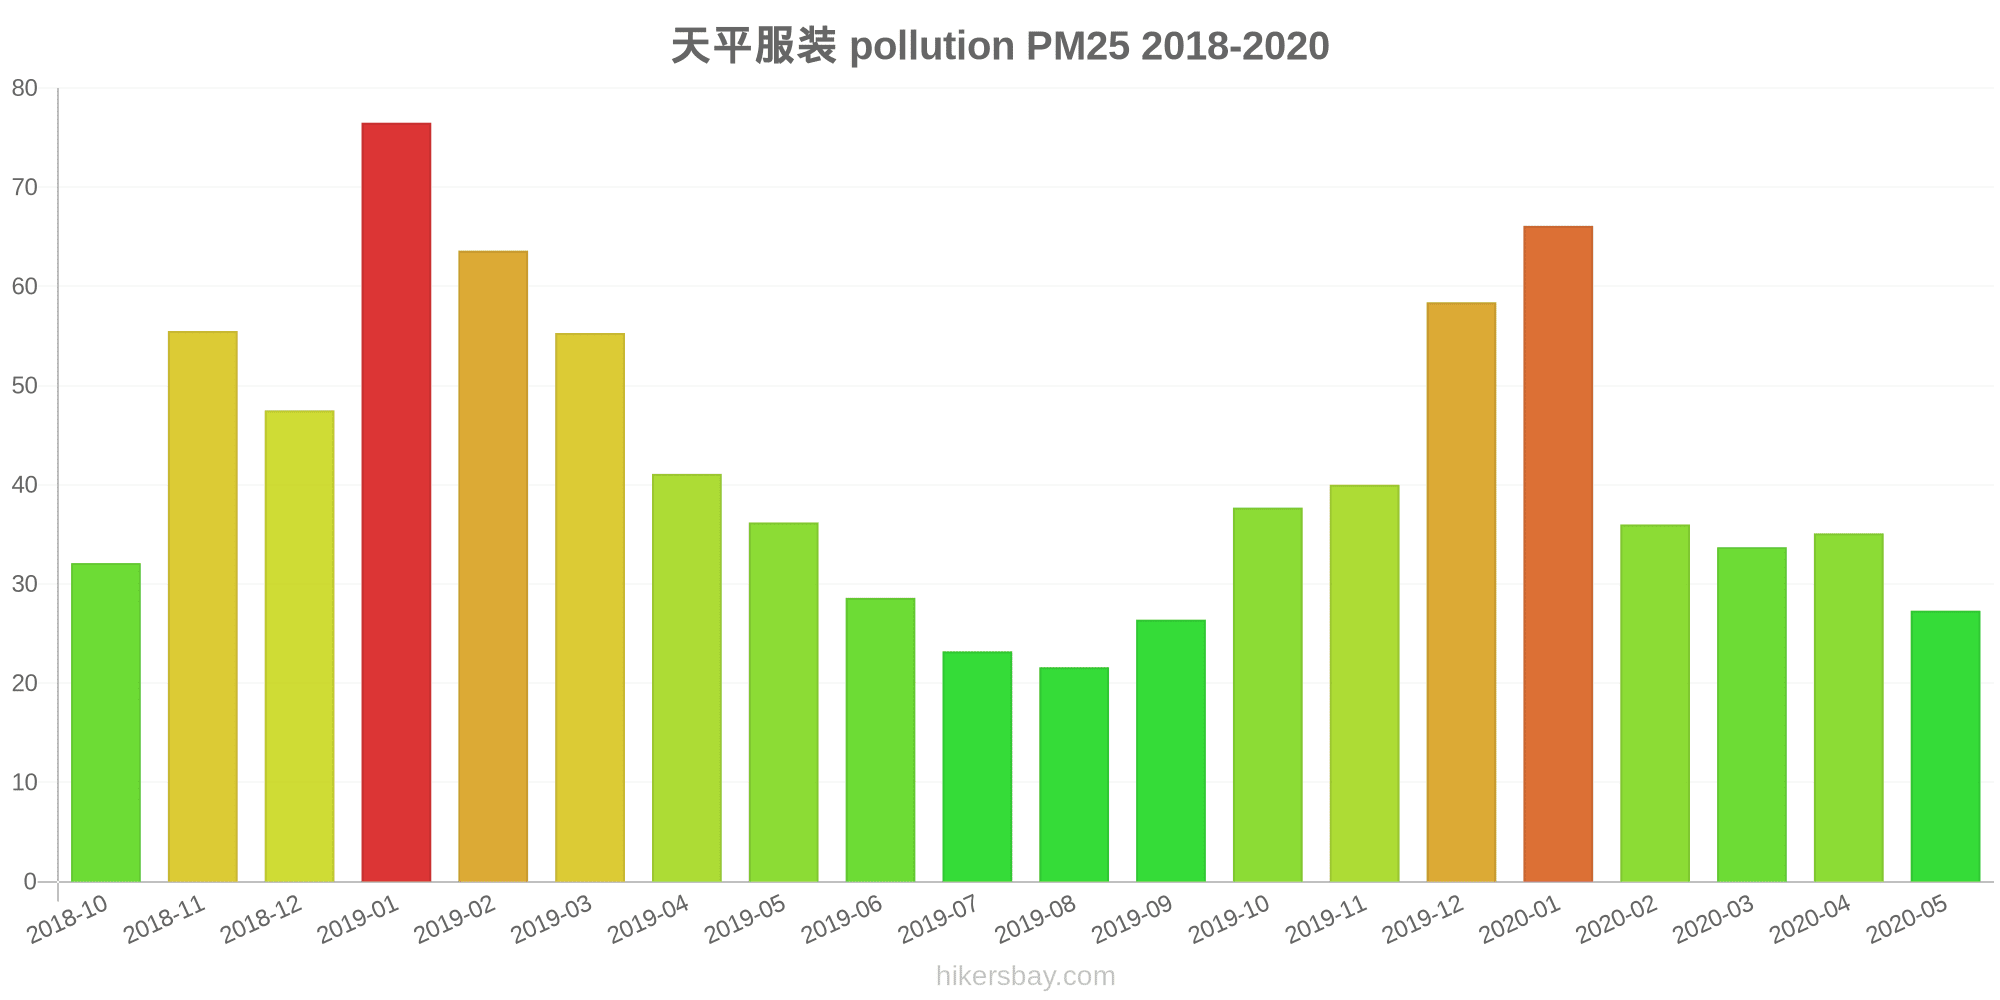
| index | 2020-05 | 2020-04 | 2020-03 | 2020-02 | 2020-01 | 2019-12 | 2019-11 | 2019-10 | 2019-09 | 2019-08 | 2019-07 | 2019-06 | 2019-05 | 2019-04 | 2019-03 | 2019-02 | 2019-01 | 2018-12 | 2018-11 | 2018-10 |
|---|---|---|---|---|---|---|---|---|---|---|---|---|---|---|---|---|---|---|---|---|
| pm25 | 27 | 35 | 34 | 36 | 66 | 58 | 40 | 38 | 26 | 22 | 23 | 29 | 36 | 41 | 55 | 64 | 77 | 48 | 56 | 32 |
| co | 808 | 699 | 567 | 596 | 818 | 768 | 805 | 920 | 811 | 799 | 851 | 897 | 801 | 924 | 893 | 985 | 1 | 1 | 1 | 930 |
| no2 | 22 | 40 | 35 | 21 | 32 | 46 | 41 | 36 | 22 | 23 | 19 | 25 | 29 | 36 | 44 | 37 | 55 | 43 | 37 | 27 |
| o3 | 138 | 127 | 94 | 78 | 57 | 62 | 96 | 120 | 173 | 170 | 154 | 195 | 165 | 132 | 110 | 77 | 65 | 54 | 85 | 120 |
| pm10 | 55 | 65 | 55 | 49 | 76 | 77 | 87 | 84 | 54 | 43 | 47 | 54 | 73 | 66 | 83 | 79 | 94 | 82 | 88 | 77 |
| so2 | 7.3 | 11 | 9.7 | 7.3 | 8.2 | 8.2 | 8.7 | 13 | 9.5 | 8.7 | 5.4 | 9.6 | 12 | 12 | 14 | 10 | 12 | 10 | 11 | 11 |