Air Pollution in Shuangta: Real-time Air Quality Index and smog alert.
Pollution and air quality forecast for Shuangta. Today is Tuesday, June 2, 2026. The following air pollution values have been recorded for Shuangta:- particulate matter (PM10) suspended dust - 179 (Very bad Hazardous)
- particulate matter (PM2.5) dust - 35 (Unhealthy for Sensitive Groups)
- ozone (O3) - 0 (Good)
- nitrogen dioxide (NO2) - 0 (Good)
- sulfur dioxide (SO2) - 0 (Good)

What is the air quality in Shuangta today? Is the air polluted in Shuangta?. Is there smog?
What is the level of PM10 today in Shuangta? (particulate matter (PM10) suspended dust)
The current level of particulate matter PM10 in Shuangta is:
179 (Very bad Hazardous)
The highest PM10 values usually occur in month: 77 (January 2019).
The lowest value of particulate matter PM10 pollution in Shuangta is usually recorded in: August (31).
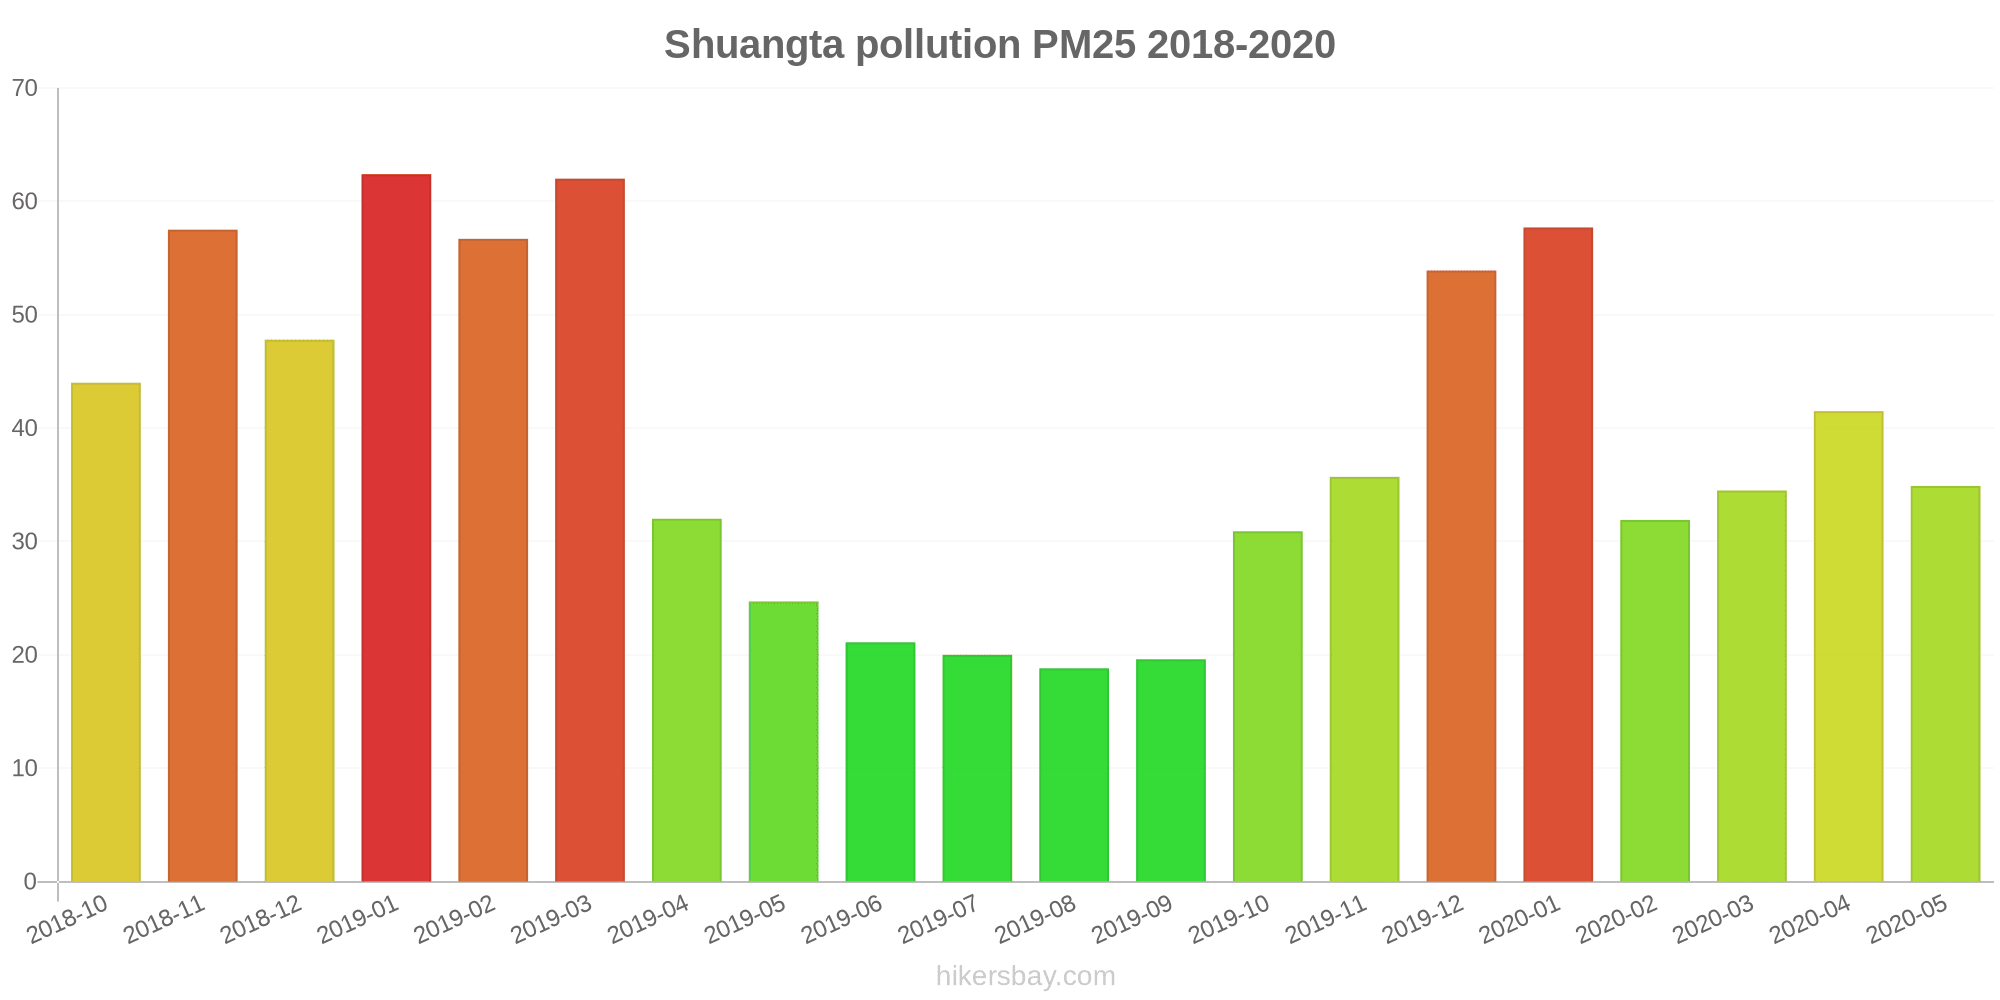
What is the current level of PM2.5 in Shuangta? (particulate matter (PM2.5) dust)
Today's PM2.5 level is:
35 (Unhealthy for Sensitive Groups)
For comparison, the highest level of PM2.5 in Shuangta in the last 7 days was: 56 (Friday, May 27, 2022) and the lowest: 56 (Friday, May 27, 2022).
The highest PM2.5 values were recorded: 62 (January 2019).
The lowest level of particulate matter PM2.5 pollution occurs in month: August (19).
How is the O3 level today in Shuangta? (ozone (O3))
0 (Good)
How high is the level of NO2? (nitrogen dioxide (NO2))
0 (Good)
What is the level of SO2 pollution? (sulfur dioxide (SO2))
0 (Good)
Current data Friday, May 27, 2022, 12:00 PM
PM10 179 (Very bad Hazardous)
PM2,5 35 (Unhealthy for Sensitive Groups)
O3 0 (Good)
NO2 0 (Good)
SO2 0 (Good)
Data on air pollution from recent days in Shuangta
index
2022-05-27
pm10
56
Unhealthy for Sensitive Groups
pm25
56
Unhealthy
o3
0
Good
no2
0
Good
so2
0
Good
data source »
Air pollution in Shuangta from October 2018 to May 2020

index
2020-05
2020-04
2020-03
2020-02
2020-01
2019-12
2019-11
2019-10
2019-09
2019-08
2019-07
2019-06
2019-05
2019-04
2019-03
2019-02
2019-01
2018-12
2018-11
2018-10
pm25
35 (Moderate)
42 (Unhealthy for Sensitive Groups)
35 (Moderate)
32 (Moderate)
58 (Unhealthy)
54 (Unhealthy for Sensitive Groups)
36 (Unhealthy for Sensitive Groups)
31 (Moderate)
20 (Moderate)
19 (Moderate)
20 (Moderate)
21 (Moderate)
25 (Moderate)
32 (Moderate)
62 (Unhealthy)
57 (Unhealthy)
62 (Unhealthy)
48 (Unhealthy for Sensitive Groups)
58 (Unhealthy)
44 (Unhealthy for Sensitive Groups)
co
775 (Good)
529 (Good)
634 (Good)
646 (Good)
924 (Good)
922 (Good)
569 (Good)
659 (Good)
646 (Good)
625 (Good)
622 (Good)
670 (Good)
450 (Good)
575 (Good)
788 (Good)
893 (Good)
959 (Good)
740 (Good)
805 (Good)
748 (Good)
no2
23 (Good)
44 (Moderate)
37 (Good)
20 (Good)
37 (Good)
56 (Moderate)
54 (Moderate)
52 (Moderate)
40 (Good)
24 (Good)
29 (Good)
29 (Good)
32 (Good)
48 (Moderate)
68 (Moderate)
39 (Good)
59 (Moderate)
51 (Moderate)
56 (Moderate)
42 (Moderate)
o3
154 (Unhealthy)
149 (Unhealthy for Sensitive Groups)
105 (Moderate)
94 (Moderate)
68 (Good)
73 (Moderate)
96 (Moderate)
117 (Moderate)
127 (Unhealthy for Sensitive Groups)
142 (Unhealthy for Sensitive Groups)
145 (Unhealthy for Sensitive Groups)
159 (Unhealthy)
158 (Unhealthy)
135 (Unhealthy for Sensitive Groups)
107 (Moderate)
68 (Good)
59 (Good)
51 (Good)
76 (Moderate)
105 (Moderate)
pm10
59 (Unhealthy for Sensitive Groups)
72 (Unhealthy for Sensitive Groups)
50 (Moderate)
34 (Moderate)
49 (Moderate)
59 (Unhealthy for Sensitive Groups)
65 (Unhealthy for Sensitive Groups)
62 (Unhealthy for Sensitive Groups)
38 (Moderate)
31 (Moderate)
33 (Moderate)
34 (Moderate)
52 (Unhealthy for Sensitive Groups)
54 (Unhealthy for Sensitive Groups)
63 (Unhealthy for Sensitive Groups)
48 (Moderate)
77 (Unhealthy for Sensitive Groups)
64 (Unhealthy for Sensitive Groups)
59 (Unhealthy for Sensitive Groups)
69 (Unhealthy for Sensitive Groups)
so2
4 (Good)
5 (Good)
6.6 (Good)
5.1 (Good)
5.1 (Good)
5.2 (Good)
6.6 (Good)
6.5 (Good)
4.5 (Good)
4.4 (Good)
4 (Good)
3.8 (Good)
3.8 (Good)
9.1 (Good)
7.7 (Good)
5.7 (Good)
9.1 (Good)
8.4 (Good)
6.1 (Good)
7.8 (Good)
data source »
Quality of life in Shuangta
Green and Parks in the City
Shuangta
75%
Mongolia: 27%
Bhutan: 82%
Hong Kong: 52%
Myanmar: 33%
particulate matter PM2.5
Shuangta
46 (Unhealthy for Sensitive Groups)
Pleasure of spending time in the city
Shuangta
40%
Mongolia: 22%
Bhutan: 61%
Hong Kong: 43%
Myanmar: 24%
particulate matter PM10
Shuangta
72 (Unhealthy for Sensitive Groups)
Air Pollution
Shuangta
78%
Mongolia: 87%
Bhutan: 45%
Hong Kong: 67%
Myanmar: 83%
Garbage Disposal
Shuangta
68%
Mongolia: 27%
Bhutan: 47%
Hong Kong: 52%
Myanmar: 12%
Availability and quality of drinking water
Shuangta
47%
Mongolia: 46%
Bhutan: 64%
Hong Kong: 66%
Myanmar: 34%
Cleanliness and tidiness
Shuangta
69%
Mongolia: 29%
Bhutan: 57%
Hong Kong: 54%
Myanmar: 18%
Noise and Light pollution
Shuangta
47%
Mongolia: 48%
Bhutan: 55%
Hong Kong: 66%
Myanmar: 52%
Water Pollution
Shuangta
72%
Mongolia: 68%
Bhutan: 56%
Hong Kong: 53%
Myanmar: 74%
Source: Numbeo
南门
Friday, May 27, 2022, 12:00 PM
PM10 179 (Very bad Hazardous)
particulate matter (PM10) suspended dust
PM2,5 35 (Unhealthy for Sensitive Groups)
particulate matter (PM2.5) dust
O3 0.04 (Good)
ozone (O3)
NO2 0 (Good)
nitrogen dioxide (NO2)
SO2 0 (Good)
sulfur dioxide (SO2)
南门
index
2022-05-27
pm10
56
pm25
56
o3
0.03
no2
0
so2
0
南门
2018-10 2020-05

index
2020-05
2020-04
2020-03
2020-02
2020-01
2019-12
2019-11
2019-10
2019-09
2019-08
2019-07
2019-06
2019-05
2019-04
2019-03
2019-02
2019-01
2018-12
2018-11
2018-10
pm25
35
42
35
32
58
54
36
31
20
19
20
21
25
32
62
57
62
48
58
44
co
775
529
634
646
924
922
569
659
646
625
622
670
450
575
788
893
959
740
805
748
no2
23
44
37
20
37
56
54
52
40
24
29
29
32
48
68
39
59
51
56
42
o3
154
149
105
94
68
73
96
117
127
142
145
159
158
135
107
68
59
51
76
105
pm10
59
72
50
34
49
59
65
62
38
31
33
34
52
54
63
48
77
64
59
69
so2
4
5
6.6
5.1
5.1
5.2
6.6
6.5
4.5
4.4
4
3.8
3.8
9.1
7.7
5.7
9.1
8.4
6.1
7.8
* Pollution data source:
https://openaq.org
(ChinaAQIData)
The data is licensed under CC-By 4.0
PM10 179 (Very bad Hazardous)
PM2,5 35 (Unhealthy for Sensitive Groups)
O3 0 (Good)
NO2 0 (Good)
SO2 0 (Good)
Data on air pollution from recent days in Shuangta
| index | 2022-05-27 |
|---|---|
| pm10 | 56 Unhealthy for Sensitive Groups |
| pm25 | 56 Unhealthy |
| o3 | 0 Good |
| no2 | 0 Good |
| so2 | 0 Good |
| index | 2020-05 | 2020-04 | 2020-03 | 2020-02 | 2020-01 | 2019-12 | 2019-11 | 2019-10 | 2019-09 | 2019-08 | 2019-07 | 2019-06 | 2019-05 | 2019-04 | 2019-03 | 2019-02 | 2019-01 | 2018-12 | 2018-11 | 2018-10 |
|---|---|---|---|---|---|---|---|---|---|---|---|---|---|---|---|---|---|---|---|---|
| pm25 | 35 (Moderate) | 42 (Unhealthy for Sensitive Groups) | 35 (Moderate) | 32 (Moderate) | 58 (Unhealthy) | 54 (Unhealthy for Sensitive Groups) | 36 (Unhealthy for Sensitive Groups) | 31 (Moderate) | 20 (Moderate) | 19 (Moderate) | 20 (Moderate) | 21 (Moderate) | 25 (Moderate) | 32 (Moderate) | 62 (Unhealthy) | 57 (Unhealthy) | 62 (Unhealthy) | 48 (Unhealthy for Sensitive Groups) | 58 (Unhealthy) | 44 (Unhealthy for Sensitive Groups) |
| co | 775 (Good) | 529 (Good) | 634 (Good) | 646 (Good) | 924 (Good) | 922 (Good) | 569 (Good) | 659 (Good) | 646 (Good) | 625 (Good) | 622 (Good) | 670 (Good) | 450 (Good) | 575 (Good) | 788 (Good) | 893 (Good) | 959 (Good) | 740 (Good) | 805 (Good) | 748 (Good) |
| no2 | 23 (Good) | 44 (Moderate) | 37 (Good) | 20 (Good) | 37 (Good) | 56 (Moderate) | 54 (Moderate) | 52 (Moderate) | 40 (Good) | 24 (Good) | 29 (Good) | 29 (Good) | 32 (Good) | 48 (Moderate) | 68 (Moderate) | 39 (Good) | 59 (Moderate) | 51 (Moderate) | 56 (Moderate) | 42 (Moderate) |
| o3 | 154 (Unhealthy) | 149 (Unhealthy for Sensitive Groups) | 105 (Moderate) | 94 (Moderate) | 68 (Good) | 73 (Moderate) | 96 (Moderate) | 117 (Moderate) | 127 (Unhealthy for Sensitive Groups) | 142 (Unhealthy for Sensitive Groups) | 145 (Unhealthy for Sensitive Groups) | 159 (Unhealthy) | 158 (Unhealthy) | 135 (Unhealthy for Sensitive Groups) | 107 (Moderate) | 68 (Good) | 59 (Good) | 51 (Good) | 76 (Moderate) | 105 (Moderate) |
| pm10 | 59 (Unhealthy for Sensitive Groups) | 72 (Unhealthy for Sensitive Groups) | 50 (Moderate) | 34 (Moderate) | 49 (Moderate) | 59 (Unhealthy for Sensitive Groups) | 65 (Unhealthy for Sensitive Groups) | 62 (Unhealthy for Sensitive Groups) | 38 (Moderate) | 31 (Moderate) | 33 (Moderate) | 34 (Moderate) | 52 (Unhealthy for Sensitive Groups) | 54 (Unhealthy for Sensitive Groups) | 63 (Unhealthy for Sensitive Groups) | 48 (Moderate) | 77 (Unhealthy for Sensitive Groups) | 64 (Unhealthy for Sensitive Groups) | 59 (Unhealthy for Sensitive Groups) | 69 (Unhealthy for Sensitive Groups) |
| so2 | 4 (Good) | 5 (Good) | 6.6 (Good) | 5.1 (Good) | 5.1 (Good) | 5.2 (Good) | 6.6 (Good) | 6.5 (Good) | 4.5 (Good) | 4.4 (Good) | 4 (Good) | 3.8 (Good) | 3.8 (Good) | 9.1 (Good) | 7.7 (Good) | 5.7 (Good) | 9.1 (Good) | 8.4 (Good) | 6.1 (Good) | 7.8 (Good) |
Green and Parks in the City
Shuangta 75%
Mongolia: 27% Bhutan: 82% Hong Kong: 52% Myanmar: 33%particulate matter PM2.5
Shuangta 46 (Unhealthy for Sensitive Groups)
Pleasure of spending time in the city
Shuangta 40%
Mongolia: 22% Bhutan: 61% Hong Kong: 43% Myanmar: 24%particulate matter PM10
Shuangta 72 (Unhealthy for Sensitive Groups)
Air Pollution
Shuangta 78%
Mongolia: 87% Bhutan: 45% Hong Kong: 67% Myanmar: 83%Garbage Disposal
Shuangta 68%
Mongolia: 27% Bhutan: 47% Hong Kong: 52% Myanmar: 12%Availability and quality of drinking water
Shuangta 47%
Mongolia: 46% Bhutan: 64% Hong Kong: 66% Myanmar: 34%Cleanliness and tidiness
Shuangta 69%
Mongolia: 29% Bhutan: 57% Hong Kong: 54% Myanmar: 18%Noise and Light pollution
Shuangta 47%
Mongolia: 48% Bhutan: 55% Hong Kong: 66% Myanmar: 52%Water Pollution
Shuangta 72%
Mongolia: 68% Bhutan: 56% Hong Kong: 53% Myanmar: 74%PM10 179 (Very bad Hazardous)
particulate matter (PM10) suspended dustPM2,5 35 (Unhealthy for Sensitive Groups)
particulate matter (PM2.5) dustO3 0.04 (Good)
ozone (O3)NO2 0 (Good)
nitrogen dioxide (NO2)SO2 0 (Good)
sulfur dioxide (SO2)南门
| index | 2022-05-27 |
|---|---|
| pm10 | 56 |
| pm25 | 56 |
| o3 | 0.03 |
| no2 | 0 |
| so2 | 0 |
南门

| index | 2020-05 | 2020-04 | 2020-03 | 2020-02 | 2020-01 | 2019-12 | 2019-11 | 2019-10 | 2019-09 | 2019-08 | 2019-07 | 2019-06 | 2019-05 | 2019-04 | 2019-03 | 2019-02 | 2019-01 | 2018-12 | 2018-11 | 2018-10 |
|---|---|---|---|---|---|---|---|---|---|---|---|---|---|---|---|---|---|---|---|---|
| pm25 | 35 | 42 | 35 | 32 | 58 | 54 | 36 | 31 | 20 | 19 | 20 | 21 | 25 | 32 | 62 | 57 | 62 | 48 | 58 | 44 |
| co | 775 | 529 | 634 | 646 | 924 | 922 | 569 | 659 | 646 | 625 | 622 | 670 | 450 | 575 | 788 | 893 | 959 | 740 | 805 | 748 |
| no2 | 23 | 44 | 37 | 20 | 37 | 56 | 54 | 52 | 40 | 24 | 29 | 29 | 32 | 48 | 68 | 39 | 59 | 51 | 56 | 42 |
| o3 | 154 | 149 | 105 | 94 | 68 | 73 | 96 | 117 | 127 | 142 | 145 | 159 | 158 | 135 | 107 | 68 | 59 | 51 | 76 | 105 |
| pm10 | 59 | 72 | 50 | 34 | 49 | 59 | 65 | 62 | 38 | 31 | 33 | 34 | 52 | 54 | 63 | 48 | 77 | 64 | 59 | 69 |
| so2 | 4 | 5 | 6.6 | 5.1 | 5.1 | 5.2 | 6.6 | 6.5 | 4.5 | 4.4 | 4 | 3.8 | 3.8 | 9.1 | 7.7 | 5.7 | 9.1 | 8.4 | 6.1 | 7.8 |