Air Pollution in Songlong: Real-time Air Quality Index and smog alert.
Pollution and air quality forecast for Songlong. Today is Tuesday, June 2, 2026. The following air pollution values have been recorded for Songlong:- particulate matter (PM10) suspended dust - 179 (Very bad Hazardous)
- particulate matter (PM2.5) dust - 35 (Unhealthy for Sensitive Groups)
- ozone (O3) - 0 (Good)
- nitrogen dioxide (NO2) - 0 (Good)
- sulfur dioxide (SO2) - 0 (Good)

What is the air quality in Songlong today? Is the air polluted in Songlong?. Is there smog?
What is the level of PM10 today in Songlong? (particulate matter (PM10) suspended dust)
The current level of particulate matter PM10 in Songlong is:
179 (Very bad Hazardous)
The highest PM10 values usually occur in month: 106 (January 2019).
The lowest value of particulate matter PM10 pollution in Songlong is usually recorded in: July (51).
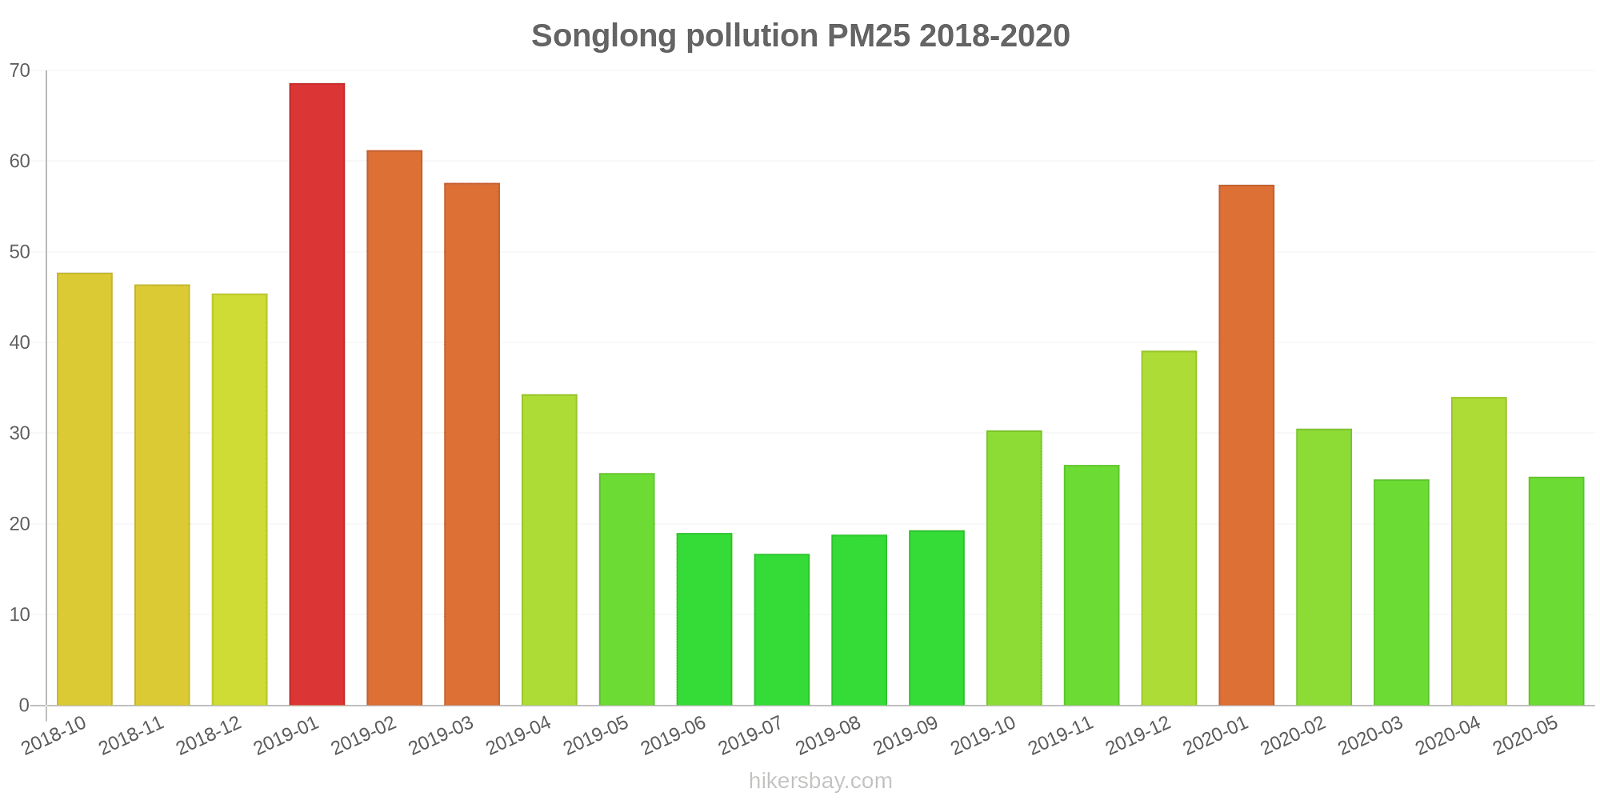
What is the current level of PM2.5 in Songlong? (particulate matter (PM2.5) dust)
Today's PM2.5 level is:
35 (Unhealthy for Sensitive Groups)
For comparison, the highest level of PM2.5 in Songlong in the last 7 days was: 56 (Friday, May 27, 2022) and the lowest: 56 (Friday, May 27, 2022).
The highest PM2.5 values were recorded: 69 (January 2019).
The lowest level of particulate matter PM2.5 pollution occurs in month: July (17).
How is the O3 level today in Songlong? (ozone (O3))
0 (Good)
How high is the level of NO2? (nitrogen dioxide (NO2))
0 (Good)
What is the level of SO2 pollution? (sulfur dioxide (SO2))
0 (Good)
Current data Friday, May 27, 2022, 12:00 PM
PM10 179 (Very bad Hazardous)
PM2,5 35 (Unhealthy for Sensitive Groups)
O3 0 (Good)
NO2 0 (Good)
SO2 0 (Good)
Data on air pollution from recent days in Songlong
index
2022-05-27
pm10
56
Unhealthy for Sensitive Groups
pm25
56
Unhealthy
o3
0
Good
no2
0
Good
so2
0
Good
data source »
Air pollution in Songlong from October 2018 to May 2020
index
2020-05
2020-04
2020-03
2020-02
2020-01
2019-12
2019-11
2019-10
2019-09
2019-08
2019-07
2019-06
2019-05
2019-04
2019-03
2019-02
2019-01
2018-12
2018-11
2018-10
pm25
25 (Moderate)
34 (Moderate)
25 (Moderate)
31 (Moderate)
57 (Unhealthy)
39 (Unhealthy for Sensitive Groups)
27 (Moderate)
30 (Moderate)
19 (Moderate)
19 (Moderate)
17 (Moderate)
19 (Moderate)
26 (Moderate)
34 (Moderate)
58 (Unhealthy)
61 (Unhealthy)
69 (Unhealthy)
45 (Unhealthy for Sensitive Groups)
46 (Unhealthy for Sensitive Groups)
48 (Unhealthy for Sensitive Groups)
co
1 (Good)
803 (Good)
999 (Good)
773 (Good)
1 (Good)
1 (Good)
753 (Good)
1 (Good)
802 (Good)
541 (Good)
477 (Good)
665 (Good)
736 (Good)
888 (Good)
791 (Good)
706 (Good)
961 (Good)
922 (Good)
808 (Good)
791 (Good)
no2
27 (Good)
39 (Good)
32 (Good)
15 (Good)
34 (Good)
56 (Moderate)
50 (Moderate)
44 (Moderate)
34 (Good)
23 (Good)
27 (Good)
27 (Good)
33 (Good)
31 (Good)
40 (Moderate)
39 (Good)
63 (Moderate)
57 (Moderate)
63 (Moderate)
43 (Moderate)
o3
166 (Unhealthy)
174 (Unhealthy)
119 (Moderate)
101 (Moderate)
73 (Moderate)
75 (Moderate)
102 (Moderate)
132 (Unhealthy for Sensitive Groups)
151 (Unhealthy)
163 (Unhealthy)
154 (Unhealthy)
172 (Unhealthy)
174 (Unhealthy)
150 (Unhealthy)
128 (Unhealthy for Sensitive Groups)
83 (Moderate)
65 (Good)
62 (Good)
91 (Moderate)
133 (Unhealthy for Sensitive Groups)
pm10
65 (Unhealthy for Sensitive Groups)
77 (Unhealthy for Sensitive Groups)
62 (Unhealthy for Sensitive Groups)
57 (Unhealthy for Sensitive Groups)
87 (Unhealthy)
94 (Unhealthy)
90 (Unhealthy)
91 (Unhealthy)
57 (Unhealthy for Sensitive Groups)
54 (Unhealthy for Sensitive Groups)
51 (Unhealthy for Sensitive Groups)
55 (Unhealthy for Sensitive Groups)
82 (Unhealthy)
84 (Unhealthy)
103 (Unhealthy)
87 (Unhealthy)
106 (Unhealthy)
86 (Unhealthy)
72 (Unhealthy for Sensitive Groups)
84 (Unhealthy)
so2
6.2 (Good)
7.6 (Good)
9.6 (Good)
8 (Good)
8.3 (Good)
10 (Good)
9.9 (Good)
9.9 (Good)
12 (Good)
11 (Good)
10 (Good)
7.4 (Good)
13 (Good)
13 (Good)
11 (Good)
8.5 (Good)
12 (Good)
12 (Good)
8.5 (Good)
9.3 (Good)
data source »
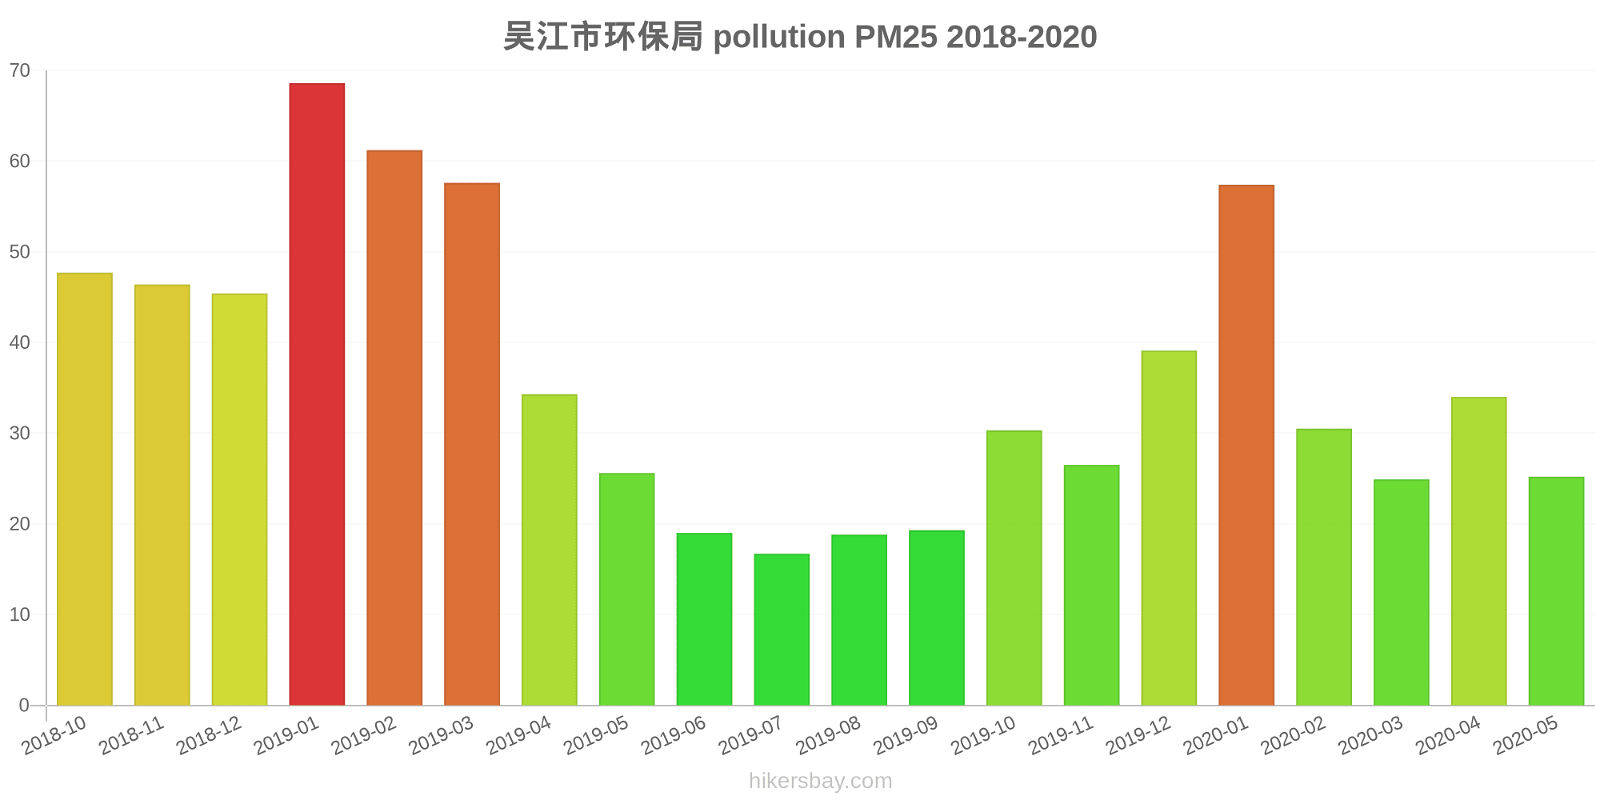
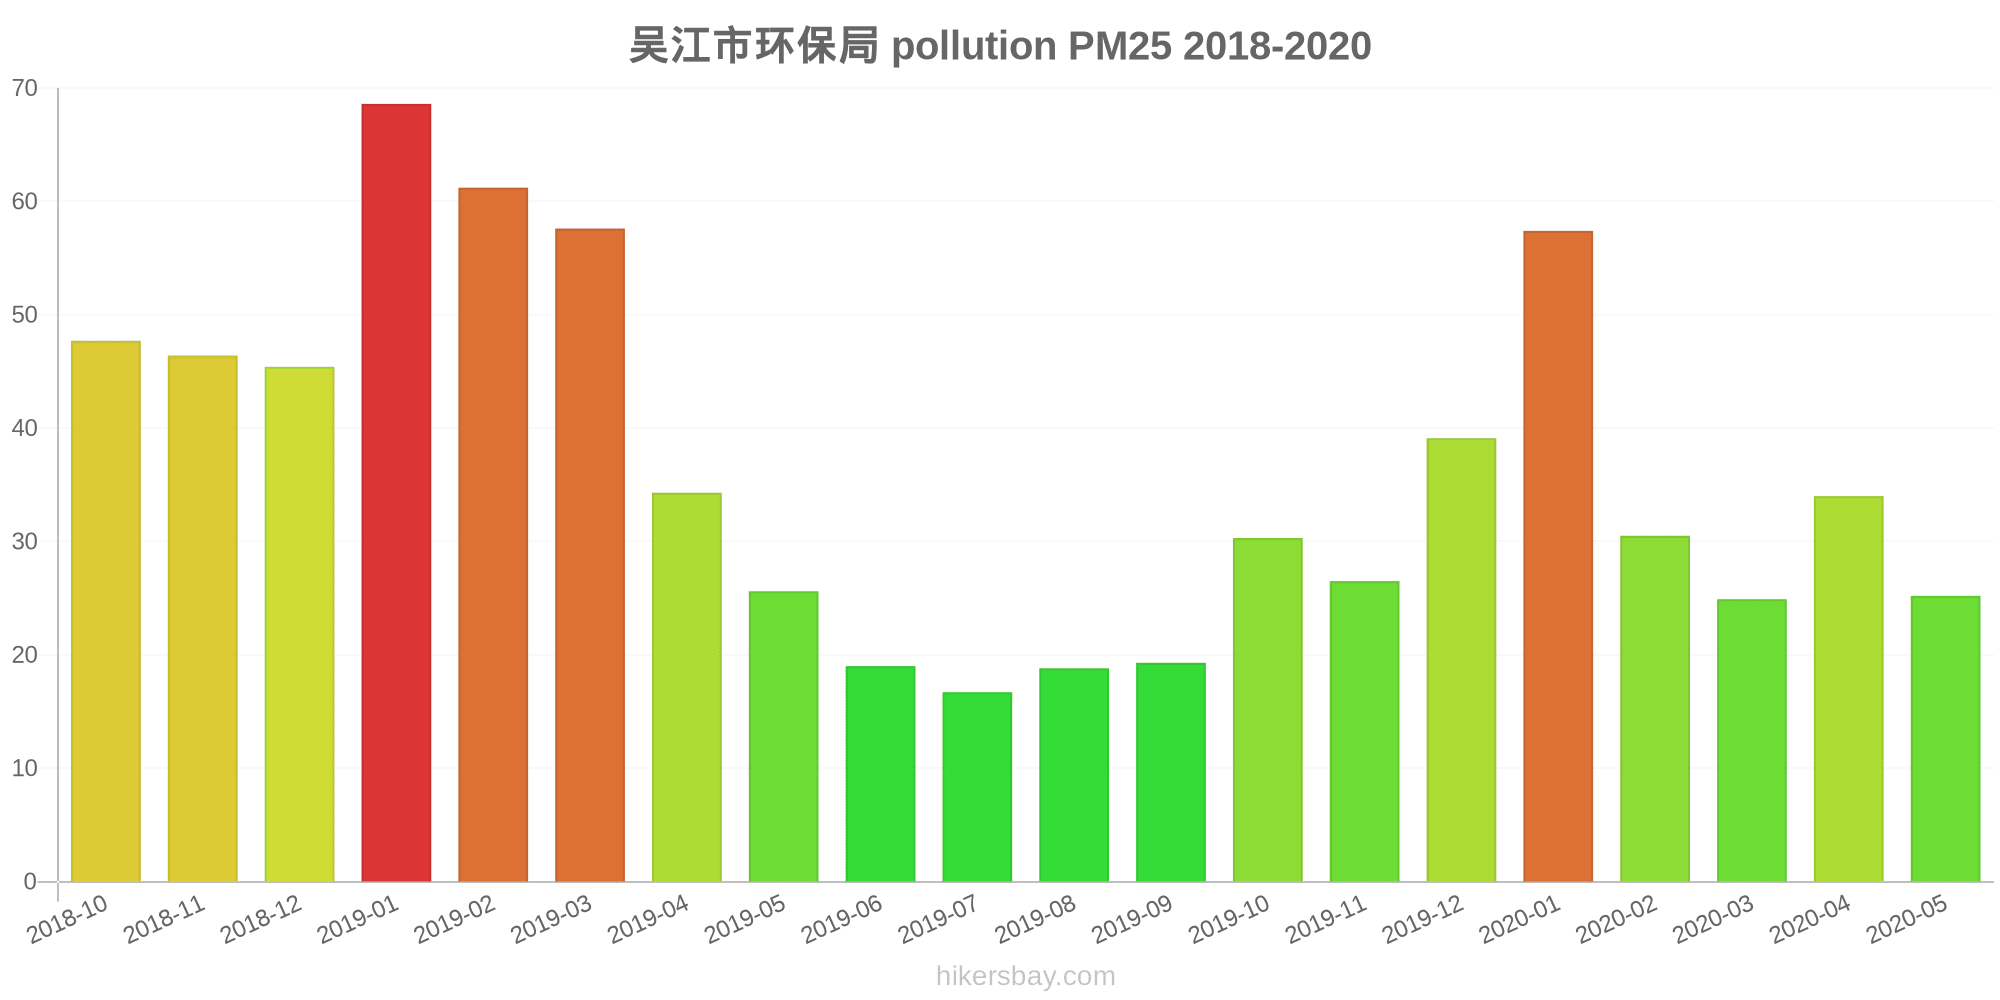
吴江市环保局
Friday, May 27, 2022, 12:00 PM
PM10 179 (Very bad Hazardous)
particulate matter (PM10) suspended dust
PM2,5 35 (Unhealthy for Sensitive Groups)
particulate matter (PM2.5) dust
O3 0.04 (Good)
ozone (O3)
NO2 0 (Good)
nitrogen dioxide (NO2)
SO2 0 (Good)
sulfur dioxide (SO2)
吴江市环保局
index
2022-05-27
pm10
56
pm25
56
o3
0.03
no2
0
so2
0
吴江市环保局
2018-10 2020-05
index
2020-05
2020-04
2020-03
2020-02
2020-01
2019-12
2019-11
2019-10
2019-09
2019-08
2019-07
2019-06
2019-05
2019-04
2019-03
2019-02
2019-01
2018-12
2018-11
2018-10
pm25
25
34
25
31
57
39
27
30
19
19
17
19
26
34
58
61
69
45
46
48
co
1
803
999
773
1
1
753
1
802
541
477
665
736
888
791
706
961
922
808
791
no2
27
39
32
15
34
56
50
44
34
23
27
27
33
31
40
39
63
57
63
43
o3
166
174
119
101
73
75
102
132
151
163
154
172
174
150
128
83
65
62
91
133
pm10
65
77
62
57
87
94
90
91
57
54
51
55
82
84
103
87
106
86
72
84
so2
6.2
7.6
9.6
8
8.3
10
9.9
9.9
12
11
10
7.4
13
13
11
8.5
12
12
8.5
9.3
* Pollution data source:
https://openaq.org
(ChinaAQIData)
The data is licensed under CC-By 4.0
PM10 179 (Very bad Hazardous)
PM2,5 35 (Unhealthy for Sensitive Groups)
O3 0 (Good)
NO2 0 (Good)
SO2 0 (Good)
Data on air pollution from recent days in Songlong
| index | 2022-05-27 |
|---|---|
| pm10 | 56 Unhealthy for Sensitive Groups |
| pm25 | 56 Unhealthy |
| o3 | 0 Good |
| no2 | 0 Good |
| so2 | 0 Good |

| index | 2020-05 | 2020-04 | 2020-03 | 2020-02 | 2020-01 | 2019-12 | 2019-11 | 2019-10 | 2019-09 | 2019-08 | 2019-07 | 2019-06 | 2019-05 | 2019-04 | 2019-03 | 2019-02 | 2019-01 | 2018-12 | 2018-11 | 2018-10 |
|---|---|---|---|---|---|---|---|---|---|---|---|---|---|---|---|---|---|---|---|---|
| pm25 | 25 (Moderate) | 34 (Moderate) | 25 (Moderate) | 31 (Moderate) | 57 (Unhealthy) | 39 (Unhealthy for Sensitive Groups) | 27 (Moderate) | 30 (Moderate) | 19 (Moderate) | 19 (Moderate) | 17 (Moderate) | 19 (Moderate) | 26 (Moderate) | 34 (Moderate) | 58 (Unhealthy) | 61 (Unhealthy) | 69 (Unhealthy) | 45 (Unhealthy for Sensitive Groups) | 46 (Unhealthy for Sensitive Groups) | 48 (Unhealthy for Sensitive Groups) |
| co | 1 (Good) | 803 (Good) | 999 (Good) | 773 (Good) | 1 (Good) | 1 (Good) | 753 (Good) | 1 (Good) | 802 (Good) | 541 (Good) | 477 (Good) | 665 (Good) | 736 (Good) | 888 (Good) | 791 (Good) | 706 (Good) | 961 (Good) | 922 (Good) | 808 (Good) | 791 (Good) |
| no2 | 27 (Good) | 39 (Good) | 32 (Good) | 15 (Good) | 34 (Good) | 56 (Moderate) | 50 (Moderate) | 44 (Moderate) | 34 (Good) | 23 (Good) | 27 (Good) | 27 (Good) | 33 (Good) | 31 (Good) | 40 (Moderate) | 39 (Good) | 63 (Moderate) | 57 (Moderate) | 63 (Moderate) | 43 (Moderate) |
| o3 | 166 (Unhealthy) | 174 (Unhealthy) | 119 (Moderate) | 101 (Moderate) | 73 (Moderate) | 75 (Moderate) | 102 (Moderate) | 132 (Unhealthy for Sensitive Groups) | 151 (Unhealthy) | 163 (Unhealthy) | 154 (Unhealthy) | 172 (Unhealthy) | 174 (Unhealthy) | 150 (Unhealthy) | 128 (Unhealthy for Sensitive Groups) | 83 (Moderate) | 65 (Good) | 62 (Good) | 91 (Moderate) | 133 (Unhealthy for Sensitive Groups) |
| pm10 | 65 (Unhealthy for Sensitive Groups) | 77 (Unhealthy for Sensitive Groups) | 62 (Unhealthy for Sensitive Groups) | 57 (Unhealthy for Sensitive Groups) | 87 (Unhealthy) | 94 (Unhealthy) | 90 (Unhealthy) | 91 (Unhealthy) | 57 (Unhealthy for Sensitive Groups) | 54 (Unhealthy for Sensitive Groups) | 51 (Unhealthy for Sensitive Groups) | 55 (Unhealthy for Sensitive Groups) | 82 (Unhealthy) | 84 (Unhealthy) | 103 (Unhealthy) | 87 (Unhealthy) | 106 (Unhealthy) | 86 (Unhealthy) | 72 (Unhealthy for Sensitive Groups) | 84 (Unhealthy) |
| so2 | 6.2 (Good) | 7.6 (Good) | 9.6 (Good) | 8 (Good) | 8.3 (Good) | 10 (Good) | 9.9 (Good) | 9.9 (Good) | 12 (Good) | 11 (Good) | 10 (Good) | 7.4 (Good) | 13 (Good) | 13 (Good) | 11 (Good) | 8.5 (Good) | 12 (Good) | 12 (Good) | 8.5 (Good) | 9.3 (Good) |
PM10 179 (Very bad Hazardous)
particulate matter (PM10) suspended dustPM2,5 35 (Unhealthy for Sensitive Groups)
particulate matter (PM2.5) dustO3 0.04 (Good)
ozone (O3)NO2 0 (Good)
nitrogen dioxide (NO2)SO2 0 (Good)
sulfur dioxide (SO2)吴江市环保局
| index | 2022-05-27 |
|---|---|
| pm10 | 56 |
| pm25 | 56 |
| o3 | 0.03 |
| no2 | 0 |
| so2 | 0 |
吴江市环保局
| index | 2020-05 | 2020-04 | 2020-03 | 2020-02 | 2020-01 | 2019-12 | 2019-11 | 2019-10 | 2019-09 | 2019-08 | 2019-07 | 2019-06 | 2019-05 | 2019-04 | 2019-03 | 2019-02 | 2019-01 | 2018-12 | 2018-11 | 2018-10 |
|---|---|---|---|---|---|---|---|---|---|---|---|---|---|---|---|---|---|---|---|---|
| pm25 | 25 | 34 | 25 | 31 | 57 | 39 | 27 | 30 | 19 | 19 | 17 | 19 | 26 | 34 | 58 | 61 | 69 | 45 | 46 | 48 |
| co | 1 | 803 | 999 | 773 | 1 | 1 | 753 | 1 | 802 | 541 | 477 | 665 | 736 | 888 | 791 | 706 | 961 | 922 | 808 | 791 |
| no2 | 27 | 39 | 32 | 15 | 34 | 56 | 50 | 44 | 34 | 23 | 27 | 27 | 33 | 31 | 40 | 39 | 63 | 57 | 63 | 43 |
| o3 | 166 | 174 | 119 | 101 | 73 | 75 | 102 | 132 | 151 | 163 | 154 | 172 | 174 | 150 | 128 | 83 | 65 | 62 | 91 | 133 |
| pm10 | 65 | 77 | 62 | 57 | 87 | 94 | 90 | 91 | 57 | 54 | 51 | 55 | 82 | 84 | 103 | 87 | 106 | 86 | 72 | 84 |
| so2 | 6.2 | 7.6 | 9.6 | 8 | 8.3 | 10 | 9.9 | 9.9 | 12 | 11 | 10 | 7.4 | 13 | 13 | 11 | 8.5 | 12 | 12 | 8.5 | 9.3 |