Air Pollution in Nanchansi: Real-time Air Quality Index and smog alert.
Pollution and air quality forecast for Nanchansi. Today is Tuesday, June 2, 2026. The following air pollution values have been recorded for Nanchansi:- particulate matter (PM10) suspended dust - 179 (Very bad Hazardous)
- particulate matter (PM2.5) dust - 35 (Unhealthy for Sensitive Groups)
- ozone (O3) - 0 (Good)
- nitrogen dioxide (NO2) - 0 (Good)
- sulfur dioxide (SO2) - 0 (Good)

What is the air quality in Nanchansi today? Is the air polluted in Nanchansi?. Is there smog?
What is the level of PM10 today in Nanchansi? (particulate matter (PM10) suspended dust)
The current level of particulate matter PM10 in Nanchansi is:
179 (Very bad Hazardous)
The highest PM10 values usually occur in month: 109 (January 2019).
The lowest value of particulate matter PM10 pollution in Nanchansi is usually recorded in: August (45).
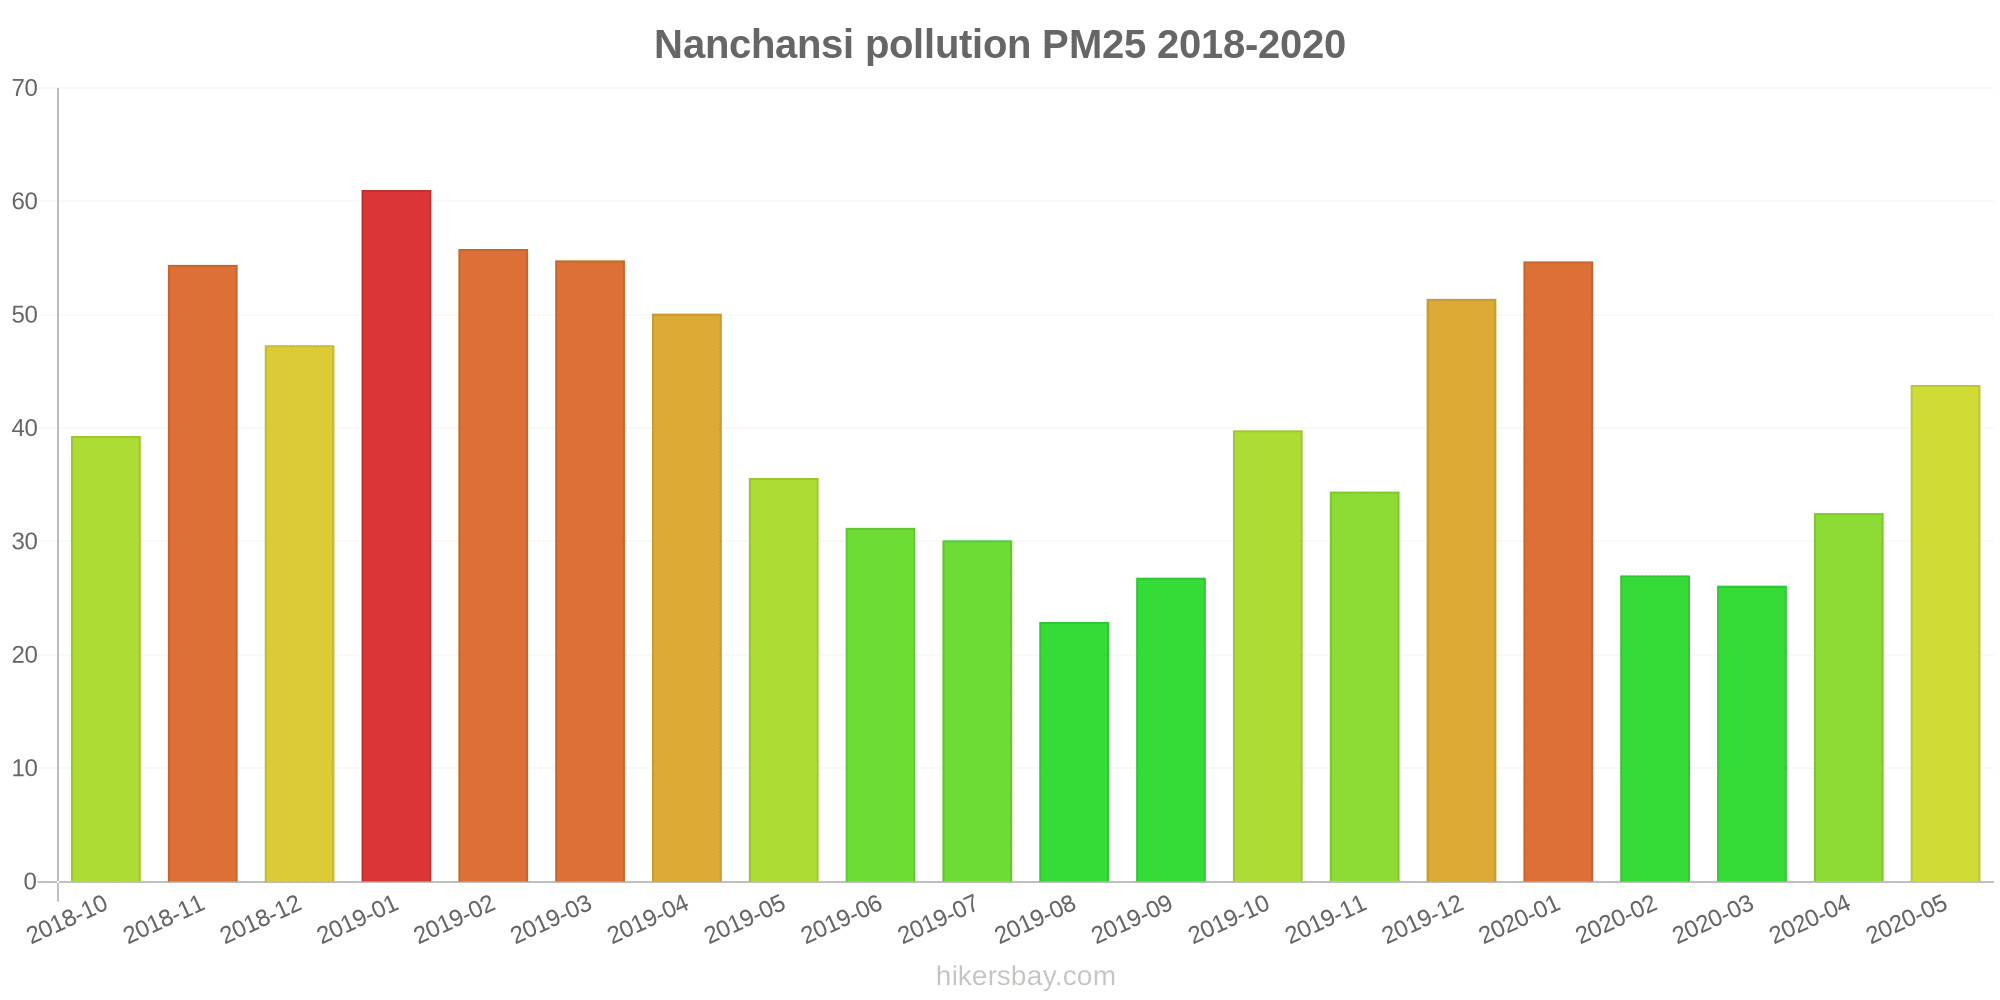
What is the current level of PM2.5 in Nanchansi? (particulate matter (PM2.5) dust)
Today's PM2.5 level is:
35 (Unhealthy for Sensitive Groups)
For comparison, the highest level of PM2.5 in Nanchansi in the last 7 days was: 56 (Friday, May 27, 2022) and the lowest: 56 (Friday, May 27, 2022).
The highest PM2.5 values were recorded: 61 (January 2019).
The lowest level of particulate matter PM2.5 pollution occurs in month: August (23).
How is the O3 level today in Nanchansi? (ozone (O3))
0 (Good)
How high is the level of NO2? (nitrogen dioxide (NO2))
0 (Good)
What is the level of SO2 pollution? (sulfur dioxide (SO2))
0 (Good)
Current data Friday, May 27, 2022, 12:00 PM
PM10 179 (Very bad Hazardous)
PM2,5 35 (Unhealthy for Sensitive Groups)
O3 0 (Good)
NO2 0 (Good)
SO2 0 (Good)
Data on air pollution from recent days in Nanchansi
index
2022-05-27
pm10
56
Unhealthy for Sensitive Groups
pm25
56
Unhealthy
o3
0
Good
no2
0
Good
so2
0
Good
data source »
Air pollution in Nanchansi from October 2018 to May 2020

index
2020-05
2020-04
2020-03
2020-02
2020-01
2019-12
2019-11
2019-10
2019-09
2019-08
2019-07
2019-06
2019-05
2019-04
2019-03
2019-02
2019-01
2018-12
2018-11
2018-10
o3
148 (Unhealthy for Sensitive Groups)
139 (Unhealthy for Sensitive Groups)
109 (Moderate)
95 (Moderate)
67 (Good)
70 (Moderate)
100 (Moderate)
124 (Unhealthy for Sensitive Groups)
160 (Unhealthy)
172 (Unhealthy)
174 (Unhealthy)
187 (Very Unhealthy)
171 (Unhealthy)
141 (Unhealthy for Sensitive Groups)
118 (Moderate)
75 (Moderate)
56 (Good)
51 (Good)
81 (Moderate)
120 (Unhealthy for Sensitive Groups)
pm25
44 (Unhealthy for Sensitive Groups)
33 (Moderate)
26 (Moderate)
27 (Moderate)
55 (Unhealthy for Sensitive Groups)
51 (Unhealthy for Sensitive Groups)
34 (Moderate)
40 (Unhealthy for Sensitive Groups)
27 (Moderate)
23 (Moderate)
30 (Moderate)
31 (Moderate)
36 (Unhealthy for Sensitive Groups)
50 (Unhealthy for Sensitive Groups)
55 (Unhealthy for Sensitive Groups)
56 (Unhealthy)
61 (Unhealthy)
47 (Unhealthy for Sensitive Groups)
54 (Unhealthy for Sensitive Groups)
39 (Unhealthy for Sensitive Groups)
co
971 (Good)
719 (Good)
623 (Good)
1 (Good)
1 (Good)
1 (Good)
926 (Good)
995 (Good)
943 (Good)
729 (Good)
630 (Good)
740 (Good)
748 (Good)
901 (Good)
934 (Good)
1 (Good)
1 (Good)
1 (Good)
1 (Good)
795 (Good)
no2
28 (Good)
37 (Good)
34 (Good)
24 (Good)
40 (Good)
61 (Moderate)
55 (Moderate)
49 (Moderate)
29 (Good)
22 (Good)
24 (Good)
27 (Good)
43 (Moderate)
45 (Moderate)
47 (Moderate)
36 (Good)
51 (Moderate)
53 (Moderate)
56 (Moderate)
48 (Moderate)
pm10
62 (Unhealthy for Sensitive Groups)
62 (Unhealthy for Sensitive Groups)
53 (Unhealthy for Sensitive Groups)
56 (Unhealthy for Sensitive Groups)
85 (Unhealthy)
93 (Unhealthy)
89 (Unhealthy)
87 (Unhealthy)
57 (Unhealthy for Sensitive Groups)
45 (Moderate)
53 (Unhealthy for Sensitive Groups)
62 (Unhealthy for Sensitive Groups)
82 (Unhealthy)
83 (Unhealthy)
105 (Unhealthy)
89 (Unhealthy)
109 (Unhealthy)
92 (Unhealthy)
94 (Unhealthy)
86 (Unhealthy)
so2
4.6 (Good)
6.2 (Good)
6.5 (Good)
6.1 (Good)
7.3 (Good)
9.3 (Good)
10 (Good)
8.8 (Good)
7.3 (Good)
6 (Good)
6.2 (Good)
5.8 (Good)
8.9 (Good)
8.7 (Good)
10 (Good)
8.3 (Good)
10 (Good)
15 (Good)
13 (Good)
16 (Good)
data source »
Quality of life in Nanchansi
Green and Parks in the City
Nanchansi
83%
Mongolia: 27%
Bhutan: 82%
Hong Kong: 52%
Myanmar: 33%
particulate matter PM2.5
Nanchansi
53 (Unhealthy for Sensitive Groups)
Pleasure of spending time in the city
Nanchansi
35%
Mongolia: 22%
Bhutan: 61%
Hong Kong: 43%
Myanmar: 24%
particulate matter PM10
Nanchansi
82 (Unhealthy)
Air Pollution
Nanchansi
79%
Mongolia: 87%
Bhutan: 45%
Hong Kong: 67%
Myanmar: 83%
Garbage Disposal
Nanchansi
50%
Mongolia: 27%
Bhutan: 47%
Hong Kong: 52%
Myanmar: 12%
Availability and quality of drinking water
Nanchansi
50%
Mongolia: 46%
Bhutan: 64%
Hong Kong: 66%
Myanmar: 34%
Cleanliness and tidiness
Nanchansi
58%
Mongolia: 29%
Bhutan: 57%
Hong Kong: 54%
Myanmar: 18%
Noise and Light pollution
Nanchansi
67%
Mongolia: 48%
Bhutan: 55%
Hong Kong: 66%
Myanmar: 52%
Water Pollution
Nanchansi
92%
Mongolia: 68%
Bhutan: 56%
Hong Kong: 53%
Myanmar: 74%
Source: Numbeo
曹张
Friday, May 27, 2022, 12:00 PM
PM10 179 (Very bad Hazardous)
particulate matter (PM10) suspended dust
PM2,5 35 (Unhealthy for Sensitive Groups)
particulate matter (PM2.5) dust
O3 0.04 (Good)
ozone (O3)
NO2 0 (Good)
nitrogen dioxide (NO2)
SO2 0 (Good)
sulfur dioxide (SO2)
曹张
index
2022-05-27
pm10
56
pm25
56
o3
0.03
no2
0
so2
0
曹张
2018-10 2020-05

index
2020-05
2020-04
2020-03
2020-02
2020-01
2019-12
2019-11
2019-10
2019-09
2019-08
2019-07
2019-06
2019-05
2019-04
2019-03
2019-02
2019-01
2018-12
2018-11
2018-10
pm25
44
33
26
27
55
51
34
40
27
23
30
31
36
50
55
56
61
47
54
39
co
971
719
623
1
1
1
926
995
943
729
630
740
748
901
934
1
1
1
1
795
no2
28
37
34
24
40
61
55
49
29
22
24
27
43
45
47
36
51
53
56
48
o3
148
139
109
95
67
70
100
124
160
172
174
187
171
141
118
75
56
51
81
120
pm10
62
62
53
56
85
93
89
87
57
45
53
62
82
83
105
89
109
92
94
86
so2
4.6
6.2
6.5
6.1
7.3
9.3
10
8.8
7.3
6
6.2
5.8
8.9
8.7
10
8.3
10
15
13
16
* Pollution data source:
https://openaq.org
(ChinaAQIData)
The data is licensed under CC-By 4.0
PM10 179 (Very bad Hazardous)
PM2,5 35 (Unhealthy for Sensitive Groups)
O3 0 (Good)
NO2 0 (Good)
SO2 0 (Good)
Data on air pollution from recent days in Nanchansi
| index | 2022-05-27 |
|---|---|
| pm10 | 56 Unhealthy for Sensitive Groups |
| pm25 | 56 Unhealthy |
| o3 | 0 Good |
| no2 | 0 Good |
| so2 | 0 Good |
| index | 2020-05 | 2020-04 | 2020-03 | 2020-02 | 2020-01 | 2019-12 | 2019-11 | 2019-10 | 2019-09 | 2019-08 | 2019-07 | 2019-06 | 2019-05 | 2019-04 | 2019-03 | 2019-02 | 2019-01 | 2018-12 | 2018-11 | 2018-10 |
|---|---|---|---|---|---|---|---|---|---|---|---|---|---|---|---|---|---|---|---|---|
| o3 | 148 (Unhealthy for Sensitive Groups) | 139 (Unhealthy for Sensitive Groups) | 109 (Moderate) | 95 (Moderate) | 67 (Good) | 70 (Moderate) | 100 (Moderate) | 124 (Unhealthy for Sensitive Groups) | 160 (Unhealthy) | 172 (Unhealthy) | 174 (Unhealthy) | 187 (Very Unhealthy) | 171 (Unhealthy) | 141 (Unhealthy for Sensitive Groups) | 118 (Moderate) | 75 (Moderate) | 56 (Good) | 51 (Good) | 81 (Moderate) | 120 (Unhealthy for Sensitive Groups) |
| pm25 | 44 (Unhealthy for Sensitive Groups) | 33 (Moderate) | 26 (Moderate) | 27 (Moderate) | 55 (Unhealthy for Sensitive Groups) | 51 (Unhealthy for Sensitive Groups) | 34 (Moderate) | 40 (Unhealthy for Sensitive Groups) | 27 (Moderate) | 23 (Moderate) | 30 (Moderate) | 31 (Moderate) | 36 (Unhealthy for Sensitive Groups) | 50 (Unhealthy for Sensitive Groups) | 55 (Unhealthy for Sensitive Groups) | 56 (Unhealthy) | 61 (Unhealthy) | 47 (Unhealthy for Sensitive Groups) | 54 (Unhealthy for Sensitive Groups) | 39 (Unhealthy for Sensitive Groups) |
| co | 971 (Good) | 719 (Good) | 623 (Good) | 1 (Good) | 1 (Good) | 1 (Good) | 926 (Good) | 995 (Good) | 943 (Good) | 729 (Good) | 630 (Good) | 740 (Good) | 748 (Good) | 901 (Good) | 934 (Good) | 1 (Good) | 1 (Good) | 1 (Good) | 1 (Good) | 795 (Good) |
| no2 | 28 (Good) | 37 (Good) | 34 (Good) | 24 (Good) | 40 (Good) | 61 (Moderate) | 55 (Moderate) | 49 (Moderate) | 29 (Good) | 22 (Good) | 24 (Good) | 27 (Good) | 43 (Moderate) | 45 (Moderate) | 47 (Moderate) | 36 (Good) | 51 (Moderate) | 53 (Moderate) | 56 (Moderate) | 48 (Moderate) |
| pm10 | 62 (Unhealthy for Sensitive Groups) | 62 (Unhealthy for Sensitive Groups) | 53 (Unhealthy for Sensitive Groups) | 56 (Unhealthy for Sensitive Groups) | 85 (Unhealthy) | 93 (Unhealthy) | 89 (Unhealthy) | 87 (Unhealthy) | 57 (Unhealthy for Sensitive Groups) | 45 (Moderate) | 53 (Unhealthy for Sensitive Groups) | 62 (Unhealthy for Sensitive Groups) | 82 (Unhealthy) | 83 (Unhealthy) | 105 (Unhealthy) | 89 (Unhealthy) | 109 (Unhealthy) | 92 (Unhealthy) | 94 (Unhealthy) | 86 (Unhealthy) |
| so2 | 4.6 (Good) | 6.2 (Good) | 6.5 (Good) | 6.1 (Good) | 7.3 (Good) | 9.3 (Good) | 10 (Good) | 8.8 (Good) | 7.3 (Good) | 6 (Good) | 6.2 (Good) | 5.8 (Good) | 8.9 (Good) | 8.7 (Good) | 10 (Good) | 8.3 (Good) | 10 (Good) | 15 (Good) | 13 (Good) | 16 (Good) |
Green and Parks in the City
Nanchansi 83%
Mongolia: 27% Bhutan: 82% Hong Kong: 52% Myanmar: 33%particulate matter PM2.5
Nanchansi 53 (Unhealthy for Sensitive Groups)
Pleasure of spending time in the city
Nanchansi 35%
Mongolia: 22% Bhutan: 61% Hong Kong: 43% Myanmar: 24%particulate matter PM10
Nanchansi 82 (Unhealthy)
Air Pollution
Nanchansi 79%
Mongolia: 87% Bhutan: 45% Hong Kong: 67% Myanmar: 83%Garbage Disposal
Nanchansi 50%
Mongolia: 27% Bhutan: 47% Hong Kong: 52% Myanmar: 12%Availability and quality of drinking water
Nanchansi 50%
Mongolia: 46% Bhutan: 64% Hong Kong: 66% Myanmar: 34%Cleanliness and tidiness
Nanchansi 58%
Mongolia: 29% Bhutan: 57% Hong Kong: 54% Myanmar: 18%Noise and Light pollution
Nanchansi 67%
Mongolia: 48% Bhutan: 55% Hong Kong: 66% Myanmar: 52%Water Pollution
Nanchansi 92%
Mongolia: 68% Bhutan: 56% Hong Kong: 53% Myanmar: 74%PM10 179 (Very bad Hazardous)
particulate matter (PM10) suspended dustPM2,5 35 (Unhealthy for Sensitive Groups)
particulate matter (PM2.5) dustO3 0.04 (Good)
ozone (O3)NO2 0 (Good)
nitrogen dioxide (NO2)SO2 0 (Good)
sulfur dioxide (SO2)曹张
| index | 2022-05-27 |
|---|---|
| pm10 | 56 |
| pm25 | 56 |
| o3 | 0.03 |
| no2 | 0 |
| so2 | 0 |
曹张

| index | 2020-05 | 2020-04 | 2020-03 | 2020-02 | 2020-01 | 2019-12 | 2019-11 | 2019-10 | 2019-09 | 2019-08 | 2019-07 | 2019-06 | 2019-05 | 2019-04 | 2019-03 | 2019-02 | 2019-01 | 2018-12 | 2018-11 | 2018-10 |
|---|---|---|---|---|---|---|---|---|---|---|---|---|---|---|---|---|---|---|---|---|
| pm25 | 44 | 33 | 26 | 27 | 55 | 51 | 34 | 40 | 27 | 23 | 30 | 31 | 36 | 50 | 55 | 56 | 61 | 47 | 54 | 39 |
| co | 971 | 719 | 623 | 1 | 1 | 1 | 926 | 995 | 943 | 729 | 630 | 740 | 748 | 901 | 934 | 1 | 1 | 1 | 1 | 795 |
| no2 | 28 | 37 | 34 | 24 | 40 | 61 | 55 | 49 | 29 | 22 | 24 | 27 | 43 | 45 | 47 | 36 | 51 | 53 | 56 | 48 |
| o3 | 148 | 139 | 109 | 95 | 67 | 70 | 100 | 124 | 160 | 172 | 174 | 187 | 171 | 141 | 118 | 75 | 56 | 51 | 81 | 120 |
| pm10 | 62 | 62 | 53 | 56 | 85 | 93 | 89 | 87 | 57 | 45 | 53 | 62 | 82 | 83 | 105 | 89 | 109 | 92 | 94 | 86 |
| so2 | 4.6 | 6.2 | 6.5 | 6.1 | 7.3 | 9.3 | 10 | 8.8 | 7.3 | 6 | 6.2 | 5.8 | 8.9 | 8.7 | 10 | 8.3 | 10 | 15 | 13 | 16 |