Air Pollution in Dahuwa: Real-time Air Quality Index and smog alert.
Pollution and air quality forecast for Dahuwa. Today is Tuesday, June 2, 2026. The following air pollution values have been recorded for Dahuwa:- particulate matter (PM10) suspended dust - 179 (Very bad Hazardous)
- particulate matter (PM2.5) dust - 35 (Unhealthy for Sensitive Groups)
- ozone (O3) - 0 (Good)
- nitrogen dioxide (NO2) - 0 (Good)
- sulfur dioxide (SO2) - 0 (Good)

What is the air quality in Dahuwa today? Is the air polluted in Dahuwa?. Is there smog?
What is the level of PM10 today in Dahuwa? (particulate matter (PM10) suspended dust)
The current level of particulate matter PM10 in Dahuwa is:
179 (Very bad Hazardous)
The highest PM10 values usually occur in month: 108 (January 2019).
The lowest value of particulate matter PM10 pollution in Dahuwa is usually recorded in: August (40).
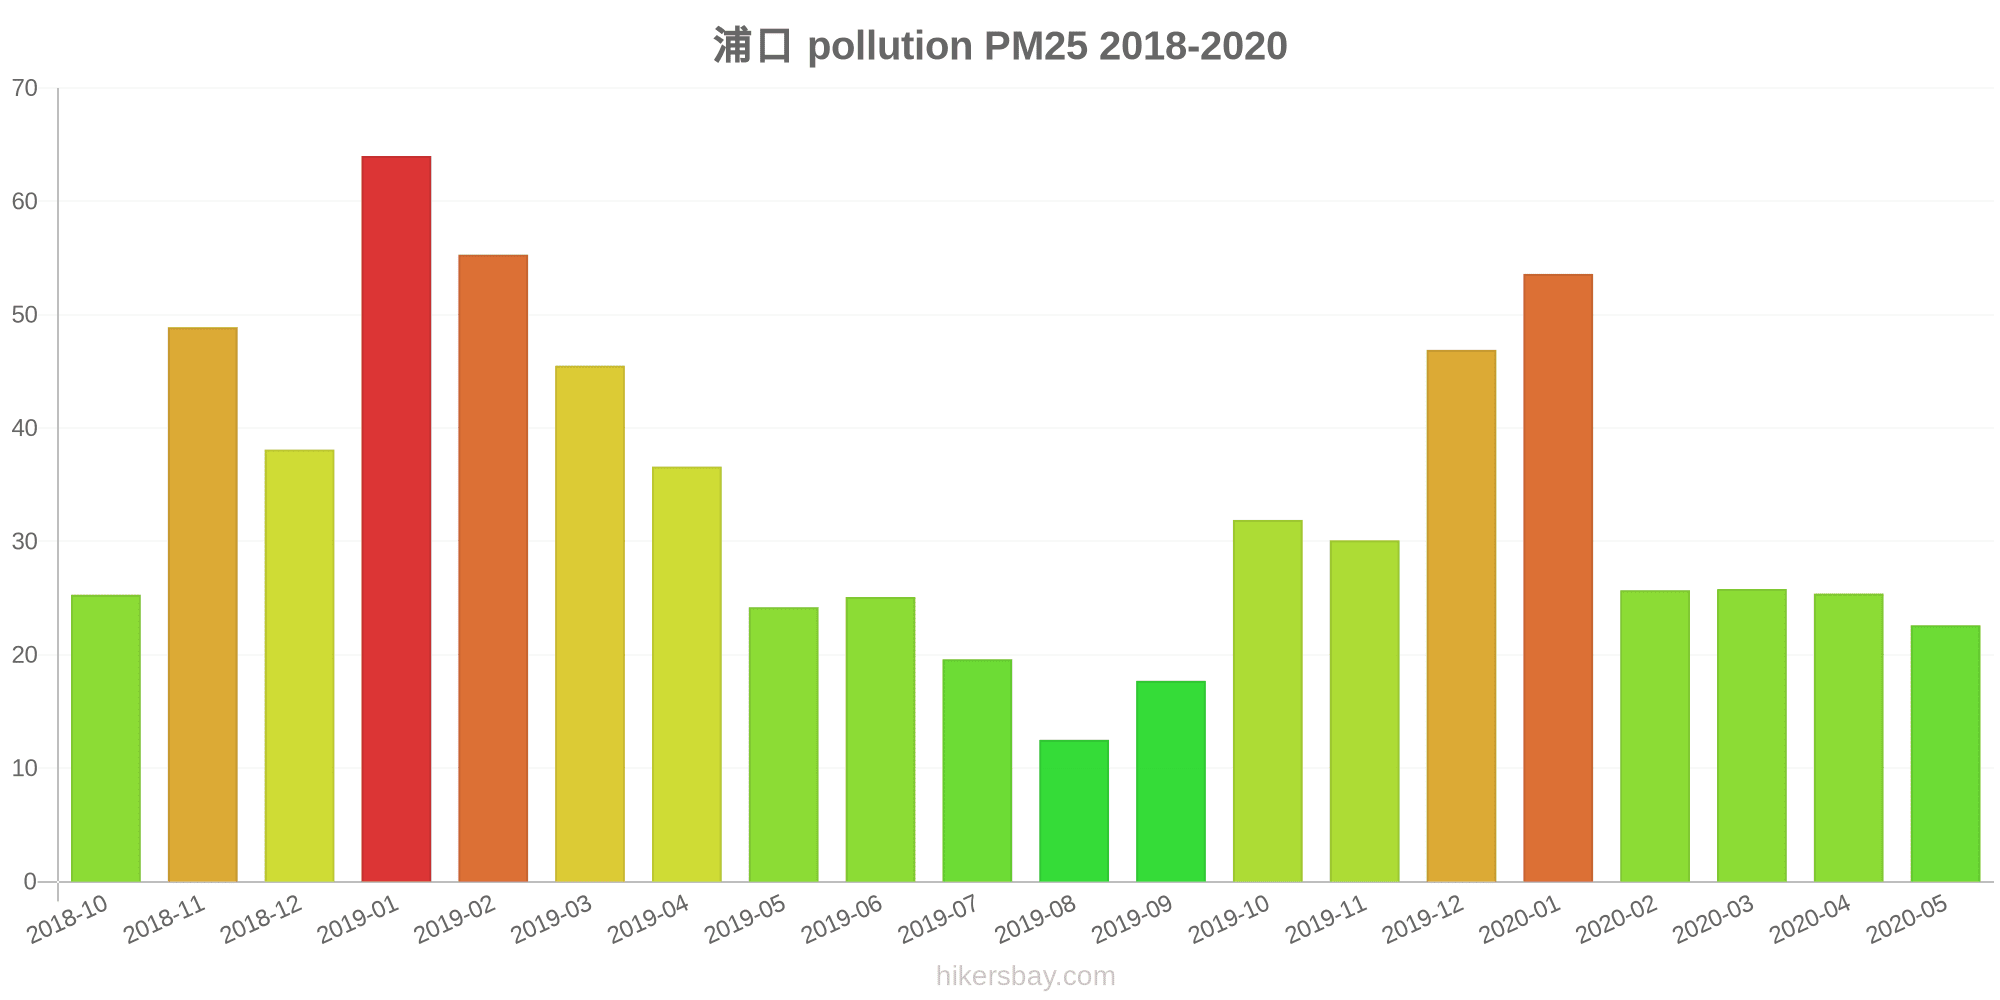
What is the current level of PM2.5 in Dahuwa? (particulate matter (PM2.5) dust)
Today's PM2.5 level is:
35 (Unhealthy for Sensitive Groups)
For comparison, the highest level of PM2.5 in Dahuwa in the last 7 days was: 56 (Friday, May 27, 2022) and the lowest: 56 (Friday, May 27, 2022).
The highest PM2.5 values were recorded: 64 (January 2019).
The lowest level of particulate matter PM2.5 pollution occurs in month: August (13).
How is the O3 level today in Dahuwa? (ozone (O3))
0 (Good)
How high is the level of NO2? (nitrogen dioxide (NO2))
0 (Good)
What is the level of SO2 pollution? (sulfur dioxide (SO2))
0 (Good)
Current data Friday, May 27, 2022, 12:00 PM
PM10 179 (Very bad Hazardous)
PM2,5 35 (Unhealthy for Sensitive Groups)
O3 0 (Good)
NO2 0 (Good)
SO2 0 (Good)
Data on air pollution from recent days in Dahuwa
index
2022-05-27
pm10
56
Unhealthy for Sensitive Groups
pm25
56
Unhealthy
o3
0
Good
no2
0
Good
so2
0
Good
data source »
Air pollution in Dahuwa from October 2018 to May 2020

index
2020-05
2020-04
2020-03
2020-02
2020-01
2019-12
2019-11
2019-10
2019-09
2019-08
2019-07
2019-06
2019-05
2019-04
2019-03
2019-02
2019-01
2018-12
2018-11
2018-10
pm25
23 (Moderate)
25 (Moderate)
26 (Moderate)
26 (Moderate)
54 (Unhealthy for Sensitive Groups)
47 (Unhealthy for Sensitive Groups)
30 (Moderate)
32 (Moderate)
18 (Moderate)
13 (Good)
20 (Moderate)
25 (Moderate)
24 (Moderate)
37 (Unhealthy for Sensitive Groups)
46 (Unhealthy for Sensitive Groups)
55 (Unhealthy)
64 (Unhealthy)
38 (Unhealthy for Sensitive Groups)
49 (Unhealthy for Sensitive Groups)
25 (Moderate)
co
584 (Good)
682 (Good)
637 (Good)
709 (Good)
866 (Good)
959 (Good)
1 (Good)
793 (Good)
592 (Good)
419 (Good)
457 (Good)
422 (Good)
434 (Good)
439 (Good)
738 (Good)
973 (Good)
1 (Good)
839 (Good)
787 (Good)
417 (Good)
no2
24 (Good)
36 (Good)
33 (Good)
21 (Good)
39 (Good)
57 (Moderate)
52 (Moderate)
42 (Moderate)
31 (Good)
25 (Good)
31 (Good)
32 (Good)
36 (Good)
46 (Moderate)
51 (Moderate)
34 (Good)
52 (Moderate)
45 (Moderate)
59 (Moderate)
43 (Moderate)
o3
149 (Unhealthy for Sensitive Groups)
150 (Unhealthy)
117 (Moderate)
98 (Moderate)
76 (Moderate)
75 (Moderate)
104 (Moderate)
131 (Unhealthy for Sensitive Groups)
169 (Unhealthy)
170 (Unhealthy)
166 (Unhealthy)
194 (Very Unhealthy)
166 (Unhealthy)
135 (Unhealthy for Sensitive Groups)
112 (Moderate)
88 (Moderate)
66 (Good)
60 (Good)
101 (Moderate)
129 (Unhealthy for Sensitive Groups)
pm10
60 (Unhealthy for Sensitive Groups)
74 (Unhealthy for Sensitive Groups)
66 (Unhealthy for Sensitive Groups)
49 (Moderate)
81 (Unhealthy)
85 (Unhealthy)
91 (Unhealthy)
88 (Unhealthy)
48 (Moderate)
40 (Moderate)
48 (Moderate)
55 (Unhealthy for Sensitive Groups)
70 (Unhealthy for Sensitive Groups)
79 (Unhealthy for Sensitive Groups)
101 (Unhealthy)
84 (Unhealthy)
108 (Unhealthy)
75 (Unhealthy for Sensitive Groups)
93 (Unhealthy)
69 (Unhealthy for Sensitive Groups)
so2
11 (Good)
9.3 (Good)
7.8 (Good)
6 (Good)
5.8 (Good)
8.5 (Good)
11 (Good)
8.8 (Good)
10 (Good)
7.4 (Good)
6.7 (Good)
9.6 (Good)
12 (Good)
11 (Good)
11 (Good)
8.9 (Good)
12 (Good)
11 (Good)
11 (Good)
7.8 (Good)
data source »
浦口
Friday, May 27, 2022, 12:00 PM
PM10 179 (Very bad Hazardous)
particulate matter (PM10) suspended dust
PM2,5 35 (Unhealthy for Sensitive Groups)
particulate matter (PM2.5) dust
O3 0.04 (Good)
ozone (O3)
NO2 0 (Good)
nitrogen dioxide (NO2)
SO2 0 (Good)
sulfur dioxide (SO2)
浦口
index
2022-05-27
pm10
56
pm25
56
o3
0.03
no2
0
so2
0
浦口
2018-10 2020-05

index
2020-05
2020-04
2020-03
2020-02
2020-01
2019-12
2019-11
2019-10
2019-09
2019-08
2019-07
2019-06
2019-05
2019-04
2019-03
2019-02
2019-01
2018-12
2018-11
2018-10
pm25
23
25
26
26
54
47
30
32
18
13
20
25
24
37
46
55
64
38
49
25
co
584
682
637
709
866
959
1
793
592
419
457
422
434
439
738
973
1
839
787
417
no2
24
36
33
21
39
57
52
42
31
25
31
32
36
46
51
34
52
45
59
43
o3
149
150
117
98
76
75
104
131
169
170
166
194
166
135
112
88
66
60
101
129
pm10
60
74
66
49
81
85
91
88
48
40
48
55
70
79
101
84
108
75
93
69
so2
11
9.3
7.8
6
5.8
8.5
11
8.8
10
7.4
6.7
9.6
12
11
11
8.9
12
11
11
7.8
* Pollution data source:
https://openaq.org
(ChinaAQIData)
The data is licensed under CC-By 4.0
PM10 179 (Very bad Hazardous)
PM2,5 35 (Unhealthy for Sensitive Groups)
O3 0 (Good)
NO2 0 (Good)
SO2 0 (Good)
Data on air pollution from recent days in Dahuwa
| index | 2022-05-27 |
|---|---|
| pm10 | 56 Unhealthy for Sensitive Groups |
| pm25 | 56 Unhealthy |
| o3 | 0 Good |
| no2 | 0 Good |
| so2 | 0 Good |

| index | 2020-05 | 2020-04 | 2020-03 | 2020-02 | 2020-01 | 2019-12 | 2019-11 | 2019-10 | 2019-09 | 2019-08 | 2019-07 | 2019-06 | 2019-05 | 2019-04 | 2019-03 | 2019-02 | 2019-01 | 2018-12 | 2018-11 | 2018-10 |
|---|---|---|---|---|---|---|---|---|---|---|---|---|---|---|---|---|---|---|---|---|
| pm25 | 23 (Moderate) | 25 (Moderate) | 26 (Moderate) | 26 (Moderate) | 54 (Unhealthy for Sensitive Groups) | 47 (Unhealthy for Sensitive Groups) | 30 (Moderate) | 32 (Moderate) | 18 (Moderate) | 13 (Good) | 20 (Moderate) | 25 (Moderate) | 24 (Moderate) | 37 (Unhealthy for Sensitive Groups) | 46 (Unhealthy for Sensitive Groups) | 55 (Unhealthy) | 64 (Unhealthy) | 38 (Unhealthy for Sensitive Groups) | 49 (Unhealthy for Sensitive Groups) | 25 (Moderate) |
| co | 584 (Good) | 682 (Good) | 637 (Good) | 709 (Good) | 866 (Good) | 959 (Good) | 1 (Good) | 793 (Good) | 592 (Good) | 419 (Good) | 457 (Good) | 422 (Good) | 434 (Good) | 439 (Good) | 738 (Good) | 973 (Good) | 1 (Good) | 839 (Good) | 787 (Good) | 417 (Good) |
| no2 | 24 (Good) | 36 (Good) | 33 (Good) | 21 (Good) | 39 (Good) | 57 (Moderate) | 52 (Moderate) | 42 (Moderate) | 31 (Good) | 25 (Good) | 31 (Good) | 32 (Good) | 36 (Good) | 46 (Moderate) | 51 (Moderate) | 34 (Good) | 52 (Moderate) | 45 (Moderate) | 59 (Moderate) | 43 (Moderate) |
| o3 | 149 (Unhealthy for Sensitive Groups) | 150 (Unhealthy) | 117 (Moderate) | 98 (Moderate) | 76 (Moderate) | 75 (Moderate) | 104 (Moderate) | 131 (Unhealthy for Sensitive Groups) | 169 (Unhealthy) | 170 (Unhealthy) | 166 (Unhealthy) | 194 (Very Unhealthy) | 166 (Unhealthy) | 135 (Unhealthy for Sensitive Groups) | 112 (Moderate) | 88 (Moderate) | 66 (Good) | 60 (Good) | 101 (Moderate) | 129 (Unhealthy for Sensitive Groups) |
| pm10 | 60 (Unhealthy for Sensitive Groups) | 74 (Unhealthy for Sensitive Groups) | 66 (Unhealthy for Sensitive Groups) | 49 (Moderate) | 81 (Unhealthy) | 85 (Unhealthy) | 91 (Unhealthy) | 88 (Unhealthy) | 48 (Moderate) | 40 (Moderate) | 48 (Moderate) | 55 (Unhealthy for Sensitive Groups) | 70 (Unhealthy for Sensitive Groups) | 79 (Unhealthy for Sensitive Groups) | 101 (Unhealthy) | 84 (Unhealthy) | 108 (Unhealthy) | 75 (Unhealthy for Sensitive Groups) | 93 (Unhealthy) | 69 (Unhealthy for Sensitive Groups) |
| so2 | 11 (Good) | 9.3 (Good) | 7.8 (Good) | 6 (Good) | 5.8 (Good) | 8.5 (Good) | 11 (Good) | 8.8 (Good) | 10 (Good) | 7.4 (Good) | 6.7 (Good) | 9.6 (Good) | 12 (Good) | 11 (Good) | 11 (Good) | 8.9 (Good) | 12 (Good) | 11 (Good) | 11 (Good) | 7.8 (Good) |
PM10 179 (Very bad Hazardous)
particulate matter (PM10) suspended dustPM2,5 35 (Unhealthy for Sensitive Groups)
particulate matter (PM2.5) dustO3 0.04 (Good)
ozone (O3)NO2 0 (Good)
nitrogen dioxide (NO2)SO2 0 (Good)
sulfur dioxide (SO2)浦口
| index | 2022-05-27 |
|---|---|
| pm10 | 56 |
| pm25 | 56 |
| o3 | 0.03 |
| no2 | 0 |
| so2 | 0 |
浦口
| index | 2020-05 | 2020-04 | 2020-03 | 2020-02 | 2020-01 | 2019-12 | 2019-11 | 2019-10 | 2019-09 | 2019-08 | 2019-07 | 2019-06 | 2019-05 | 2019-04 | 2019-03 | 2019-02 | 2019-01 | 2018-12 | 2018-11 | 2018-10 |
|---|---|---|---|---|---|---|---|---|---|---|---|---|---|---|---|---|---|---|---|---|
| pm25 | 23 | 25 | 26 | 26 | 54 | 47 | 30 | 32 | 18 | 13 | 20 | 25 | 24 | 37 | 46 | 55 | 64 | 38 | 49 | 25 |
| co | 584 | 682 | 637 | 709 | 866 | 959 | 1 | 793 | 592 | 419 | 457 | 422 | 434 | 439 | 738 | 973 | 1 | 839 | 787 | 417 |
| no2 | 24 | 36 | 33 | 21 | 39 | 57 | 52 | 42 | 31 | 25 | 31 | 32 | 36 | 46 | 51 | 34 | 52 | 45 | 59 | 43 |
| o3 | 149 | 150 | 117 | 98 | 76 | 75 | 104 | 131 | 169 | 170 | 166 | 194 | 166 | 135 | 112 | 88 | 66 | 60 | 101 | 129 |
| pm10 | 60 | 74 | 66 | 49 | 81 | 85 | 91 | 88 | 48 | 40 | 48 | 55 | 70 | 79 | 101 | 84 | 108 | 75 | 93 | 69 |
| so2 | 11 | 9.3 | 7.8 | 6 | 5.8 | 8.5 | 11 | 8.8 | 10 | 7.4 | 6.7 | 9.6 | 12 | 11 | 11 | 8.9 | 12 | 11 | 11 | 7.8 |