Air Pollution in Xiwang: Real-time Air Quality Index and smog alert.
Pollution and air quality forecast for Xiwang. Today is Tuesday, June 2, 2026. The following air pollution values have been recorded for Xiwang:- particulate matter (PM10) suspended dust - 179 (Very bad Hazardous)
- particulate matter (PM2.5) dust - 35 (Unhealthy for Sensitive Groups)
- ozone (O3) - 0 (Good)
- nitrogen dioxide (NO2) - 0 (Good)
- sulfur dioxide (SO2) - 0 (Good)

What is the air quality in Xiwang today? Is the air polluted in Xiwang?. Is there smog?
What is the level of PM10 today in Xiwang? (particulate matter (PM10) suspended dust)
The current level of particulate matter PM10 in Xiwang is:
179 (Very bad Hazardous)
The highest PM10 values usually occur in month: 106 (January 2019).
The lowest value of particulate matter PM10 pollution in Xiwang is usually recorded in: August (33).
What is the current level of PM2.5 in Xiwang? (particulate matter (PM2.5) dust)
Today's PM2.5 level is:
35 (Unhealthy for Sensitive Groups)
For comparison, the highest level of PM2.5 in Xiwang in the last 7 days was: 56 (Friday, May 27, 2022) and the lowest: 56 (Friday, May 27, 2022).
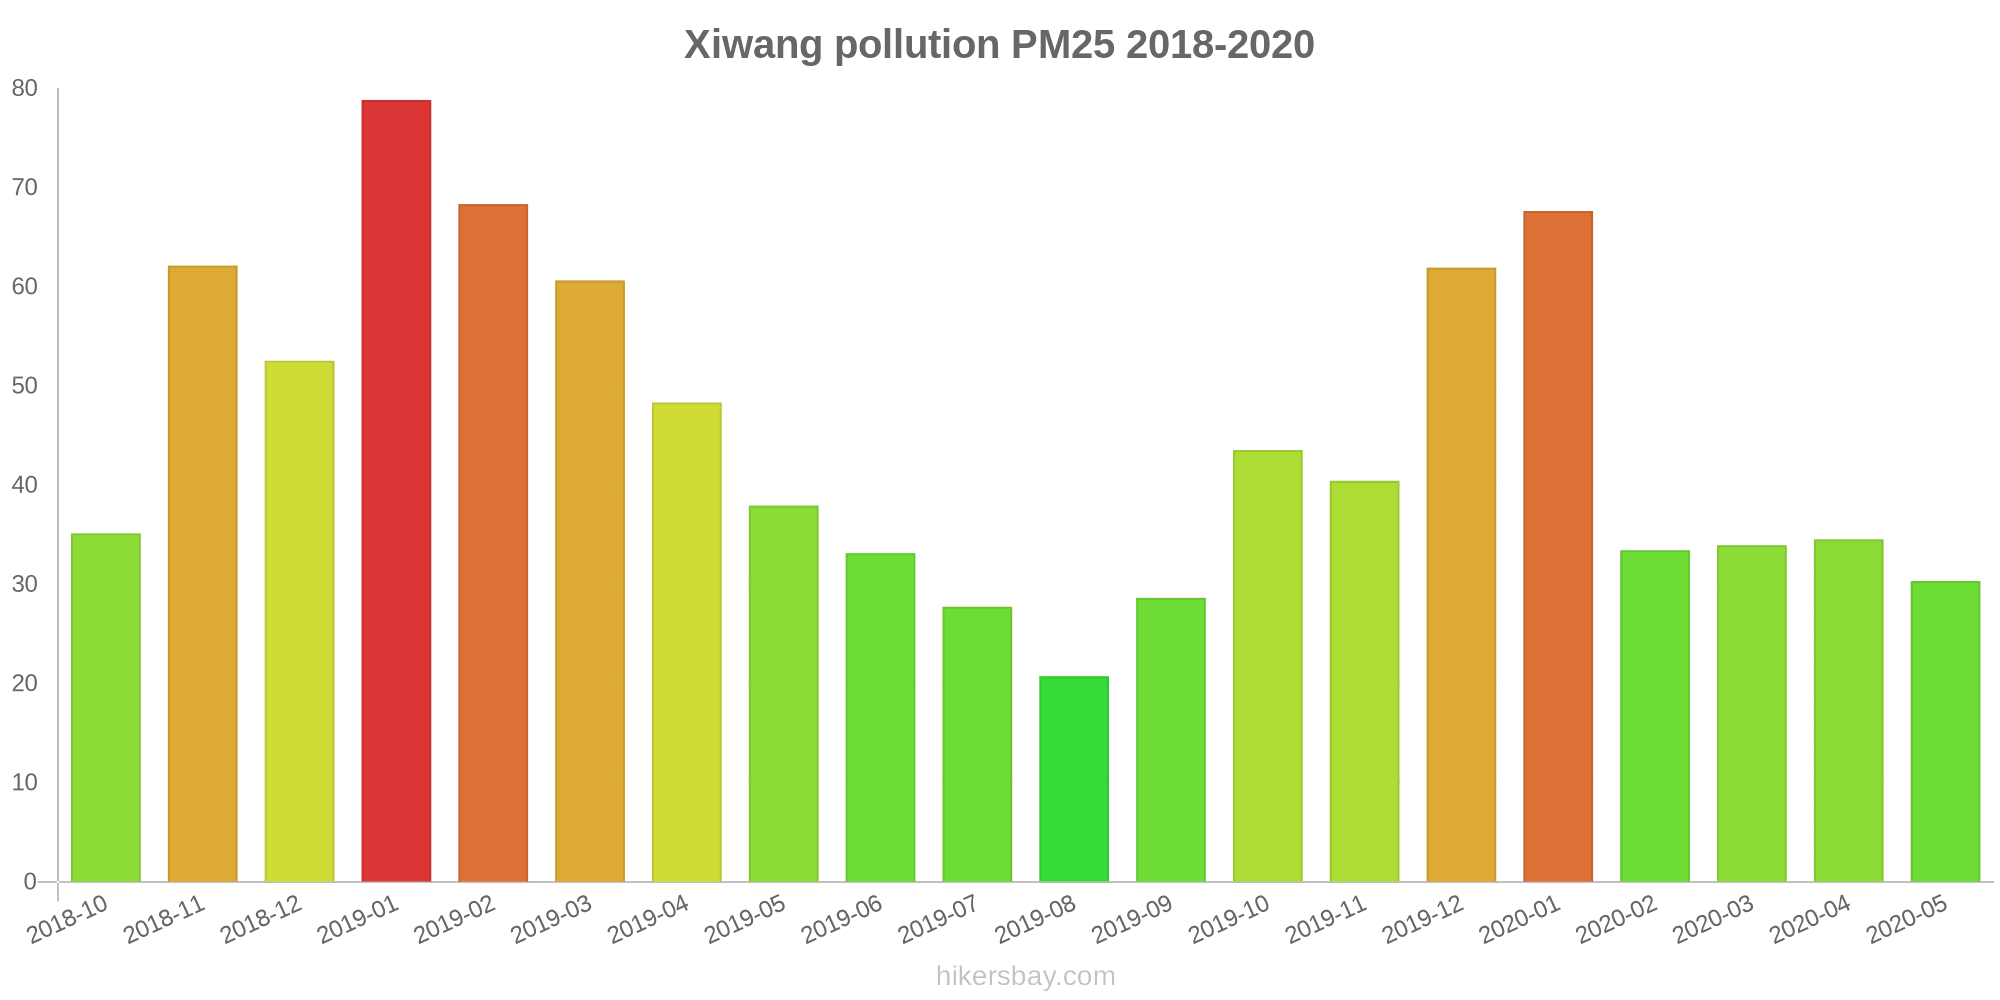
The highest PM2.5 values were recorded: 79 (January 2019).
The lowest level of particulate matter PM2.5 pollution occurs in month: August (21).
How is the O3 level today in Xiwang? (ozone (O3))
0 (Good)
How high is the level of NO2? (nitrogen dioxide (NO2))
0 (Good)
What is the level of SO2 pollution? (sulfur dioxide (SO2))
0 (Good)
Current data Friday, May 27, 2022, 12:00 PM
PM10 179 (Very bad Hazardous)
PM2,5 35 (Unhealthy for Sensitive Groups)
O3 0 (Good)
NO2 0 (Good)
SO2 0 (Good)
Data on air pollution from recent days in Xiwang
index
2022-05-27
pm10
56
Unhealthy for Sensitive Groups
pm25
56
Unhealthy
o3
0
Good
no2
0
Good
so2
0
Good
data source »
Air pollution in Xiwang from October 2018 to May 2020

index
2020-05
2020-04
2020-03
2020-02
2020-01
2019-12
2019-11
2019-10
2019-09
2019-08
2019-07
2019-06
2019-05
2019-04
2019-03
2019-02
2019-01
2018-12
2018-11
2018-10
pm25
30 (Moderate)
35 (Moderate)
34 (Moderate)
33 (Moderate)
68 (Unhealthy)
62 (Unhealthy)
40 (Unhealthy for Sensitive Groups)
44 (Unhealthy for Sensitive Groups)
29 (Moderate)
21 (Moderate)
28 (Moderate)
33 (Moderate)
38 (Unhealthy for Sensitive Groups)
48 (Unhealthy for Sensitive Groups)
61 (Unhealthy)
68 (Unhealthy)
79 (Very Unhealthy)
53 (Unhealthy for Sensitive Groups)
62 (Unhealthy)
35 (Unhealthy for Sensitive Groups)
co
671 (Good)
941 (Good)
724 (Good)
621 (Good)
987 (Good)
1 (Good)
909 (Good)
957 (Good)
900 (Good)
771 (Good)
725 (Good)
890 (Good)
874 (Good)
912 (Good)
1 (Good)
986 (Good)
1 (Good)
964 (Good)
1 (Good)
500 (Good)
no2
30 (Good)
45 (Moderate)
38 (Good)
23 (Good)
36 (Good)
56 (Moderate)
53 (Moderate)
46 (Moderate)
31 (Good)
21 (Good)
28 (Good)
27 (Good)
39 (Good)
46 (Moderate)
45 (Moderate)
35 (Good)
53 (Moderate)
40 (Moderate)
60 (Moderate)
49 (Moderate)
o3
169 (Unhealthy)
162 (Unhealthy)
127 (Unhealthy for Sensitive Groups)
93 (Moderate)
66 (Good)
66 (Good)
101 (Moderate)
119 (Moderate)
163 (Unhealthy)
168 (Unhealthy)
173 (Unhealthy)
192 (Very Unhealthy)
164 (Unhealthy)
130 (Unhealthy for Sensitive Groups)
103 (Moderate)
58 (Good)
48 (Good)
51 (Good)
82 (Moderate)
113 (Moderate)
pm10
52 (Unhealthy for Sensitive Groups)
65 (Unhealthy for Sensitive Groups)
53 (Unhealthy for Sensitive Groups)
43 (Moderate)
75 (Unhealthy for Sensitive Groups)
81 (Unhealthy)
82 (Unhealthy)
79 (Unhealthy for Sensitive Groups)
43 (Moderate)
33 (Moderate)
37 (Moderate)
43 (Moderate)
62 (Unhealthy for Sensitive Groups)
65 (Unhealthy for Sensitive Groups)
90 (Unhealthy)
82 (Unhealthy)
106 (Unhealthy)
82 (Unhealthy)
84 (Unhealthy)
71 (Unhealthy for Sensitive Groups)
so2
8 (Good)
9.3 (Good)
5.8 (Good)
4.3 (Good)
6.8 (Good)
11 (Good)
9.1 (Good)
8.6 (Good)
9.1 (Good)
7.8 (Good)
7.5 (Good)
10 (Good)
16 (Good)
14 (Good)
15 (Good)
9.9 (Good)
12 (Good)
15 (Good)
7.3 (Good)
8.7 (Good)
data source »
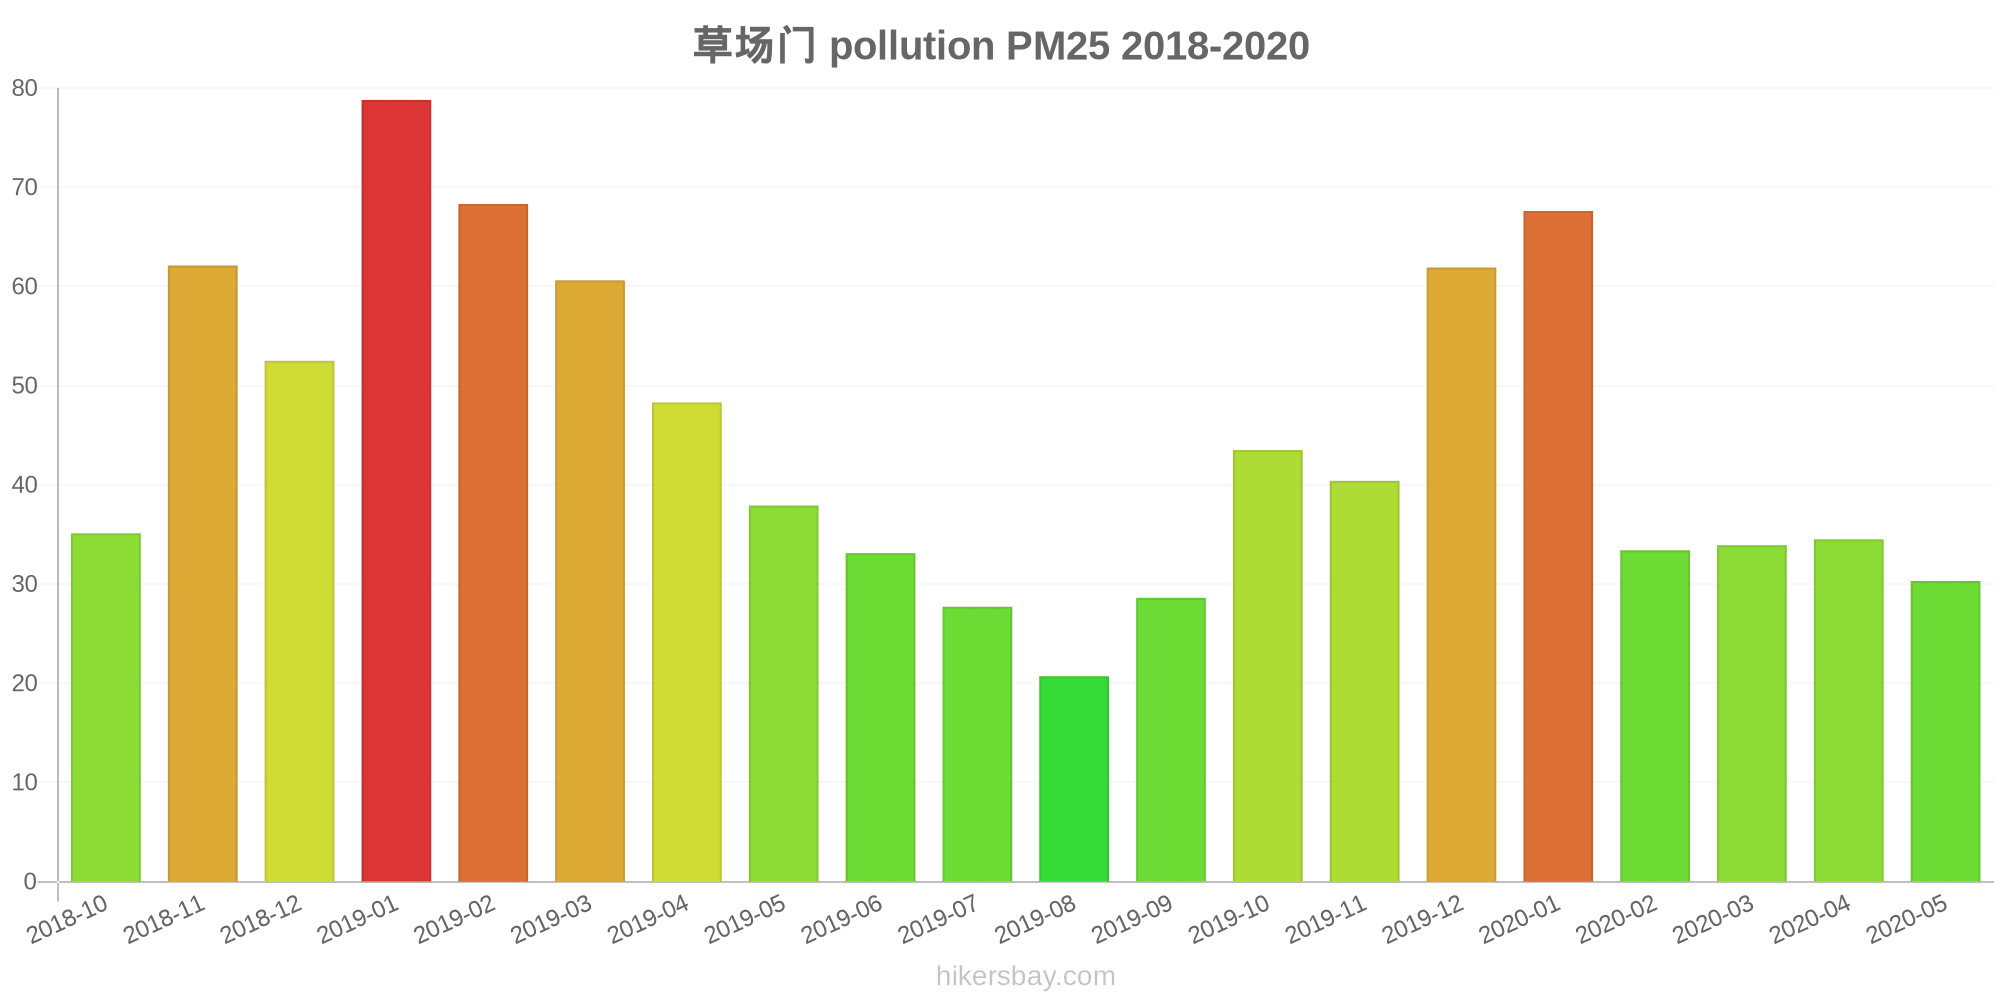
草场门
Friday, May 27, 2022, 12:00 PM
PM10 179 (Very bad Hazardous)
particulate matter (PM10) suspended dust
PM2,5 35 (Unhealthy for Sensitive Groups)
particulate matter (PM2.5) dust
O3 0.04 (Good)
ozone (O3)
NO2 0 (Good)
nitrogen dioxide (NO2)
SO2 0 (Good)
sulfur dioxide (SO2)
草场门
index
2022-05-27
pm10
56
pm25
56
o3
0.03
no2
0
so2
0
草场门
2018-10 2020-05

index
2020-05
2020-04
2020-03
2020-02
2020-01
2019-12
2019-11
2019-10
2019-09
2019-08
2019-07
2019-06
2019-05
2019-04
2019-03
2019-02
2019-01
2018-12
2018-11
2018-10
pm25
30
35
34
33
68
62
40
44
29
21
28
33
38
48
61
68
79
53
62
35
co
671
941
724
621
987
1
909
957
900
771
725
890
874
912
1
986
1
964
1
500
no2
30
45
38
23
36
56
53
46
31
21
28
27
39
46
45
35
53
40
60
49
o3
169
162
127
93
66
66
101
119
163
168
173
192
164
130
103
58
48
51
82
113
pm10
52
65
53
43
75
81
82
79
43
33
37
43
62
65
90
82
106
82
84
71
so2
8
9.3
5.8
4.3
6.8
11
9.1
8.6
9.1
7.8
7.5
10
16
14
15
9.9
12
15
7.3
8.7
* Pollution data source:
https://openaq.org
(ChinaAQIData)
The data is licensed under CC-By 4.0
PM10 179 (Very bad Hazardous)
PM2,5 35 (Unhealthy for Sensitive Groups)
O3 0 (Good)
NO2 0 (Good)
SO2 0 (Good)
Data on air pollution from recent days in Xiwang
| index | 2022-05-27 |
|---|---|
| pm10 | 56 Unhealthy for Sensitive Groups |
| pm25 | 56 Unhealthy |
| o3 | 0 Good |
| no2 | 0 Good |
| so2 | 0 Good |
| index | 2020-05 | 2020-04 | 2020-03 | 2020-02 | 2020-01 | 2019-12 | 2019-11 | 2019-10 | 2019-09 | 2019-08 | 2019-07 | 2019-06 | 2019-05 | 2019-04 | 2019-03 | 2019-02 | 2019-01 | 2018-12 | 2018-11 | 2018-10 |
|---|---|---|---|---|---|---|---|---|---|---|---|---|---|---|---|---|---|---|---|---|
| pm25 | 30 (Moderate) | 35 (Moderate) | 34 (Moderate) | 33 (Moderate) | 68 (Unhealthy) | 62 (Unhealthy) | 40 (Unhealthy for Sensitive Groups) | 44 (Unhealthy for Sensitive Groups) | 29 (Moderate) | 21 (Moderate) | 28 (Moderate) | 33 (Moderate) | 38 (Unhealthy for Sensitive Groups) | 48 (Unhealthy for Sensitive Groups) | 61 (Unhealthy) | 68 (Unhealthy) | 79 (Very Unhealthy) | 53 (Unhealthy for Sensitive Groups) | 62 (Unhealthy) | 35 (Unhealthy for Sensitive Groups) |
| co | 671 (Good) | 941 (Good) | 724 (Good) | 621 (Good) | 987 (Good) | 1 (Good) | 909 (Good) | 957 (Good) | 900 (Good) | 771 (Good) | 725 (Good) | 890 (Good) | 874 (Good) | 912 (Good) | 1 (Good) | 986 (Good) | 1 (Good) | 964 (Good) | 1 (Good) | 500 (Good) |
| no2 | 30 (Good) | 45 (Moderate) | 38 (Good) | 23 (Good) | 36 (Good) | 56 (Moderate) | 53 (Moderate) | 46 (Moderate) | 31 (Good) | 21 (Good) | 28 (Good) | 27 (Good) | 39 (Good) | 46 (Moderate) | 45 (Moderate) | 35 (Good) | 53 (Moderate) | 40 (Moderate) | 60 (Moderate) | 49 (Moderate) |
| o3 | 169 (Unhealthy) | 162 (Unhealthy) | 127 (Unhealthy for Sensitive Groups) | 93 (Moderate) | 66 (Good) | 66 (Good) | 101 (Moderate) | 119 (Moderate) | 163 (Unhealthy) | 168 (Unhealthy) | 173 (Unhealthy) | 192 (Very Unhealthy) | 164 (Unhealthy) | 130 (Unhealthy for Sensitive Groups) | 103 (Moderate) | 58 (Good) | 48 (Good) | 51 (Good) | 82 (Moderate) | 113 (Moderate) |
| pm10 | 52 (Unhealthy for Sensitive Groups) | 65 (Unhealthy for Sensitive Groups) | 53 (Unhealthy for Sensitive Groups) | 43 (Moderate) | 75 (Unhealthy for Sensitive Groups) | 81 (Unhealthy) | 82 (Unhealthy) | 79 (Unhealthy for Sensitive Groups) | 43 (Moderate) | 33 (Moderate) | 37 (Moderate) | 43 (Moderate) | 62 (Unhealthy for Sensitive Groups) | 65 (Unhealthy for Sensitive Groups) | 90 (Unhealthy) | 82 (Unhealthy) | 106 (Unhealthy) | 82 (Unhealthy) | 84 (Unhealthy) | 71 (Unhealthy for Sensitive Groups) |
| so2 | 8 (Good) | 9.3 (Good) | 5.8 (Good) | 4.3 (Good) | 6.8 (Good) | 11 (Good) | 9.1 (Good) | 8.6 (Good) | 9.1 (Good) | 7.8 (Good) | 7.5 (Good) | 10 (Good) | 16 (Good) | 14 (Good) | 15 (Good) | 9.9 (Good) | 12 (Good) | 15 (Good) | 7.3 (Good) | 8.7 (Good) |
PM10 179 (Very bad Hazardous)
particulate matter (PM10) suspended dustPM2,5 35 (Unhealthy for Sensitive Groups)
particulate matter (PM2.5) dustO3 0.04 (Good)
ozone (O3)NO2 0 (Good)
nitrogen dioxide (NO2)SO2 0 (Good)
sulfur dioxide (SO2)草场门
| index | 2022-05-27 |
|---|---|
| pm10 | 56 |
| pm25 | 56 |
| o3 | 0.03 |
| no2 | 0 |
| so2 | 0 |
草场门
| index | 2020-05 | 2020-04 | 2020-03 | 2020-02 | 2020-01 | 2019-12 | 2019-11 | 2019-10 | 2019-09 | 2019-08 | 2019-07 | 2019-06 | 2019-05 | 2019-04 | 2019-03 | 2019-02 | 2019-01 | 2018-12 | 2018-11 | 2018-10 |
|---|---|---|---|---|---|---|---|---|---|---|---|---|---|---|---|---|---|---|---|---|
| pm25 | 30 | 35 | 34 | 33 | 68 | 62 | 40 | 44 | 29 | 21 | 28 | 33 | 38 | 48 | 61 | 68 | 79 | 53 | 62 | 35 |
| co | 671 | 941 | 724 | 621 | 987 | 1 | 909 | 957 | 900 | 771 | 725 | 890 | 874 | 912 | 1 | 986 | 1 | 964 | 1 | 500 |
| no2 | 30 | 45 | 38 | 23 | 36 | 56 | 53 | 46 | 31 | 21 | 28 | 27 | 39 | 46 | 45 | 35 | 53 | 40 | 60 | 49 |
| o3 | 169 | 162 | 127 | 93 | 66 | 66 | 101 | 119 | 163 | 168 | 173 | 192 | 164 | 130 | 103 | 58 | 48 | 51 | 82 | 113 |
| pm10 | 52 | 65 | 53 | 43 | 75 | 81 | 82 | 79 | 43 | 33 | 37 | 43 | 62 | 65 | 90 | 82 | 106 | 82 | 84 | 71 |
| so2 | 8 | 9.3 | 5.8 | 4.3 | 6.8 | 11 | 9.1 | 8.6 | 9.1 | 7.8 | 7.5 | 10 | 16 | 14 | 15 | 9.9 | 12 | 15 | 7.3 | 8.7 |