Air Pollution in Julun: Real-time Air Quality Index and smog alert.
Pollution and air quality forecast for Julun. Today is Tuesday, June 16, 2026. The following air pollution values have been recorded for Julun:- particulate matter (PM2.5) dust - 61 (Unhealthy)
- nitrogen dioxide (NO2) - 22 (Good)
- particulate matter (PM10) suspended dust - 69 (Unhealthy for Sensitive Groups)
- carbon monoxide (CO) - 219 (Good)
- ozone (O3) - 0 (Good)
- sulfur dioxide (SO2) - 8 (Good)

What is the air quality in Julun today? Is the air polluted in Julun?. Is there smog?
What is the current level of PM2.5 in Julun? (particulate matter (PM2.5) dust)
Today's PM2.5 level is:
61 (Unhealthy)
For comparison, the highest level of PM2.5 in Julun in the last 7 days was: 28 (Friday, May 27, 2022) and the lowest: 28 (Friday, May 27, 2022).
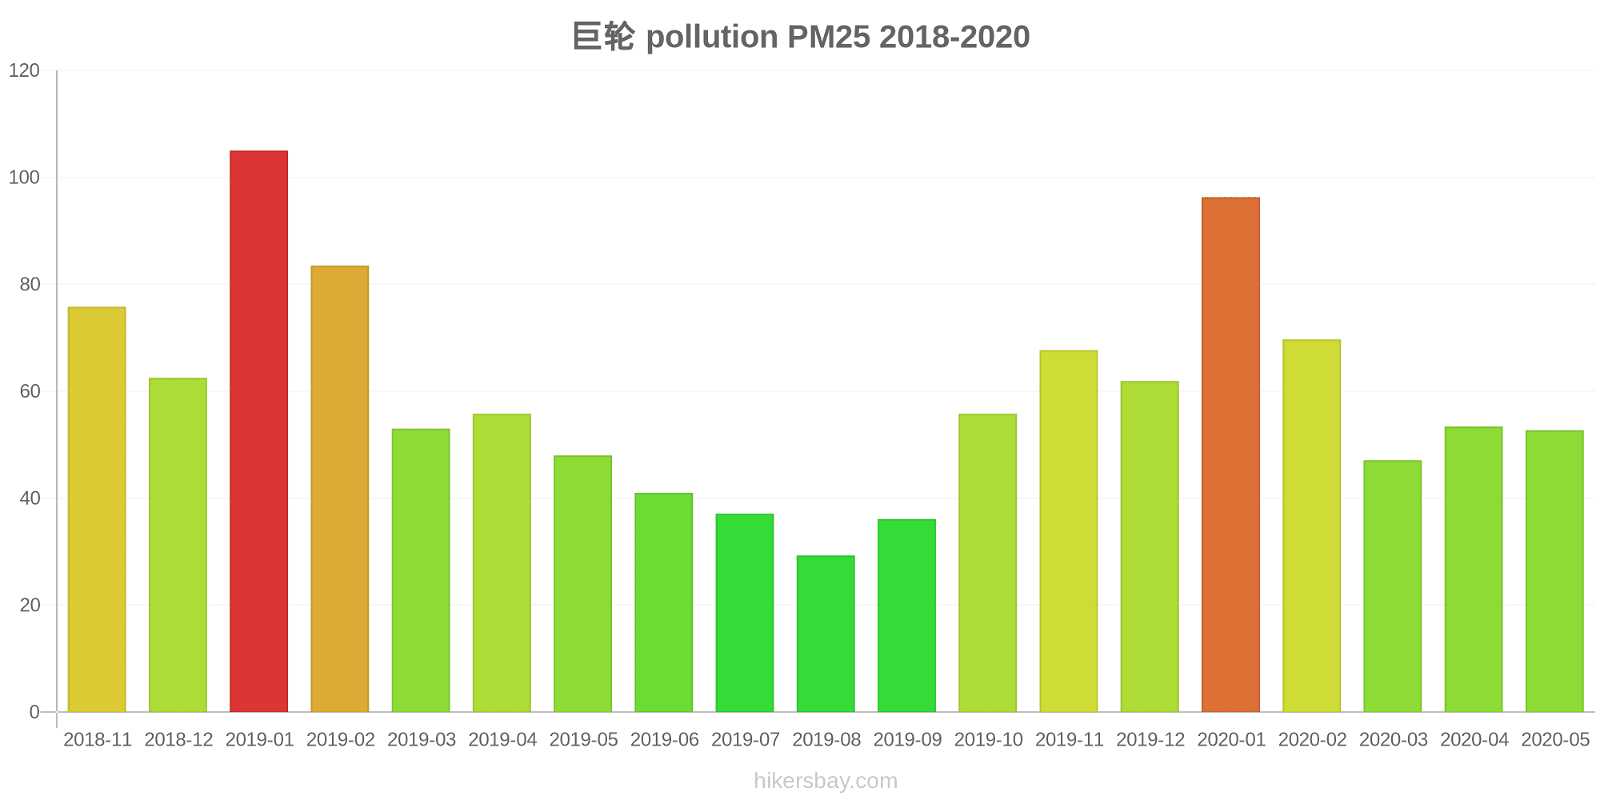
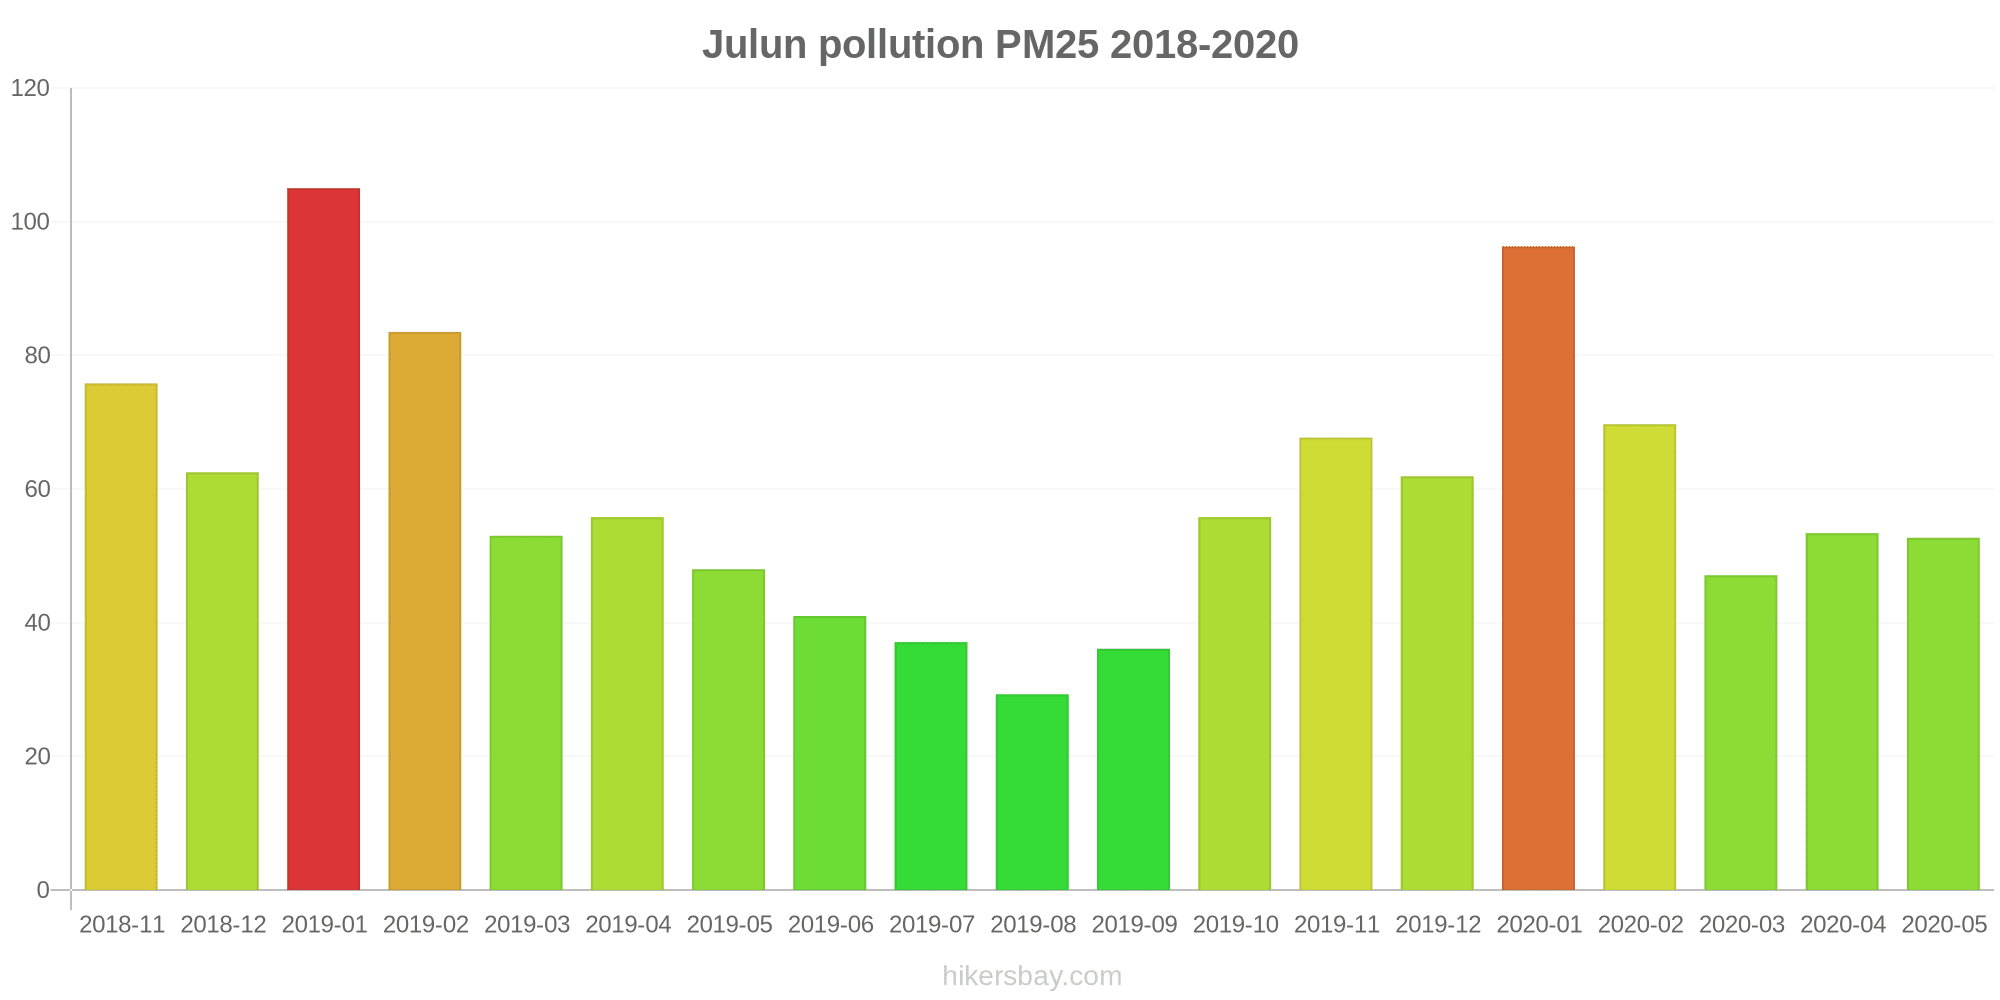
The highest PM2.5 values were recorded: 105 (January 2019).
The lowest level of particulate matter PM2.5 pollution occurs in month: August (29).
How high is the level of NO2? (nitrogen dioxide (NO2))
22 (Good)
What is the level of PM10 today in Julun? (particulate matter (PM10) suspended dust)
The current level of particulate matter PM10 in Julun is:
69 (Unhealthy for Sensitive Groups)
The highest PM10 values usually occur in month: 194 (January 2019).
The lowest value of particulate matter PM10 pollution in Julun is usually recorded in: August (63).
How high is the CO level? (carbon monoxide (CO))
219 (Good)
How is the O3 level today in Julun? (ozone (O3))
0 (Good)
What is the level of SO2 pollution? (sulfur dioxide (SO2))
8 (Good)
Current data Friday, May 27, 2022, 3:00 PM
PM2,5 61 (Unhealthy)
NO2 22 (Good)
PM10 69 (Unhealthy for Sensitive Groups)
CO 219 (Good)
O3 0 (Good)
SO2 8 (Good)
Data on air pollution from recent days in Julun
index
2022-05-27
pm25
28
Moderate
no2
22
Good
pm10
35
Moderate
co
579
Good
o3
22
Good
so2
5
Good
data source »
Air pollution in Julun from November 2018 to May 2020

index
2020-05
2020-04
2020-03
2020-02
2020-01
2019-12
2019-11
2019-10
2019-09
2019-08
2019-07
2019-06
2019-05
2019-04
2019-03
2019-02
2019-01
2018-12
2018-11
pm25
53 (Unhealthy for Sensitive Groups)
53 (Unhealthy for Sensitive Groups)
47 (Unhealthy for Sensitive Groups)
70 (Unhealthy)
96 (Very Unhealthy)
62 (Unhealthy)
68 (Unhealthy)
56 (Unhealthy)
36 (Unhealthy for Sensitive Groups)
29 (Moderate)
37 (Unhealthy for Sensitive Groups)
41 (Unhealthy for Sensitive Groups)
48 (Unhealthy for Sensitive Groups)
56 (Unhealthy)
53 (Unhealthy for Sensitive Groups)
84 (Very Unhealthy)
105 (Very Unhealthy)
63 (Unhealthy)
76 (Very Unhealthy)
co
779 (Good)
679 (Good)
654 (Good)
1 (Good)
1 (Good)
1 (Good)
1 (Good)
967 (Good)
888 (Good)
770 (Good)
784 (Good)
869 (Good)
716 (Good)
958 (Good)
992 (Good)
1 (Good)
2 (Good)
1 (Good)
1 (Good)
no2
49 (Moderate)
59 (Moderate)
48 (Moderate)
44 (Moderate)
59 (Moderate)
60 (Moderate)
63 (Moderate)
55 (Moderate)
59 (Moderate)
42 (Moderate)
44 (Moderate)
48 (Moderate)
53 (Moderate)
58 (Moderate)
56 (Moderate)
53 (Moderate)
74 (Moderate)
61 (Moderate)
67 (Moderate)
o3
160 (Unhealthy)
129 (Unhealthy for Sensitive Groups)
102 (Moderate)
88 (Moderate)
66 (Good)
52 (Good)
57 (Good)
96 (Moderate)
139 (Unhealthy for Sensitive Groups)
151 (Unhealthy)
197 (Very Unhealthy)
204 (Very Unhealthy)
154 (Unhealthy)
123 (Unhealthy for Sensitive Groups)
106 (Moderate)
81 (Moderate)
43 (Good)
47 (Good)
61 (Good)
pm10
114 (Very Unhealthy)
130 (Very Unhealthy)
104 (Unhealthy)
112 (Very Unhealthy)
137 (Very Unhealthy)
114 (Very Unhealthy)
142 (Very Unhealthy)
119 (Very Unhealthy)
89 (Unhealthy)
63 (Unhealthy for Sensitive Groups)
78 (Unhealthy for Sensitive Groups)
90 (Unhealthy)
130 (Very Unhealthy)
140 (Very Unhealthy)
149 (Very Unhealthy)
140 (Very Unhealthy)
194 (Very bad Hazardous)
162 (Very bad Hazardous)
186 (Very bad Hazardous)
so2
11 (Good)
11 (Good)
14 (Good)
21 (Good)
28 (Good)
28 (Good)
23 (Good)
15 (Good)
14 (Good)
11 (Good)
11 (Good)
13 (Good)
17 (Good)
17 (Good)
21 (Good)
35 (Good)
55 (Moderate)
42 (Good)
32 (Good)
data source »
巨轮(启用181031)
Friday, May 27, 2022, 3:00 PM
PM2,5 61 (Unhealthy)
particulate matter (PM2.5) dust
NO2 22 (Good)
nitrogen dioxide (NO2)
PM10 69 (Unhealthy for Sensitive Groups)
particulate matter (PM10) suspended dust
CO 219 (Good)
carbon monoxide (CO)
O3 0.05 (Good)
ozone (O3)
SO2 7.7 (Good)
sulfur dioxide (SO2)
巨轮(启用181031)
index
2022-05-27
pm25
28
no2
22
pm10
35
co
579
o3
22
so2
4.6
巨轮
2018-11 2020-05
index
2020-05
2020-04
2020-03
2020-02
2020-01
2019-12
2019-11
2019-10
2019-09
2019-08
2019-07
2019-06
2019-05
2019-04
2019-03
2019-02
2019-01
2018-12
2018-11
pm25
53
53
47
70
96
62
68
56
36
29
37
41
48
56
53
84
105
63
76
co
779
679
654
1
1
1
1
967
888
770
784
869
716
958
992
1
2
1
1
no2
49
59
48
44
59
60
63
55
59
42
44
48
53
58
56
53
74
61
67
o3
160
129
102
88
66
52
57
96
139
151
197
204
154
123
106
81
43
47
61
pm10
114
130
104
112
137
114
142
119
89
63
78
90
130
140
149
140
194
162
186
so2
11
11
14
21
28
28
23
15
14
11
11
13
17
17
21
35
55
42
32
* Pollution data source:
https://openaq.org
(ChinaAQIData)
The data is licensed under CC-By 4.0
PM2,5 61 (Unhealthy)
NO2 22 (Good)
PM10 69 (Unhealthy for Sensitive Groups)
CO 219 (Good)
O3 0 (Good)
SO2 8 (Good)
Data on air pollution from recent days in Julun
| index | 2022-05-27 |
|---|---|
| pm25 | 28 Moderate |
| no2 | 22 Good |
| pm10 | 35 Moderate |
| co | 579 Good |
| o3 | 22 Good |
| so2 | 5 Good |
| index | 2020-05 | 2020-04 | 2020-03 | 2020-02 | 2020-01 | 2019-12 | 2019-11 | 2019-10 | 2019-09 | 2019-08 | 2019-07 | 2019-06 | 2019-05 | 2019-04 | 2019-03 | 2019-02 | 2019-01 | 2018-12 | 2018-11 |
|---|---|---|---|---|---|---|---|---|---|---|---|---|---|---|---|---|---|---|---|
| pm25 | 53 (Unhealthy for Sensitive Groups) | 53 (Unhealthy for Sensitive Groups) | 47 (Unhealthy for Sensitive Groups) | 70 (Unhealthy) | 96 (Very Unhealthy) | 62 (Unhealthy) | 68 (Unhealthy) | 56 (Unhealthy) | 36 (Unhealthy for Sensitive Groups) | 29 (Moderate) | 37 (Unhealthy for Sensitive Groups) | 41 (Unhealthy for Sensitive Groups) | 48 (Unhealthy for Sensitive Groups) | 56 (Unhealthy) | 53 (Unhealthy for Sensitive Groups) | 84 (Very Unhealthy) | 105 (Very Unhealthy) | 63 (Unhealthy) | 76 (Very Unhealthy) |
| co | 779 (Good) | 679 (Good) | 654 (Good) | 1 (Good) | 1 (Good) | 1 (Good) | 1 (Good) | 967 (Good) | 888 (Good) | 770 (Good) | 784 (Good) | 869 (Good) | 716 (Good) | 958 (Good) | 992 (Good) | 1 (Good) | 2 (Good) | 1 (Good) | 1 (Good) |
| no2 | 49 (Moderate) | 59 (Moderate) | 48 (Moderate) | 44 (Moderate) | 59 (Moderate) | 60 (Moderate) | 63 (Moderate) | 55 (Moderate) | 59 (Moderate) | 42 (Moderate) | 44 (Moderate) | 48 (Moderate) | 53 (Moderate) | 58 (Moderate) | 56 (Moderate) | 53 (Moderate) | 74 (Moderate) | 61 (Moderate) | 67 (Moderate) |
| o3 | 160 (Unhealthy) | 129 (Unhealthy for Sensitive Groups) | 102 (Moderate) | 88 (Moderate) | 66 (Good) | 52 (Good) | 57 (Good) | 96 (Moderate) | 139 (Unhealthy for Sensitive Groups) | 151 (Unhealthy) | 197 (Very Unhealthy) | 204 (Very Unhealthy) | 154 (Unhealthy) | 123 (Unhealthy for Sensitive Groups) | 106 (Moderate) | 81 (Moderate) | 43 (Good) | 47 (Good) | 61 (Good) |
| pm10 | 114 (Very Unhealthy) | 130 (Very Unhealthy) | 104 (Unhealthy) | 112 (Very Unhealthy) | 137 (Very Unhealthy) | 114 (Very Unhealthy) | 142 (Very Unhealthy) | 119 (Very Unhealthy) | 89 (Unhealthy) | 63 (Unhealthy for Sensitive Groups) | 78 (Unhealthy for Sensitive Groups) | 90 (Unhealthy) | 130 (Very Unhealthy) | 140 (Very Unhealthy) | 149 (Very Unhealthy) | 140 (Very Unhealthy) | 194 (Very bad Hazardous) | 162 (Very bad Hazardous) | 186 (Very bad Hazardous) |
| so2 | 11 (Good) | 11 (Good) | 14 (Good) | 21 (Good) | 28 (Good) | 28 (Good) | 23 (Good) | 15 (Good) | 14 (Good) | 11 (Good) | 11 (Good) | 13 (Good) | 17 (Good) | 17 (Good) | 21 (Good) | 35 (Good) | 55 (Moderate) | 42 (Good) | 32 (Good) |
PM2,5 61 (Unhealthy)
particulate matter (PM2.5) dustNO2 22 (Good)
nitrogen dioxide (NO2)PM10 69 (Unhealthy for Sensitive Groups)
particulate matter (PM10) suspended dustCO 219 (Good)
carbon monoxide (CO)O3 0.05 (Good)
ozone (O3)SO2 7.7 (Good)
sulfur dioxide (SO2)巨轮(启用181031)
| index | 2022-05-27 |
|---|---|
| pm25 | 28 |
| no2 | 22 |
| pm10 | 35 |
| co | 579 |
| o3 | 22 |
| so2 | 4.6 |
巨轮

| index | 2020-05 | 2020-04 | 2020-03 | 2020-02 | 2020-01 | 2019-12 | 2019-11 | 2019-10 | 2019-09 | 2019-08 | 2019-07 | 2019-06 | 2019-05 | 2019-04 | 2019-03 | 2019-02 | 2019-01 | 2018-12 | 2018-11 |
|---|---|---|---|---|---|---|---|---|---|---|---|---|---|---|---|---|---|---|---|
| pm25 | 53 | 53 | 47 | 70 | 96 | 62 | 68 | 56 | 36 | 29 | 37 | 41 | 48 | 56 | 53 | 84 | 105 | 63 | 76 |
| co | 779 | 679 | 654 | 1 | 1 | 1 | 1 | 967 | 888 | 770 | 784 | 869 | 716 | 958 | 992 | 1 | 2 | 1 | 1 |
| no2 | 49 | 59 | 48 | 44 | 59 | 60 | 63 | 55 | 59 | 42 | 44 | 48 | 53 | 58 | 56 | 53 | 74 | 61 | 67 |
| o3 | 160 | 129 | 102 | 88 | 66 | 52 | 57 | 96 | 139 | 151 | 197 | 204 | 154 | 123 | 106 | 81 | 43 | 47 | 61 |
| pm10 | 114 | 130 | 104 | 112 | 137 | 114 | 142 | 119 | 89 | 63 | 78 | 90 | 130 | 140 | 149 | 140 | 194 | 162 | 186 |
| so2 | 11 | 11 | 14 | 21 | 28 | 28 | 23 | 15 | 14 | 11 | 11 | 13 | 17 | 17 | 21 | 35 | 55 | 42 | 32 |