Air Pollution in Guangming: Real-time Air Quality Index and smog alert.
Pollution and air quality forecast for Guangming. Today is Tuesday, June 16, 2026. The following air pollution values have been recorded for Guangming:- particulate matter (PM10) suspended dust - 7 (Good)
- particulate matter (PM2.5) dust - 2 (Good)
- carbon monoxide (CO) - 100 (Good)
- nitrogen dioxide (NO2) - 8 (Good)
- ozone (O3) - 0 (Good)
- sulfur dioxide (SO2) - 9 (Good)

What is the air quality in Guangming today? Is the air polluted in Guangming?. Is there smog?
What is the level of PM10 today in Guangming? (particulate matter (PM10) suspended dust)
The current level of particulate matter PM10 in Guangming is:
7 (Good)
The highest PM10 values usually occur in month: 149 (January 2020).
The lowest value of particulate matter PM10 pollution in Guangming is usually recorded in: August (35).
What is the current level of PM2.5 in Guangming? (particulate matter (PM2.5) dust)
Today's PM2.5 level is:
2 (Good)
For comparison, the highest level of PM2.5 in Guangming in the last 7 days was: 24 (Friday, May 27, 2022) and the lowest: 24 (Friday, May 27, 2022).
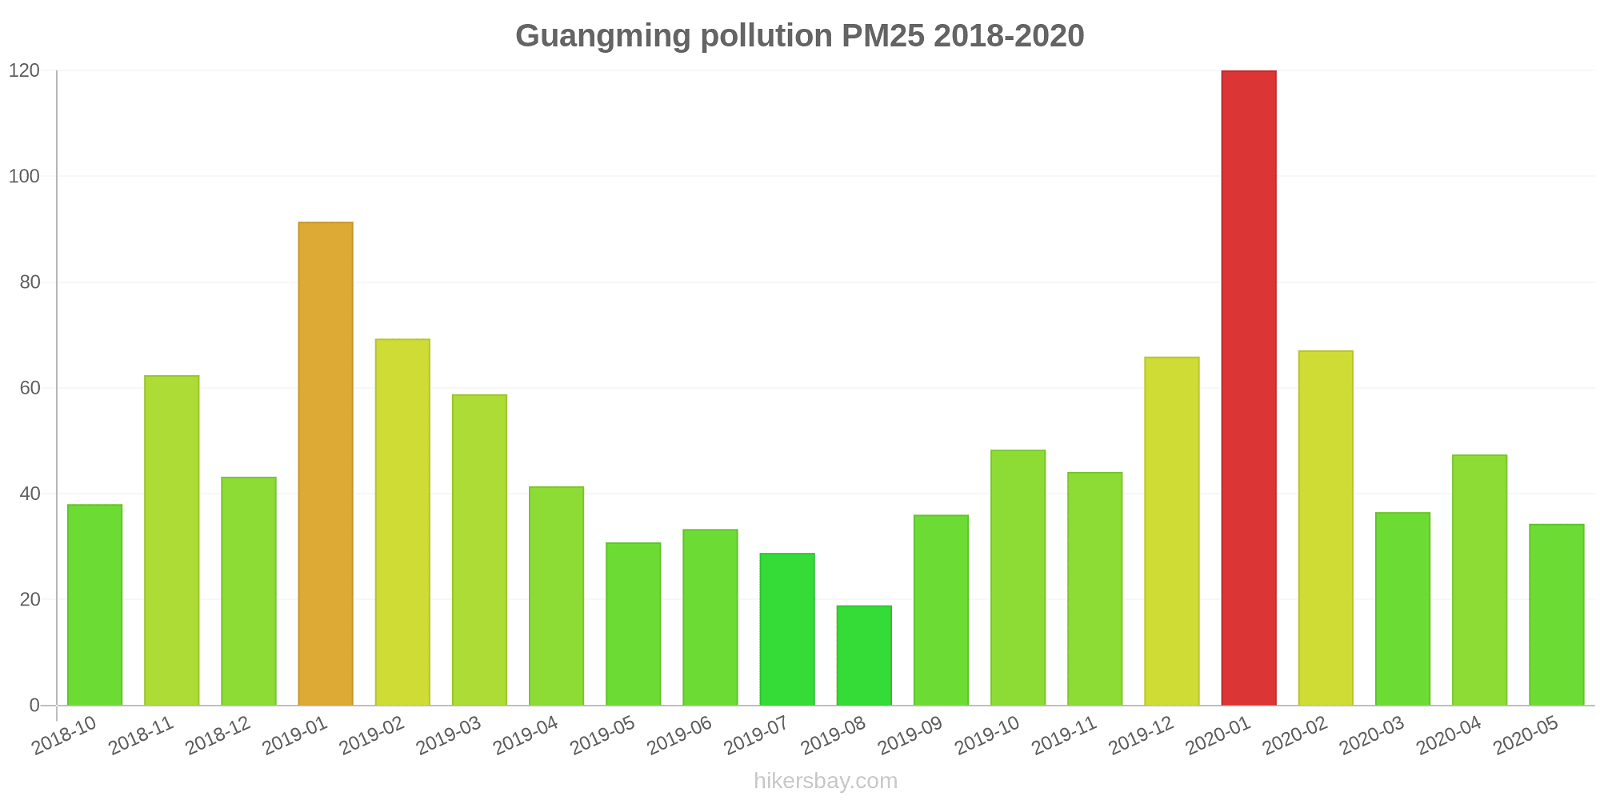
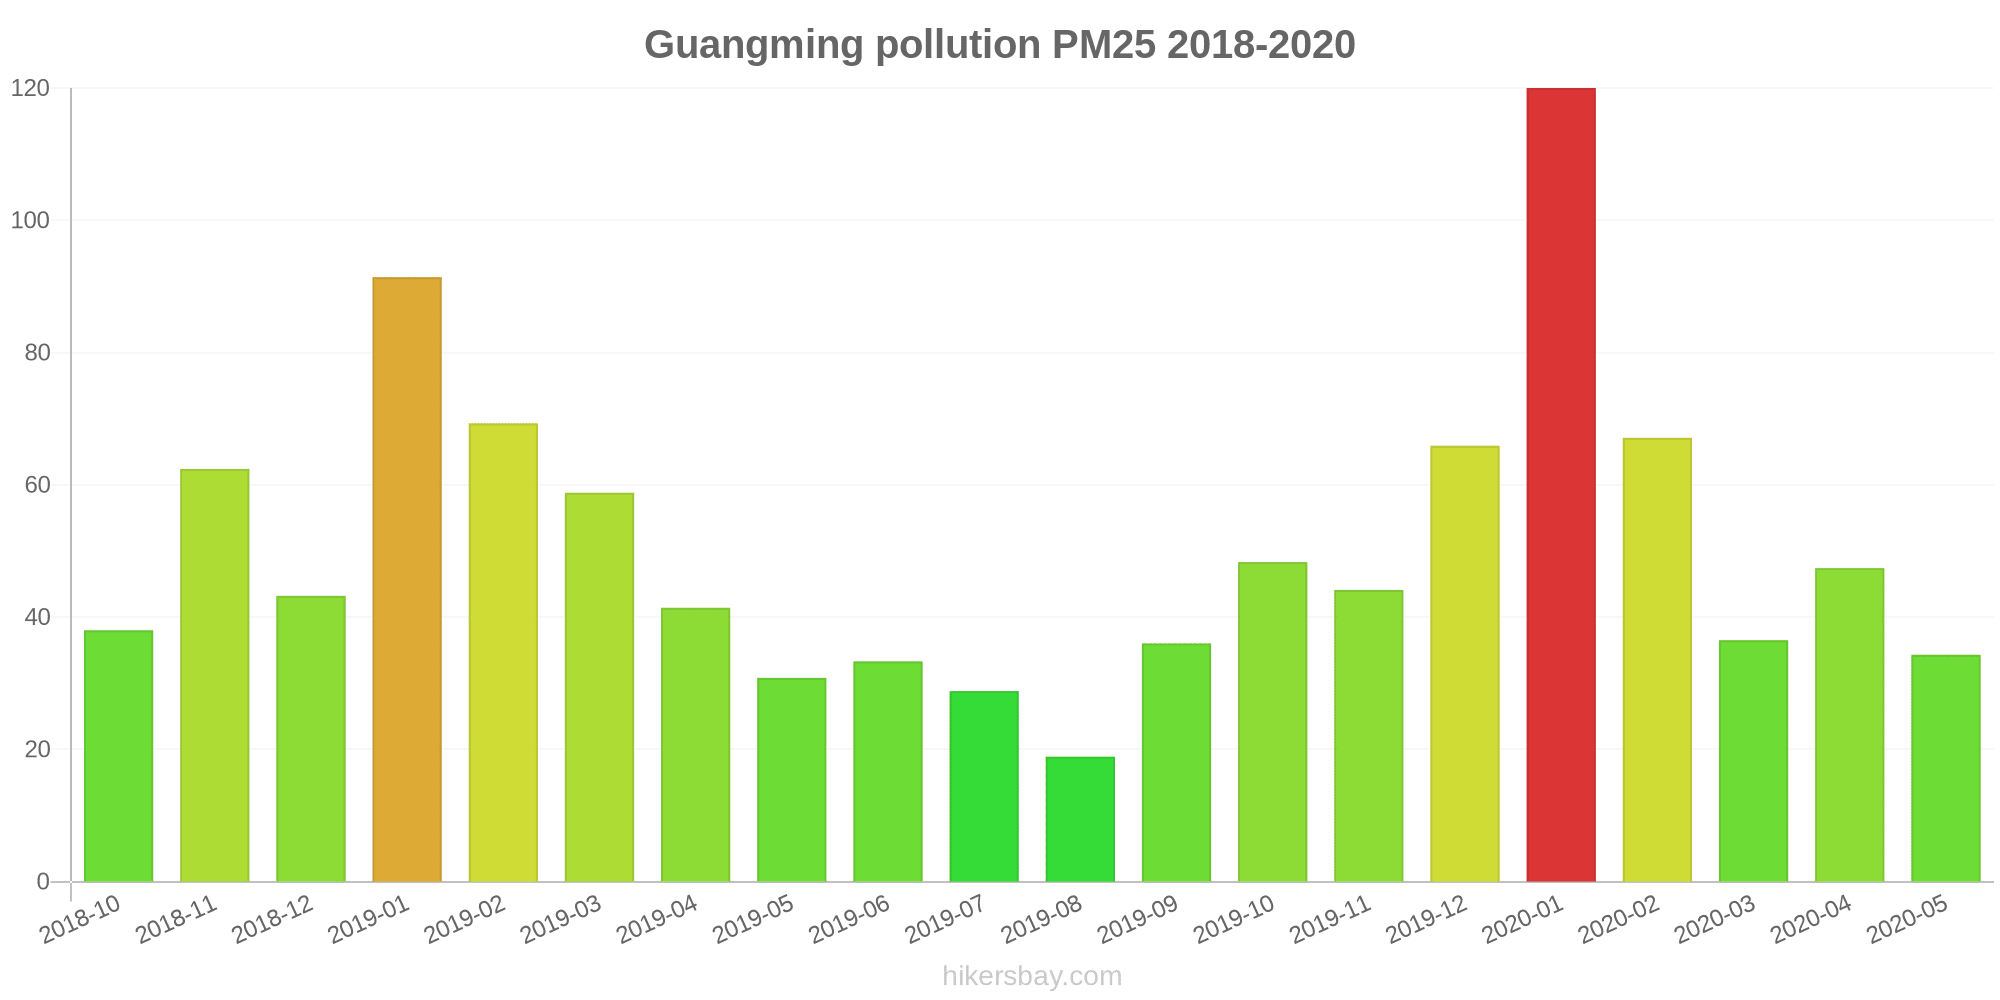
The highest PM2.5 values were recorded: 120 (January 2020).
The lowest level of particulate matter PM2.5 pollution occurs in month: August (19).
How high is the CO level? (carbon monoxide (CO))
100 (Good)
How high is the level of NO2? (nitrogen dioxide (NO2))
8 (Good)
How is the O3 level today in Guangming? (ozone (O3))
0 (Good)
What is the level of SO2 pollution? (sulfur dioxide (SO2))
9 (Good)
Current data Friday, May 27, 2022, 12:00 PM
PM10 7 (Good)
PM2,5 2 (Good)
CO 100 (Good)
NO2 8 (Good)
O3 0 (Good)
SO2 9 (Good)
Data on air pollution from recent days in Guangming
index
2022-05-27
pm10
32
Moderate
pm25
24
Moderate
co
468
Good
no2
21
Good
o3
32
Good
so2
5
Good
data source »
Air pollution in Guangming from October 2018 to May 2020
index
2020-05
2020-04
2020-03
2020-02
2020-01
2019-12
2019-11
2019-10
2019-09
2019-08
2019-07
2019-06
2019-05
2019-04
2019-03
2019-02
2019-01
2018-12
2018-11
2018-10
pm25
34 (Moderate)
47 (Unhealthy for Sensitive Groups)
37 (Unhealthy for Sensitive Groups)
67 (Unhealthy)
120 (Very bad Hazardous)
66 (Unhealthy)
44 (Unhealthy for Sensitive Groups)
48 (Unhealthy for Sensitive Groups)
36 (Unhealthy for Sensitive Groups)
19 (Moderate)
29 (Moderate)
33 (Moderate)
31 (Moderate)
41 (Unhealthy for Sensitive Groups)
59 (Unhealthy)
69 (Unhealthy)
91 (Very Unhealthy)
43 (Unhealthy for Sensitive Groups)
62 (Unhealthy)
38 (Unhealthy for Sensitive Groups)
co
650 (Good)
786 (Good)
775 (Good)
1 (Good)
1 (Good)
1 (Good)
1 (Good)
1 (Good)
937 (Good)
816 (Good)
725 (Good)
667 (Good)
506 (Good)
683 (Good)
700 (Good)
1 (Good)
1 (Good)
1 (Good)
1 (Good)
739 (Good)
no2
26 (Good)
29 (Good)
28 (Good)
31 (Good)
48 (Moderate)
42 (Moderate)
39 (Good)
35 (Good)
28 (Good)
22 (Good)
19 (Good)
18 (Good)
20 (Good)
27 (Good)
31 (Good)
38 (Good)
47 (Moderate)
37 (Good)
43 (Moderate)
34 (Good)
o3
142 (Unhealthy for Sensitive Groups)
140 (Unhealthy for Sensitive Groups)
103 (Moderate)
85 (Moderate)
72 (Moderate)
62 (Good)
65 (Good)
114 (Moderate)
147 (Unhealthy for Sensitive Groups)
130 (Unhealthy for Sensitive Groups)
162 (Unhealthy)
152 (Unhealthy)
161 (Unhealthy)
131 (Unhealthy for Sensitive Groups)
115 (Moderate)
89 (Moderate)
77 (Moderate)
66 (Good)
74 (Moderate)
105 (Moderate)
pm10
62 (Unhealthy for Sensitive Groups)
88 (Unhealthy)
66 (Unhealthy for Sensitive Groups)
96 (Unhealthy)
149 (Very Unhealthy)
88 (Unhealthy)
73 (Unhealthy for Sensitive Groups)
84 (Unhealthy)
65 (Unhealthy for Sensitive Groups)
35 (Moderate)
39 (Moderate)
46 (Moderate)
65 (Unhealthy for Sensitive Groups)
82 (Unhealthy)
99 (Unhealthy)
104 (Unhealthy)
143 (Very Unhealthy)
75 (Unhealthy for Sensitive Groups)
104 (Unhealthy)
98 (Unhealthy)
so2
9.6 (Good)
12 (Good)
12 (Good)
14 (Good)
24 (Good)
17 (Good)
16 (Good)
7.7 (Good)
5 (Good)
4 (Good)
2.6 (Good)
5 (Good)
6.5 (Good)
7.7 (Good)
11 (Good)
18 (Good)
26 (Good)
22 (Good)
17 (Good)
7.6 (Good)
data source »
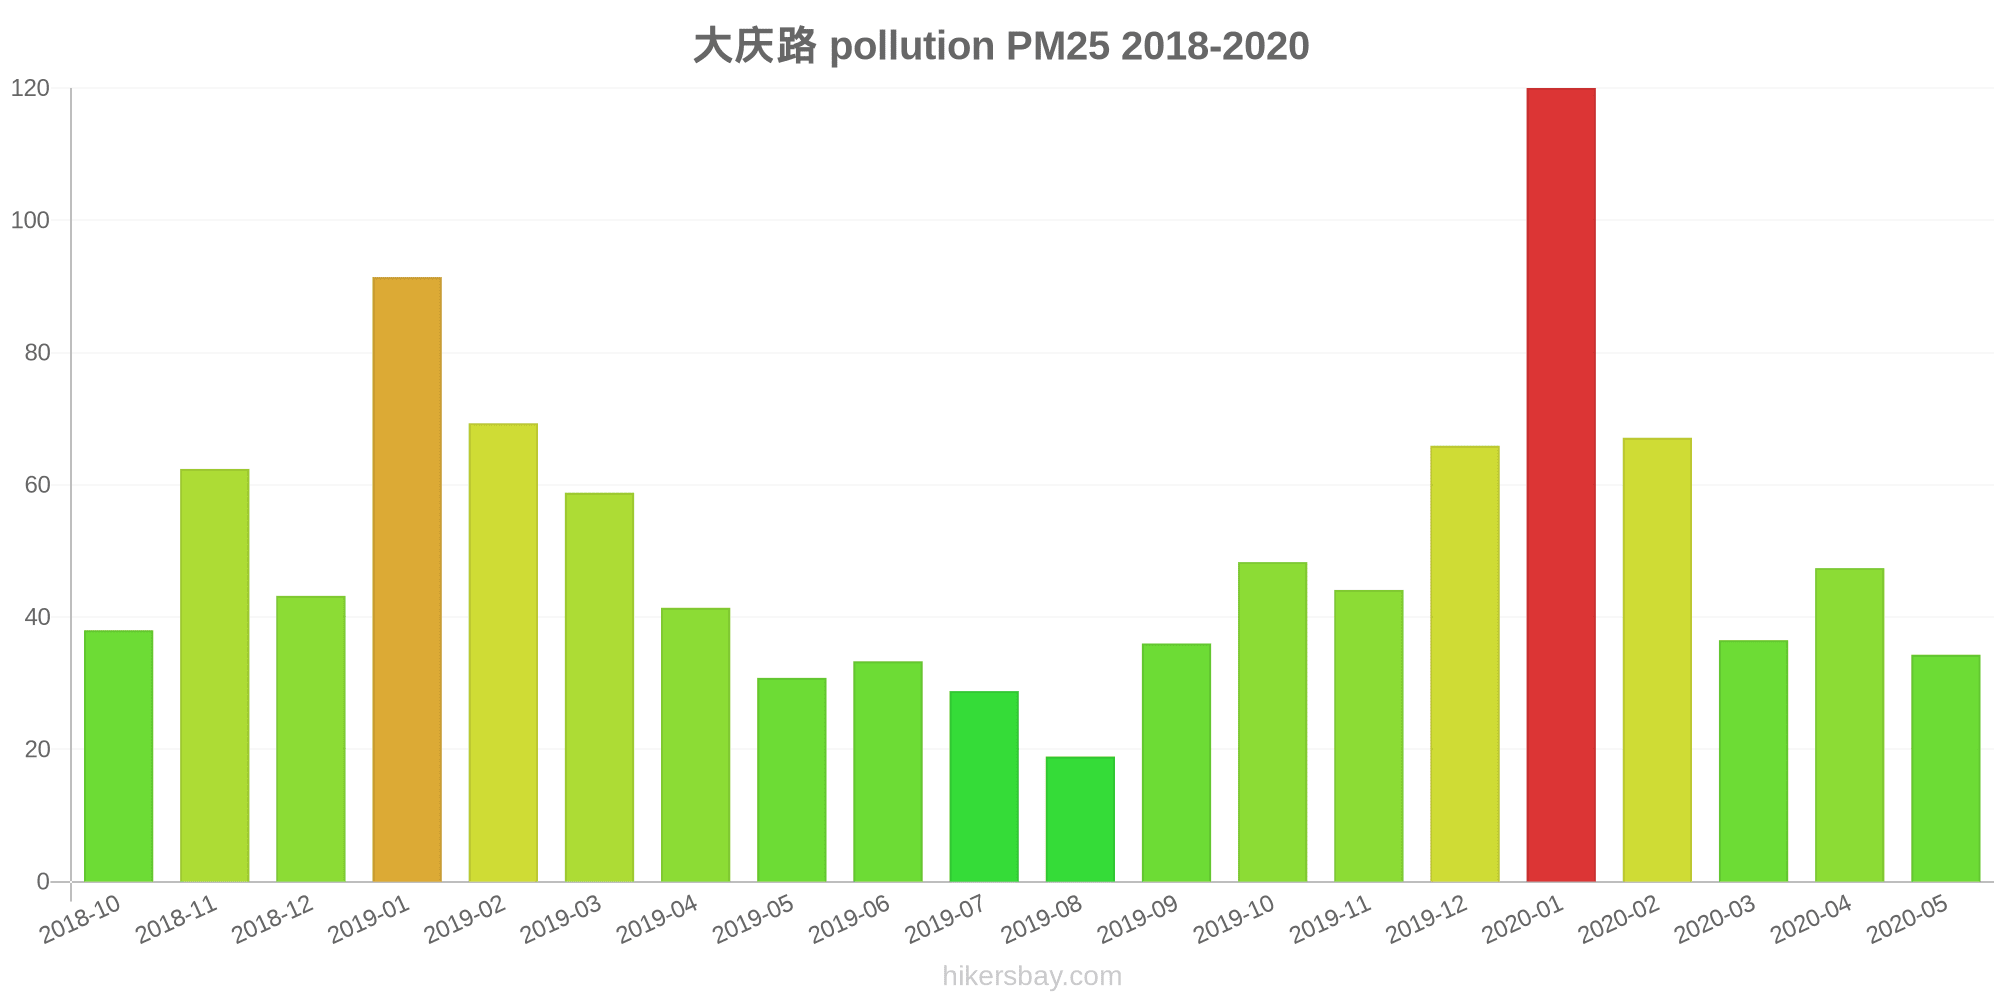
大庆路
Friday, May 27, 2022, 12:00 PM
PM10 6.7 (Good)
particulate matter (PM10) suspended dust
PM2,5 1.7 (Good)
particulate matter (PM2.5) dust
CO 100 (Good)
carbon monoxide (CO)
NO2 7.6 (Good)
nitrogen dioxide (NO2)
O3 0.02 (Good)
ozone (O3)
SO2 8.6 (Good)
sulfur dioxide (SO2)
大庆路
index
2022-05-27
pm10
32
pm25
24
co
468
no2
21
o3
32
so2
4.6
大庆路
2018-10 2020-05

index
2020-05
2020-04
2020-03
2020-02
2020-01
2019-12
2019-11
2019-10
2019-09
2019-08
2019-07
2019-06
2019-05
2019-04
2019-03
2019-02
2019-01
2018-12
2018-11
2018-10
pm25
34
47
37
67
120
66
44
48
36
19
29
33
31
41
59
69
91
43
62
38
co
650
786
775
1
1
1
1
1
937
816
725
667
506
683
700
1
1
1
1
739
no2
26
29
28
31
48
42
39
35
28
22
19
18
20
27
31
38
47
37
43
34
o3
142
140
103
85
72
62
65
114
147
130
162
152
161
131
115
89
77
66
74
105
pm10
62
88
66
96
149
88
73
84
65
35
39
46
65
82
99
104
143
75
104
98
so2
9.6
12
12
14
24
17
16
7.7
5
4
2.6
5
6.5
7.7
11
18
26
22
17
7.6
* Pollution data source:
https://openaq.org
(ChinaAQIData)
The data is licensed under CC-By 4.0
PM10 7 (Good)
PM2,5 2 (Good)
CO 100 (Good)
NO2 8 (Good)
O3 0 (Good)
SO2 9 (Good)
Data on air pollution from recent days in Guangming
| index | 2022-05-27 |
|---|---|
| pm10 | 32 Moderate |
| pm25 | 24 Moderate |
| co | 468 Good |
| no2 | 21 Good |
| o3 | 32 Good |
| so2 | 5 Good |
| index | 2020-05 | 2020-04 | 2020-03 | 2020-02 | 2020-01 | 2019-12 | 2019-11 | 2019-10 | 2019-09 | 2019-08 | 2019-07 | 2019-06 | 2019-05 | 2019-04 | 2019-03 | 2019-02 | 2019-01 | 2018-12 | 2018-11 | 2018-10 |
|---|---|---|---|---|---|---|---|---|---|---|---|---|---|---|---|---|---|---|---|---|
| pm25 | 34 (Moderate) | 47 (Unhealthy for Sensitive Groups) | 37 (Unhealthy for Sensitive Groups) | 67 (Unhealthy) | 120 (Very bad Hazardous) | 66 (Unhealthy) | 44 (Unhealthy for Sensitive Groups) | 48 (Unhealthy for Sensitive Groups) | 36 (Unhealthy for Sensitive Groups) | 19 (Moderate) | 29 (Moderate) | 33 (Moderate) | 31 (Moderate) | 41 (Unhealthy for Sensitive Groups) | 59 (Unhealthy) | 69 (Unhealthy) | 91 (Very Unhealthy) | 43 (Unhealthy for Sensitive Groups) | 62 (Unhealthy) | 38 (Unhealthy for Sensitive Groups) |
| co | 650 (Good) | 786 (Good) | 775 (Good) | 1 (Good) | 1 (Good) | 1 (Good) | 1 (Good) | 1 (Good) | 937 (Good) | 816 (Good) | 725 (Good) | 667 (Good) | 506 (Good) | 683 (Good) | 700 (Good) | 1 (Good) | 1 (Good) | 1 (Good) | 1 (Good) | 739 (Good) |
| no2 | 26 (Good) | 29 (Good) | 28 (Good) | 31 (Good) | 48 (Moderate) | 42 (Moderate) | 39 (Good) | 35 (Good) | 28 (Good) | 22 (Good) | 19 (Good) | 18 (Good) | 20 (Good) | 27 (Good) | 31 (Good) | 38 (Good) | 47 (Moderate) | 37 (Good) | 43 (Moderate) | 34 (Good) |
| o3 | 142 (Unhealthy for Sensitive Groups) | 140 (Unhealthy for Sensitive Groups) | 103 (Moderate) | 85 (Moderate) | 72 (Moderate) | 62 (Good) | 65 (Good) | 114 (Moderate) | 147 (Unhealthy for Sensitive Groups) | 130 (Unhealthy for Sensitive Groups) | 162 (Unhealthy) | 152 (Unhealthy) | 161 (Unhealthy) | 131 (Unhealthy for Sensitive Groups) | 115 (Moderate) | 89 (Moderate) | 77 (Moderate) | 66 (Good) | 74 (Moderate) | 105 (Moderate) |
| pm10 | 62 (Unhealthy for Sensitive Groups) | 88 (Unhealthy) | 66 (Unhealthy for Sensitive Groups) | 96 (Unhealthy) | 149 (Very Unhealthy) | 88 (Unhealthy) | 73 (Unhealthy for Sensitive Groups) | 84 (Unhealthy) | 65 (Unhealthy for Sensitive Groups) | 35 (Moderate) | 39 (Moderate) | 46 (Moderate) | 65 (Unhealthy for Sensitive Groups) | 82 (Unhealthy) | 99 (Unhealthy) | 104 (Unhealthy) | 143 (Very Unhealthy) | 75 (Unhealthy for Sensitive Groups) | 104 (Unhealthy) | 98 (Unhealthy) |
| so2 | 9.6 (Good) | 12 (Good) | 12 (Good) | 14 (Good) | 24 (Good) | 17 (Good) | 16 (Good) | 7.7 (Good) | 5 (Good) | 4 (Good) | 2.6 (Good) | 5 (Good) | 6.5 (Good) | 7.7 (Good) | 11 (Good) | 18 (Good) | 26 (Good) | 22 (Good) | 17 (Good) | 7.6 (Good) |
PM10 6.7 (Good)
particulate matter (PM10) suspended dustPM2,5 1.7 (Good)
particulate matter (PM2.5) dustCO 100 (Good)
carbon monoxide (CO)NO2 7.6 (Good)
nitrogen dioxide (NO2)O3 0.02 (Good)
ozone (O3)SO2 8.6 (Good)
sulfur dioxide (SO2)大庆路
| index | 2022-05-27 |
|---|---|
| pm10 | 32 |
| pm25 | 24 |
| co | 468 |
| no2 | 21 |
| o3 | 32 |
| so2 | 4.6 |
大庆路
| index | 2020-05 | 2020-04 | 2020-03 | 2020-02 | 2020-01 | 2019-12 | 2019-11 | 2019-10 | 2019-09 | 2019-08 | 2019-07 | 2019-06 | 2019-05 | 2019-04 | 2019-03 | 2019-02 | 2019-01 | 2018-12 | 2018-11 | 2018-10 |
|---|---|---|---|---|---|---|---|---|---|---|---|---|---|---|---|---|---|---|---|---|
| pm25 | 34 | 47 | 37 | 67 | 120 | 66 | 44 | 48 | 36 | 19 | 29 | 33 | 31 | 41 | 59 | 69 | 91 | 43 | 62 | 38 |
| co | 650 | 786 | 775 | 1 | 1 | 1 | 1 | 1 | 937 | 816 | 725 | 667 | 506 | 683 | 700 | 1 | 1 | 1 | 1 | 739 |
| no2 | 26 | 29 | 28 | 31 | 48 | 42 | 39 | 35 | 28 | 22 | 19 | 18 | 20 | 27 | 31 | 38 | 47 | 37 | 43 | 34 |
| o3 | 142 | 140 | 103 | 85 | 72 | 62 | 65 | 114 | 147 | 130 | 162 | 152 | 161 | 131 | 115 | 89 | 77 | 66 | 74 | 105 |
| pm10 | 62 | 88 | 66 | 96 | 149 | 88 | 73 | 84 | 65 | 35 | 39 | 46 | 65 | 82 | 99 | 104 | 143 | 75 | 104 | 98 |
| so2 | 9.6 | 12 | 12 | 14 | 24 | 17 | 16 | 7.7 | 5 | 4 | 2.6 | 5 | 6.5 | 7.7 | 11 | 18 | 26 | 22 | 17 | 7.6 |