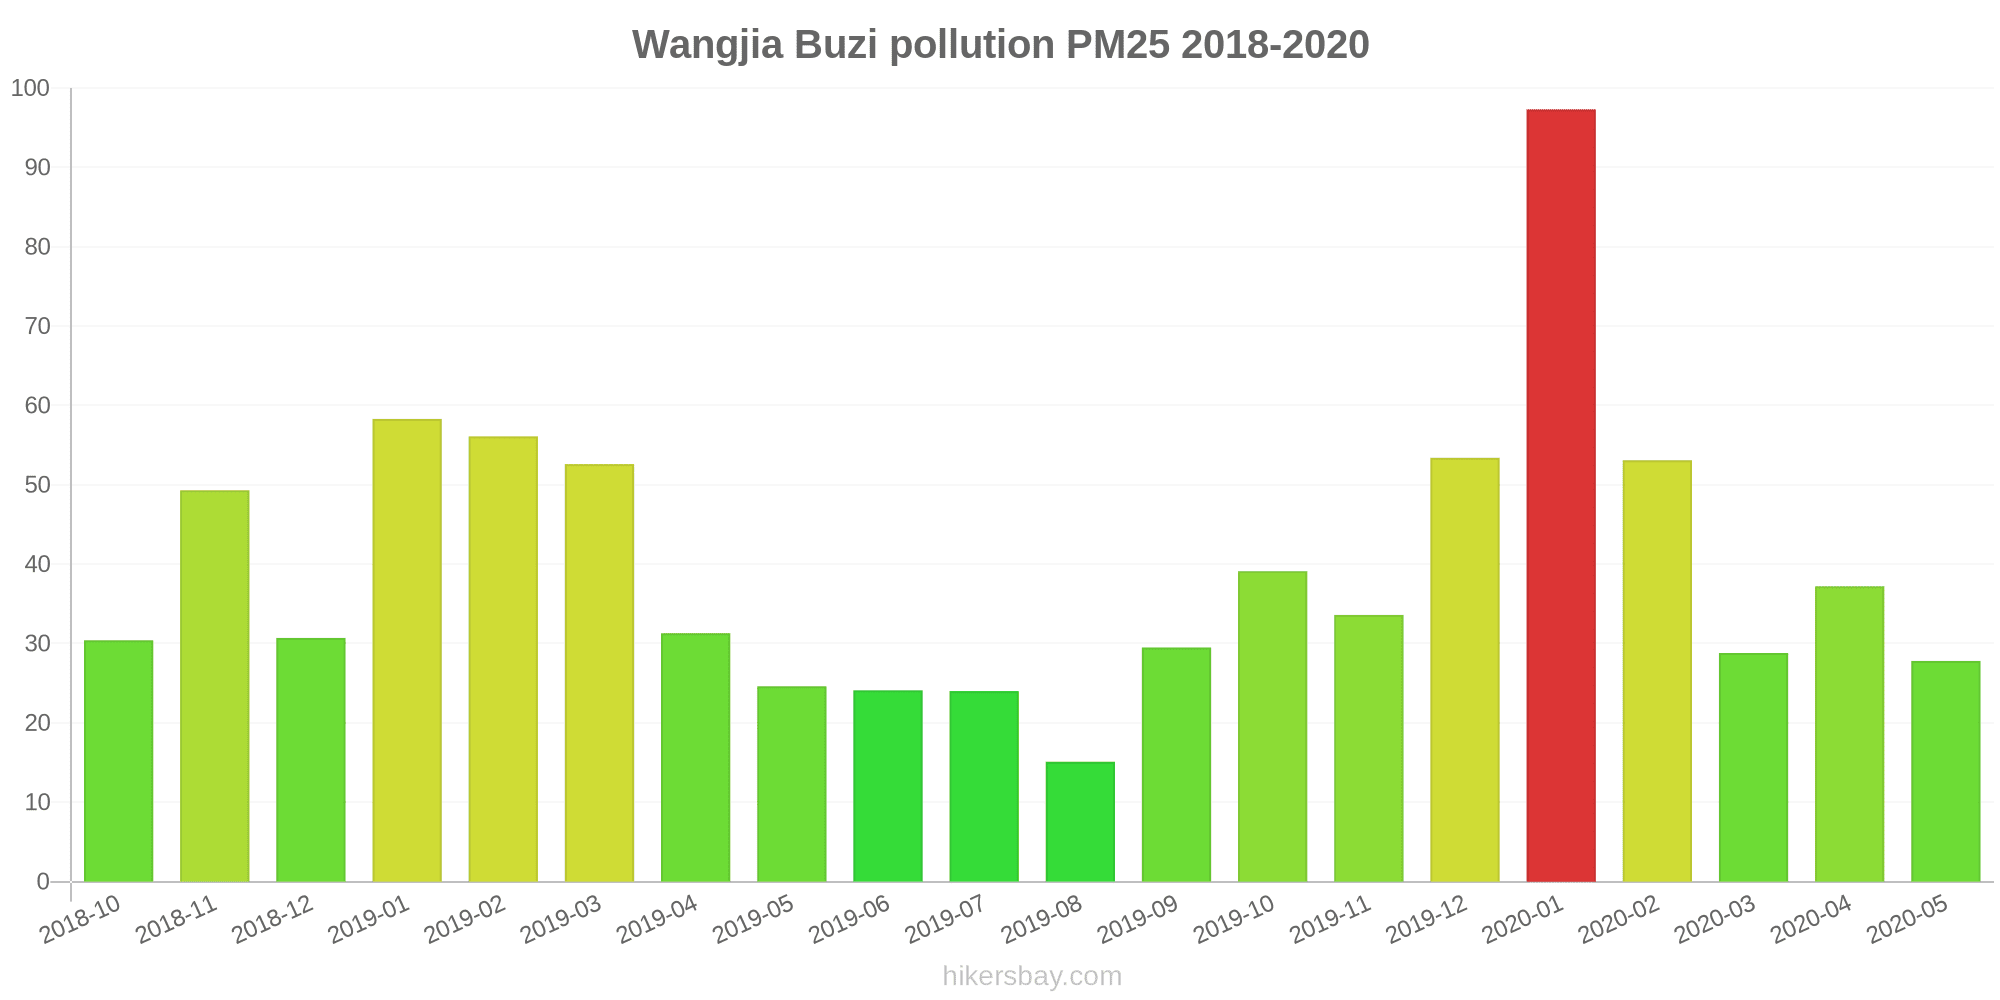
Air Pollution in Wangjia Buzi: Real-time Air Quality Index and smog alert.
Pollution and air quality forecast for Wangjia Buzi. Today is Tuesday, June 16, 2026. The following air pollution values have been recorded for Wangjia Buzi:- particulate matter (PM10) suspended dust - 7 (Good)
- particulate matter (PM2.5) dust - 2 (Good)
- carbon monoxide (CO) - 100 (Good)
- nitrogen dioxide (NO2) - 8 (Good)
- ozone (O3) - 0 (Good)
- sulfur dioxide (SO2) - 9 (Good)

What is the air quality in Wangjia Buzi today? Is the air polluted in Wangjia Buzi?. Is there smog?
What is the level of PM10 today in Wangjia Buzi? (particulate matter (PM10) suspended dust)
The current level of particulate matter PM10 in Wangjia Buzi is:
7 (Good)
The highest PM10 values usually occur in month: 123 (January 2020).
The lowest value of particulate matter PM10 pollution in Wangjia Buzi is usually recorded in: August (29).
What is the current level of PM2.5 in Wangjia Buzi? (particulate matter (PM2.5) dust)
Today's PM2.5 level is:
2 (Good)
For comparison, the highest level of PM2.5 in Wangjia Buzi in the last 7 days was: 24 (Friday, May 27, 2022) and the lowest: 24 (Friday, May 27, 2022).
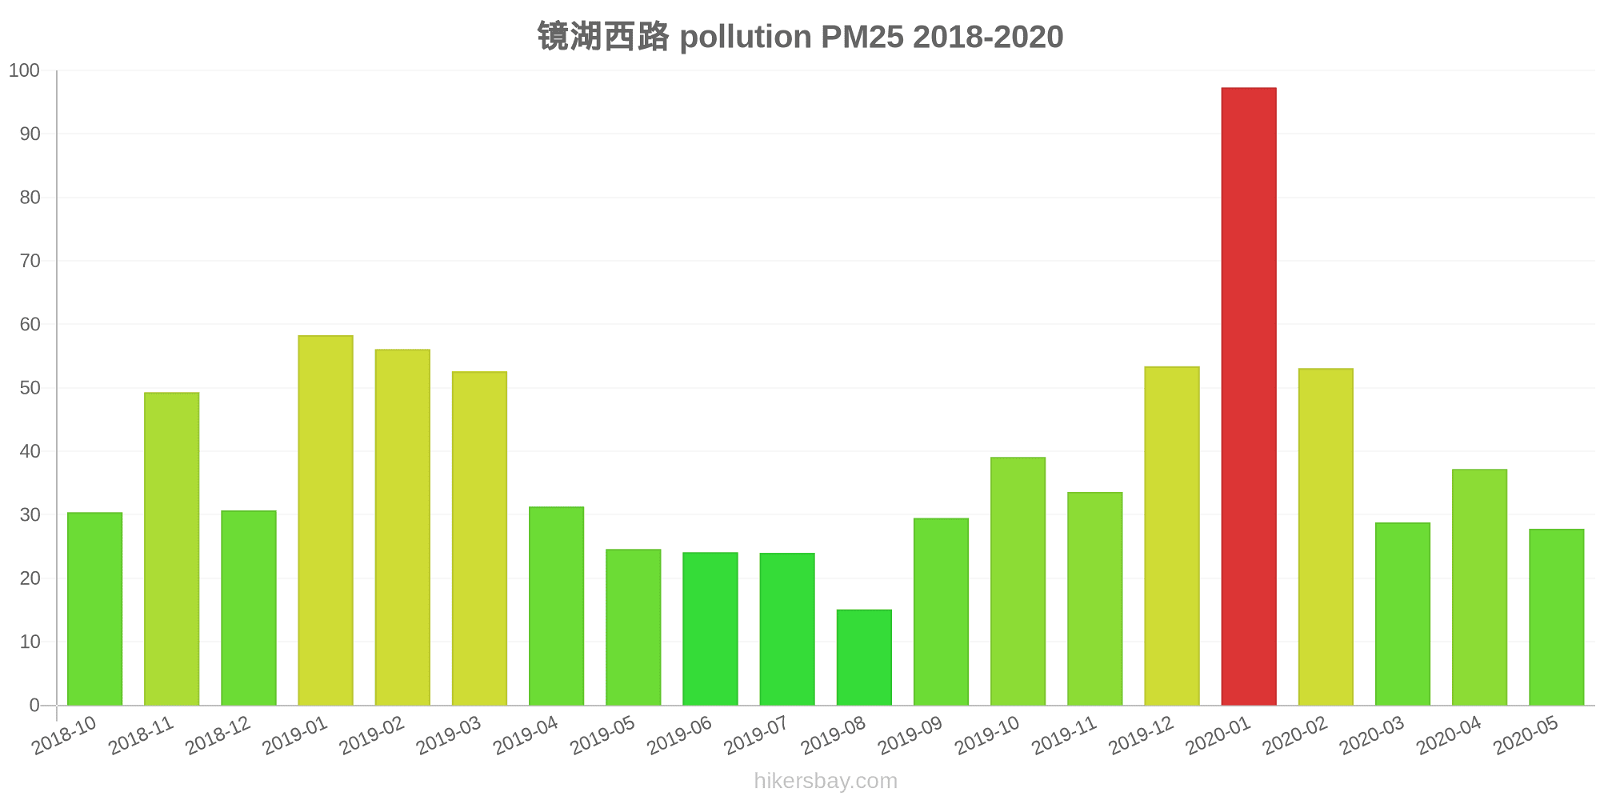
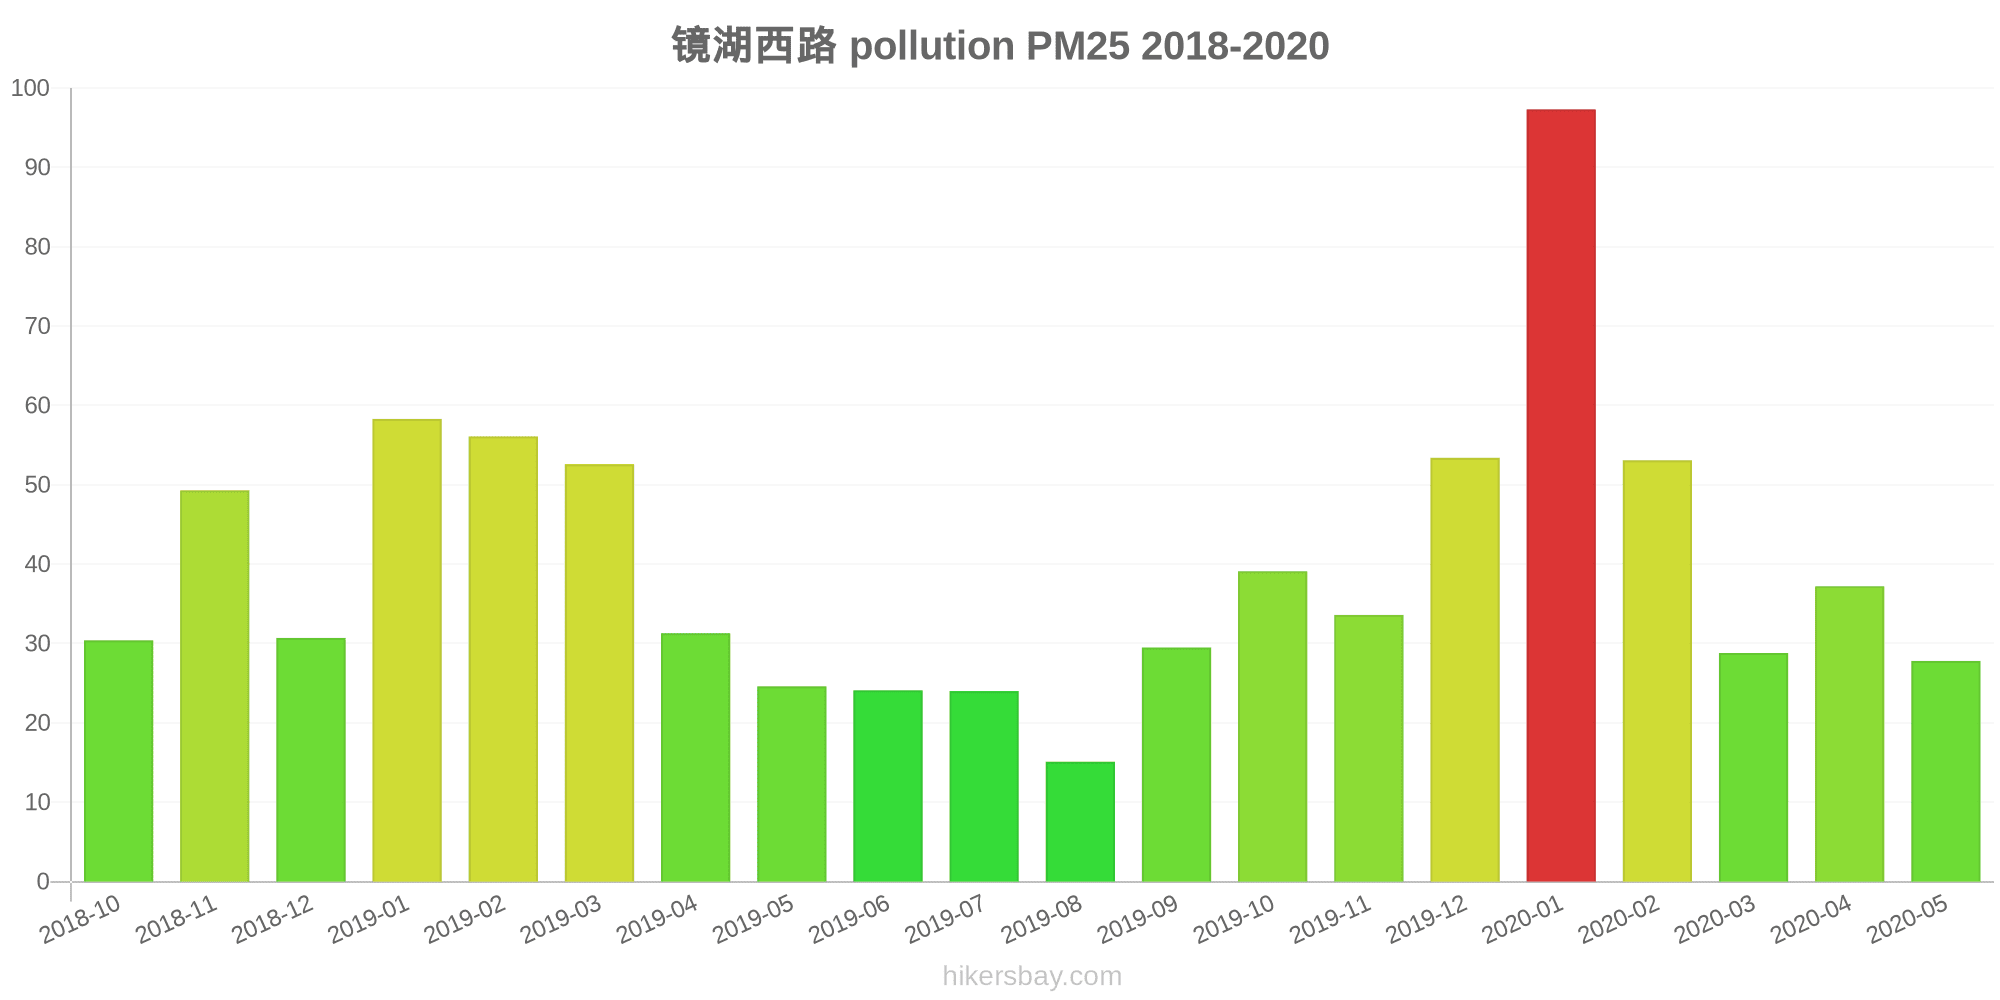
The highest PM2.5 values were recorded: 97 (January 2020).
The lowest level of particulate matter PM2.5 pollution occurs in month: August (15).
How high is the CO level? (carbon monoxide (CO))
100 (Good)
How high is the level of NO2? (nitrogen dioxide (NO2))
8 (Good)
How is the O3 level today in Wangjia Buzi? (ozone (O3))
0 (Good)
What is the level of SO2 pollution? (sulfur dioxide (SO2))
9 (Good)
Current data Friday, May 27, 2022, 12:00 PM
PM10 7 (Good)
PM2,5 2 (Good)
CO 100 (Good)
NO2 8 (Good)
O3 0 (Good)
SO2 9 (Good)
Data on air pollution from recent days in Wangjia Buzi
index
2022-05-27
pm10
32
Moderate
pm25
24
Moderate
co
468
Good
no2
21
Good
o3
32
Good
so2
5
Good
data source »
Air pollution in Wangjia Buzi from October 2018 to May 2020

index
2020-05
2020-04
2020-03
2020-02
2020-01
2019-12
2019-11
2019-10
2019-09
2019-08
2019-07
2019-06
2019-05
2019-04
2019-03
2019-02
2019-01
2018-12
2018-11
2018-10
pm25
28 (Moderate)
37 (Unhealthy for Sensitive Groups)
29 (Moderate)
53 (Unhealthy for Sensitive Groups)
97 (Very Unhealthy)
53 (Unhealthy for Sensitive Groups)
34 (Moderate)
39 (Unhealthy for Sensitive Groups)
30 (Moderate)
15 (Moderate)
24 (Moderate)
24 (Moderate)
25 (Moderate)
31 (Moderate)
53 (Unhealthy for Sensitive Groups)
56 (Unhealthy)
58 (Unhealthy)
31 (Moderate)
49 (Unhealthy for Sensitive Groups)
30 (Moderate)
co
709 (Good)
822 (Good)
838 (Good)
1 (Good)
1 (Good)
1 (Good)
966 (Good)
887 (Good)
843 (Good)
703 (Good)
751 (Good)
607 (Good)
441 (Good)
536 (Good)
678 (Good)
917 (Good)
1 (Good)
724 (Good)
976 (Good)
616 (Good)
no2
28 (Good)
32 (Good)
28 (Good)
30 (Good)
51 (Moderate)
37 (Good)
32 (Good)
28 (Good)
22 (Good)
19 (Good)
17 (Good)
21 (Good)
20 (Good)
29 (Good)
32 (Good)
32 (Good)
37 (Good)
29 (Good)
41 (Moderate)
28 (Good)
o3
144 (Unhealthy for Sensitive Groups)
138 (Unhealthy for Sensitive Groups)
101 (Moderate)
85 (Moderate)
66 (Good)
61 (Good)
67 (Good)
110 (Moderate)
142 (Unhealthy for Sensitive Groups)
117 (Moderate)
163 (Unhealthy)
158 (Unhealthy)
164 (Unhealthy)
123 (Unhealthy for Sensitive Groups)
115 (Moderate)
80 (Moderate)
68 (Good)
64 (Good)
77 (Moderate)
102 (Moderate)
pm10
57 (Unhealthy for Sensitive Groups)
80 (Unhealthy)
61 (Unhealthy for Sensitive Groups)
84 (Unhealthy)
123 (Very Unhealthy)
77 (Unhealthy for Sensitive Groups)
67 (Unhealthy for Sensitive Groups)
80 (Unhealthy for Sensitive Groups)
60 (Unhealthy for Sensitive Groups)
29 (Moderate)
40 (Moderate)
43 (Moderate)
61 (Unhealthy for Sensitive Groups)
68 (Unhealthy for Sensitive Groups)
87 (Unhealthy)
85 (Unhealthy)
97 (Unhealthy)
62 (Unhealthy for Sensitive Groups)
84 (Unhealthy)
60 (Unhealthy for Sensitive Groups)
so2
8.1 (Good)
11 (Good)
9.1 (Good)
11 (Good)
20 (Good)
14 (Good)
13 (Good)
7.6 (Good)
5.6 (Good)
4.4 (Good)
4.8 (Good)
5.8 (Good)
8.2 (Good)
9.6 (Good)
12 (Good)
17 (Good)
21 (Good)
16 (Good)
17 (Good)
8.9 (Good)
data source »
镜湖西路
Friday, May 27, 2022, 12:00 PM
PM10 6.7 (Good)
particulate matter (PM10) suspended dust
PM2,5 1.7 (Good)
particulate matter (PM2.5) dust
CO 100 (Good)
carbon monoxide (CO)
NO2 7.6 (Good)
nitrogen dioxide (NO2)
O3 0.02 (Good)
ozone (O3)
SO2 8.6 (Good)
sulfur dioxide (SO2)
镜湖西路
index
2022-05-27
pm10
32
pm25
24
co
468
no2
21
o3
32
so2
4.6
镜湖西路
2018-10 2020-05
index
2020-05
2020-04
2020-03
2020-02
2020-01
2019-12
2019-11
2019-10
2019-09
2019-08
2019-07
2019-06
2019-05
2019-04
2019-03
2019-02
2019-01
2018-12
2018-11
2018-10
pm25
28
37
29
53
97
53
34
39
30
15
24
24
25
31
53
56
58
31
49
30
co
709
822
838
1
1
1
966
887
843
703
751
607
441
536
678
917
1
724
976
616
no2
28
32
28
30
51
37
32
28
22
19
17
21
20
29
32
32
37
29
41
28
o3
144
138
101
85
66
61
67
110
142
117
163
158
164
123
115
80
68
64
77
102
pm10
57
80
61
84
123
77
67
80
60
29
40
43
61
68
87
85
97
62
84
60
so2
8.1
11
9.1
11
20
14
13
7.6
5.6
4.4
4.8
5.8
8.2
9.6
12
17
21
16
17
8.9
* Pollution data source:
https://openaq.org
(ChinaAQIData)
The data is licensed under CC-By 4.0
PM10 7 (Good)
PM2,5 2 (Good)
CO 100 (Good)
NO2 8 (Good)
O3 0 (Good)
SO2 9 (Good)
Data on air pollution from recent days in Wangjia Buzi
| index | 2022-05-27 |
|---|---|
| pm10 | 32 Moderate |
| pm25 | 24 Moderate |
| co | 468 Good |
| no2 | 21 Good |
| o3 | 32 Good |
| so2 | 5 Good |
| index | 2020-05 | 2020-04 | 2020-03 | 2020-02 | 2020-01 | 2019-12 | 2019-11 | 2019-10 | 2019-09 | 2019-08 | 2019-07 | 2019-06 | 2019-05 | 2019-04 | 2019-03 | 2019-02 | 2019-01 | 2018-12 | 2018-11 | 2018-10 |
|---|---|---|---|---|---|---|---|---|---|---|---|---|---|---|---|---|---|---|---|---|
| pm25 | 28 (Moderate) | 37 (Unhealthy for Sensitive Groups) | 29 (Moderate) | 53 (Unhealthy for Sensitive Groups) | 97 (Very Unhealthy) | 53 (Unhealthy for Sensitive Groups) | 34 (Moderate) | 39 (Unhealthy for Sensitive Groups) | 30 (Moderate) | 15 (Moderate) | 24 (Moderate) | 24 (Moderate) | 25 (Moderate) | 31 (Moderate) | 53 (Unhealthy for Sensitive Groups) | 56 (Unhealthy) | 58 (Unhealthy) | 31 (Moderate) | 49 (Unhealthy for Sensitive Groups) | 30 (Moderate) |
| co | 709 (Good) | 822 (Good) | 838 (Good) | 1 (Good) | 1 (Good) | 1 (Good) | 966 (Good) | 887 (Good) | 843 (Good) | 703 (Good) | 751 (Good) | 607 (Good) | 441 (Good) | 536 (Good) | 678 (Good) | 917 (Good) | 1 (Good) | 724 (Good) | 976 (Good) | 616 (Good) |
| no2 | 28 (Good) | 32 (Good) | 28 (Good) | 30 (Good) | 51 (Moderate) | 37 (Good) | 32 (Good) | 28 (Good) | 22 (Good) | 19 (Good) | 17 (Good) | 21 (Good) | 20 (Good) | 29 (Good) | 32 (Good) | 32 (Good) | 37 (Good) | 29 (Good) | 41 (Moderate) | 28 (Good) |
| o3 | 144 (Unhealthy for Sensitive Groups) | 138 (Unhealthy for Sensitive Groups) | 101 (Moderate) | 85 (Moderate) | 66 (Good) | 61 (Good) | 67 (Good) | 110 (Moderate) | 142 (Unhealthy for Sensitive Groups) | 117 (Moderate) | 163 (Unhealthy) | 158 (Unhealthy) | 164 (Unhealthy) | 123 (Unhealthy for Sensitive Groups) | 115 (Moderate) | 80 (Moderate) | 68 (Good) | 64 (Good) | 77 (Moderate) | 102 (Moderate) |
| pm10 | 57 (Unhealthy for Sensitive Groups) | 80 (Unhealthy) | 61 (Unhealthy for Sensitive Groups) | 84 (Unhealthy) | 123 (Very Unhealthy) | 77 (Unhealthy for Sensitive Groups) | 67 (Unhealthy for Sensitive Groups) | 80 (Unhealthy for Sensitive Groups) | 60 (Unhealthy for Sensitive Groups) | 29 (Moderate) | 40 (Moderate) | 43 (Moderate) | 61 (Unhealthy for Sensitive Groups) | 68 (Unhealthy for Sensitive Groups) | 87 (Unhealthy) | 85 (Unhealthy) | 97 (Unhealthy) | 62 (Unhealthy for Sensitive Groups) | 84 (Unhealthy) | 60 (Unhealthy for Sensitive Groups) |
| so2 | 8.1 (Good) | 11 (Good) | 9.1 (Good) | 11 (Good) | 20 (Good) | 14 (Good) | 13 (Good) | 7.6 (Good) | 5.6 (Good) | 4.4 (Good) | 4.8 (Good) | 5.8 (Good) | 8.2 (Good) | 9.6 (Good) | 12 (Good) | 17 (Good) | 21 (Good) | 16 (Good) | 17 (Good) | 8.9 (Good) |
PM10 6.7 (Good)
particulate matter (PM10) suspended dustPM2,5 1.7 (Good)
particulate matter (PM2.5) dustCO 100 (Good)
carbon monoxide (CO)NO2 7.6 (Good)
nitrogen dioxide (NO2)O3 0.02 (Good)
ozone (O3)SO2 8.6 (Good)
sulfur dioxide (SO2)镜湖西路
| index | 2022-05-27 |
|---|---|
| pm10 | 32 |
| pm25 | 24 |
| co | 468 |
| no2 | 21 |
| o3 | 32 |
| so2 | 4.6 |
镜湖西路
| index | 2020-05 | 2020-04 | 2020-03 | 2020-02 | 2020-01 | 2019-12 | 2019-11 | 2019-10 | 2019-09 | 2019-08 | 2019-07 | 2019-06 | 2019-05 | 2019-04 | 2019-03 | 2019-02 | 2019-01 | 2018-12 | 2018-11 | 2018-10 |
|---|---|---|---|---|---|---|---|---|---|---|---|---|---|---|---|---|---|---|---|---|
| pm25 | 28 | 37 | 29 | 53 | 97 | 53 | 34 | 39 | 30 | 15 | 24 | 24 | 25 | 31 | 53 | 56 | 58 | 31 | 49 | 30 |
| co | 709 | 822 | 838 | 1 | 1 | 1 | 966 | 887 | 843 | 703 | 751 | 607 | 441 | 536 | 678 | 917 | 1 | 724 | 976 | 616 |
| no2 | 28 | 32 | 28 | 30 | 51 | 37 | 32 | 28 | 22 | 19 | 17 | 21 | 20 | 29 | 32 | 32 | 37 | 29 | 41 | 28 |
| o3 | 144 | 138 | 101 | 85 | 66 | 61 | 67 | 110 | 142 | 117 | 163 | 158 | 164 | 123 | 115 | 80 | 68 | 64 | 77 | 102 |
| pm10 | 57 | 80 | 61 | 84 | 123 | 77 | 67 | 80 | 60 | 29 | 40 | 43 | 61 | 68 | 87 | 85 | 97 | 62 | 84 | 60 |
| so2 | 8.1 | 11 | 9.1 | 11 | 20 | 14 | 13 | 7.6 | 5.6 | 4.4 | 4.8 | 5.8 | 8.2 | 9.6 | 12 | 17 | 21 | 16 | 17 | 8.9 |