Air Pollution in Zhaojia Xinwu: Real-time Air Quality Index and smog alert.
Pollution and air quality forecast for Zhaojia Xinwu. Today is Tuesday, June 2, 2026. The following air pollution values have been recorded for Zhaojia Xinwu:- particulate matter (PM10) suspended dust - 179 (Very bad Hazardous)
- particulate matter (PM2.5) dust - 35 (Unhealthy for Sensitive Groups)
- ozone (O3) - 0 (Good)
- nitrogen dioxide (NO2) - 0 (Good)
- sulfur dioxide (SO2) - 0 (Good)

What is the air quality in Zhaojia Xinwu today? Is the air polluted in Zhaojia Xinwu?. Is there smog?
What is the level of PM10 today in Zhaojia Xinwu? (particulate matter (PM10) suspended dust)
The current level of particulate matter PM10 in Zhaojia Xinwu is:
179 (Very bad Hazardous)
The highest PM10 values usually occur in month: 120 (January 2019).
The lowest value of particulate matter PM10 pollution in Zhaojia Xinwu is usually recorded in: July (39).
What is the current level of PM2.5 in Zhaojia Xinwu? (particulate matter (PM2.5) dust)
Today's PM2.5 level is:
35 (Unhealthy for Sensitive Groups)
For comparison, the highest level of PM2.5 in Zhaojia Xinwu in the last 7 days was: 56 (Friday, May 27, 2022) and the lowest: 56 (Friday, May 27, 2022).
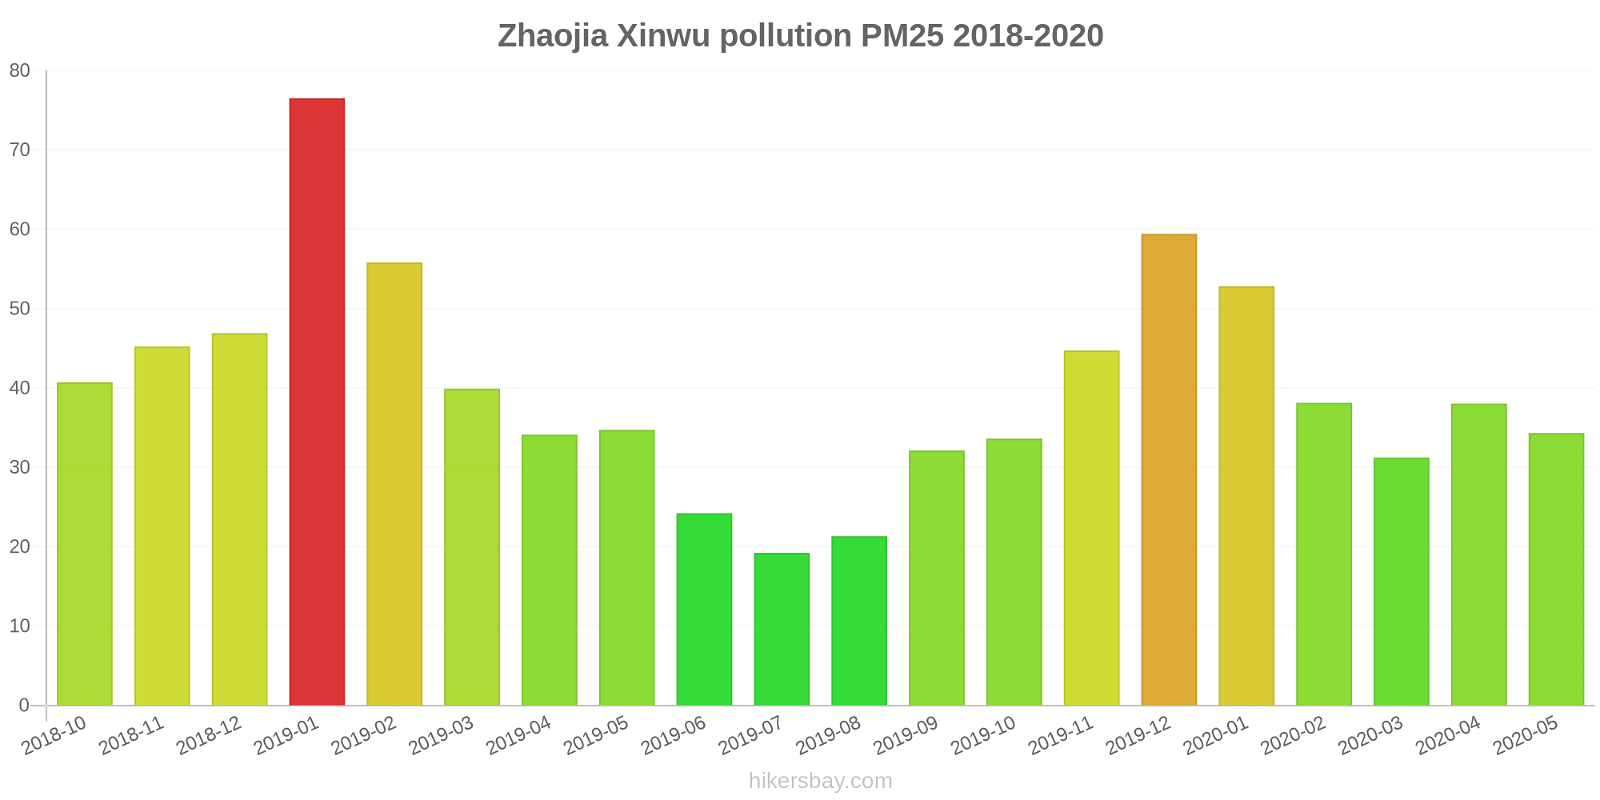
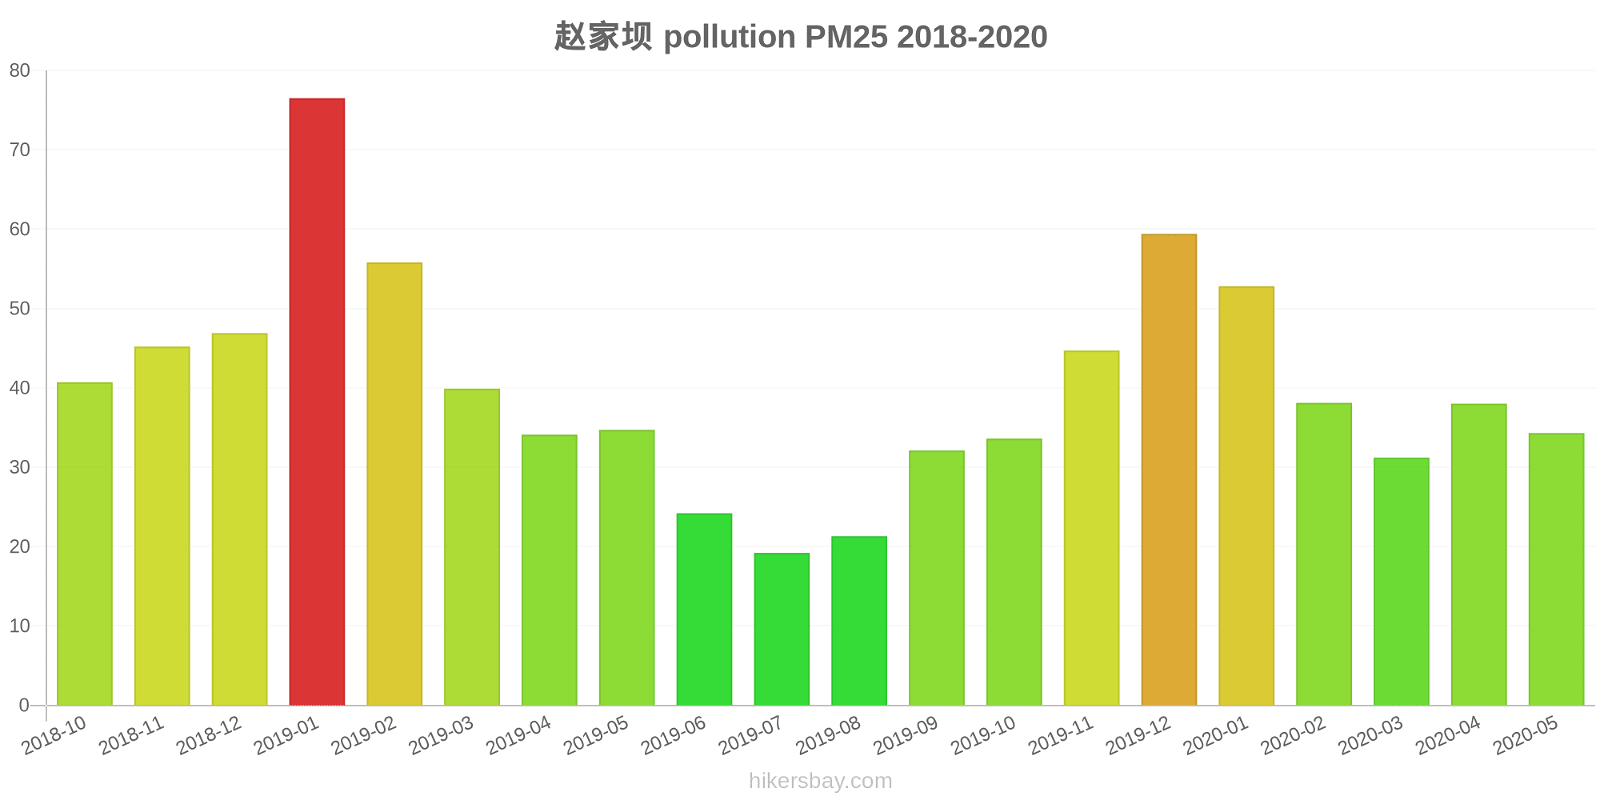
The highest PM2.5 values were recorded: 77 (January 2019).
The lowest level of particulate matter PM2.5 pollution occurs in month: July (19).
How is the O3 level today in Zhaojia Xinwu? (ozone (O3))
0 (Good)
How high is the level of NO2? (nitrogen dioxide (NO2))
0 (Good)
What is the level of SO2 pollution? (sulfur dioxide (SO2))
0 (Good)
Current data Friday, May 27, 2022, 12:00 PM
PM10 179 (Very bad Hazardous)
PM2,5 35 (Unhealthy for Sensitive Groups)
O3 0 (Good)
NO2 0 (Good)
SO2 0 (Good)
Data on air pollution from recent days in Zhaojia Xinwu
index
2022-05-27
pm10
56
Unhealthy for Sensitive Groups
pm25
56
Unhealthy
o3
0
Good
no2
0
Good
so2
0
Good
data source »
Air pollution in Zhaojia Xinwu from October 2018 to May 2020
index
2020-05
2020-04
2020-03
2020-02
2020-01
2019-12
2019-11
2019-10
2019-09
2019-08
2019-07
2019-06
2019-05
2019-04
2019-03
2019-02
2019-01
2018-12
2018-11
2018-10
pm25
34 (Moderate)
38 (Unhealthy for Sensitive Groups)
31 (Moderate)
38 (Unhealthy for Sensitive Groups)
53 (Unhealthy for Sensitive Groups)
59 (Unhealthy)
45 (Unhealthy for Sensitive Groups)
34 (Moderate)
32 (Moderate)
21 (Moderate)
19 (Moderate)
24 (Moderate)
35 (Moderate)
34 (Moderate)
40 (Unhealthy for Sensitive Groups)
56 (Unhealthy)
77 (Very Unhealthy)
47 (Unhealthy for Sensitive Groups)
45 (Unhealthy for Sensitive Groups)
41 (Unhealthy for Sensitive Groups)
co
1 (Good)
827 (Good)
1 (Good)
1 (Good)
1 (Good)
1 (Good)
996 (Good)
992 (Good)
777 (Good)
939 (Good)
811 (Good)
887 (Good)
867 (Good)
878 (Good)
776 (Good)
1 (Good)
1 (Good)
993 (Good)
1 (Good)
973 (Good)
no2
26 (Good)
29 (Good)
17 (Good)
16 (Good)
29 (Good)
53 (Moderate)
47 (Moderate)
36 (Good)
24 (Good)
17 (Good)
19 (Good)
22 (Good)
28 (Good)
28 (Good)
34 (Good)
28 (Good)
43 (Moderate)
31 (Good)
34 (Good)
38 (Good)
o3
143 (Unhealthy for Sensitive Groups)
135 (Unhealthy for Sensitive Groups)
100 (Moderate)
83 (Moderate)
54 (Good)
64 (Good)
98 (Moderate)
121 (Unhealthy for Sensitive Groups)
171 (Unhealthy)
167 (Unhealthy)
139 (Unhealthy for Sensitive Groups)
170 (Unhealthy)
150 (Unhealthy)
133 (Unhealthy for Sensitive Groups)
112 (Moderate)
55 (Good)
57 (Good)
51 (Good)
88 (Moderate)
104 (Moderate)
pm10
64 (Unhealthy for Sensitive Groups)
68 (Unhealthy for Sensitive Groups)
56 (Unhealthy for Sensitive Groups)
48 (Moderate)
68 (Unhealthy for Sensitive Groups)
95 (Unhealthy)
87 (Unhealthy)
65 (Unhealthy for Sensitive Groups)
65 (Unhealthy for Sensitive Groups)
45 (Moderate)
39 (Moderate)
46 (Moderate)
75 (Unhealthy for Sensitive Groups)
63 (Unhealthy for Sensitive Groups)
72 (Unhealthy for Sensitive Groups)
78 (Unhealthy for Sensitive Groups)
120 (Very Unhealthy)
72 (Unhealthy for Sensitive Groups)
68 (Unhealthy for Sensitive Groups)
71 (Unhealthy for Sensitive Groups)
so2
16 (Good)
15 (Good)
14 (Good)
10 (Good)
7.5 (Good)
14 (Good)
16 (Good)
19 (Good)
13 (Good)
10 (Good)
7.5 (Good)
9.3 (Good)
9.5 (Good)
9.3 (Good)
11 (Good)
7.1 (Good)
9.7 (Good)
6.3 (Good)
8.5 (Good)
12 (Good)
data source »
赵家坝
Friday, May 27, 2022, 12:00 PM
PM10 179 (Very bad Hazardous)
particulate matter (PM10) suspended dust
PM2,5 35 (Unhealthy for Sensitive Groups)
particulate matter (PM2.5) dust
O3 0.04 (Good)
ozone (O3)
NO2 0 (Good)
nitrogen dioxide (NO2)
SO2 0 (Good)
sulfur dioxide (SO2)
赵家坝
index
2022-05-27
pm10
56
pm25
56
o3
0.03
no2
0
so2
0
赵家坝
2018-10 2020-05
index
2020-05
2020-04
2020-03
2020-02
2020-01
2019-12
2019-11
2019-10
2019-09
2019-08
2019-07
2019-06
2019-05
2019-04
2019-03
2019-02
2019-01
2018-12
2018-11
2018-10
pm25
34
38
31
38
53
59
45
34
32
21
19
24
35
34
40
56
77
47
45
41
co
1
827
1
1
1
1
996
992
777
939
811
887
867
878
776
1
1
993
1
973
no2
26
29
17
16
29
53
47
36
24
17
19
22
28
28
34
28
43
31
34
38
o3
143
135
100
83
54
64
98
121
171
167
139
170
150
133
112
55
57
51
88
104
pm10
64
68
56
48
68
95
87
65
65
45
39
46
75
63
72
78
120
72
68
71
so2
16
15
14
10
7.5
14
16
19
13
10
7.5
9.3
9.5
9.3
11
7.1
9.7
6.3
8.5
12
* Pollution data source:
https://openaq.org
(ChinaAQIData)
The data is licensed under CC-By 4.0
PM10 179 (Very bad Hazardous)
PM2,5 35 (Unhealthy for Sensitive Groups)
O3 0 (Good)
NO2 0 (Good)
SO2 0 (Good)
Data on air pollution from recent days in Zhaojia Xinwu
| index | 2022-05-27 |
|---|---|
| pm10 | 56 Unhealthy for Sensitive Groups |
| pm25 | 56 Unhealthy |
| o3 | 0 Good |
| no2 | 0 Good |
| so2 | 0 Good |

| index | 2020-05 | 2020-04 | 2020-03 | 2020-02 | 2020-01 | 2019-12 | 2019-11 | 2019-10 | 2019-09 | 2019-08 | 2019-07 | 2019-06 | 2019-05 | 2019-04 | 2019-03 | 2019-02 | 2019-01 | 2018-12 | 2018-11 | 2018-10 |
|---|---|---|---|---|---|---|---|---|---|---|---|---|---|---|---|---|---|---|---|---|
| pm25 | 34 (Moderate) | 38 (Unhealthy for Sensitive Groups) | 31 (Moderate) | 38 (Unhealthy for Sensitive Groups) | 53 (Unhealthy for Sensitive Groups) | 59 (Unhealthy) | 45 (Unhealthy for Sensitive Groups) | 34 (Moderate) | 32 (Moderate) | 21 (Moderate) | 19 (Moderate) | 24 (Moderate) | 35 (Moderate) | 34 (Moderate) | 40 (Unhealthy for Sensitive Groups) | 56 (Unhealthy) | 77 (Very Unhealthy) | 47 (Unhealthy for Sensitive Groups) | 45 (Unhealthy for Sensitive Groups) | 41 (Unhealthy for Sensitive Groups) |
| co | 1 (Good) | 827 (Good) | 1 (Good) | 1 (Good) | 1 (Good) | 1 (Good) | 996 (Good) | 992 (Good) | 777 (Good) | 939 (Good) | 811 (Good) | 887 (Good) | 867 (Good) | 878 (Good) | 776 (Good) | 1 (Good) | 1 (Good) | 993 (Good) | 1 (Good) | 973 (Good) |
| no2 | 26 (Good) | 29 (Good) | 17 (Good) | 16 (Good) | 29 (Good) | 53 (Moderate) | 47 (Moderate) | 36 (Good) | 24 (Good) | 17 (Good) | 19 (Good) | 22 (Good) | 28 (Good) | 28 (Good) | 34 (Good) | 28 (Good) | 43 (Moderate) | 31 (Good) | 34 (Good) | 38 (Good) |
| o3 | 143 (Unhealthy for Sensitive Groups) | 135 (Unhealthy for Sensitive Groups) | 100 (Moderate) | 83 (Moderate) | 54 (Good) | 64 (Good) | 98 (Moderate) | 121 (Unhealthy for Sensitive Groups) | 171 (Unhealthy) | 167 (Unhealthy) | 139 (Unhealthy for Sensitive Groups) | 170 (Unhealthy) | 150 (Unhealthy) | 133 (Unhealthy for Sensitive Groups) | 112 (Moderate) | 55 (Good) | 57 (Good) | 51 (Good) | 88 (Moderate) | 104 (Moderate) |
| pm10 | 64 (Unhealthy for Sensitive Groups) | 68 (Unhealthy for Sensitive Groups) | 56 (Unhealthy for Sensitive Groups) | 48 (Moderate) | 68 (Unhealthy for Sensitive Groups) | 95 (Unhealthy) | 87 (Unhealthy) | 65 (Unhealthy for Sensitive Groups) | 65 (Unhealthy for Sensitive Groups) | 45 (Moderate) | 39 (Moderate) | 46 (Moderate) | 75 (Unhealthy for Sensitive Groups) | 63 (Unhealthy for Sensitive Groups) | 72 (Unhealthy for Sensitive Groups) | 78 (Unhealthy for Sensitive Groups) | 120 (Very Unhealthy) | 72 (Unhealthy for Sensitive Groups) | 68 (Unhealthy for Sensitive Groups) | 71 (Unhealthy for Sensitive Groups) |
| so2 | 16 (Good) | 15 (Good) | 14 (Good) | 10 (Good) | 7.5 (Good) | 14 (Good) | 16 (Good) | 19 (Good) | 13 (Good) | 10 (Good) | 7.5 (Good) | 9.3 (Good) | 9.5 (Good) | 9.3 (Good) | 11 (Good) | 7.1 (Good) | 9.7 (Good) | 6.3 (Good) | 8.5 (Good) | 12 (Good) |
PM10 179 (Very bad Hazardous)
particulate matter (PM10) suspended dustPM2,5 35 (Unhealthy for Sensitive Groups)
particulate matter (PM2.5) dustO3 0.04 (Good)
ozone (O3)NO2 0 (Good)
nitrogen dioxide (NO2)SO2 0 (Good)
sulfur dioxide (SO2)赵家坝
| index | 2022-05-27 |
|---|---|
| pm10 | 56 |
| pm25 | 56 |
| o3 | 0.03 |
| no2 | 0 |
| so2 | 0 |
赵家坝

| index | 2020-05 | 2020-04 | 2020-03 | 2020-02 | 2020-01 | 2019-12 | 2019-11 | 2019-10 | 2019-09 | 2019-08 | 2019-07 | 2019-06 | 2019-05 | 2019-04 | 2019-03 | 2019-02 | 2019-01 | 2018-12 | 2018-11 | 2018-10 |
|---|---|---|---|---|---|---|---|---|---|---|---|---|---|---|---|---|---|---|---|---|
| pm25 | 34 | 38 | 31 | 38 | 53 | 59 | 45 | 34 | 32 | 21 | 19 | 24 | 35 | 34 | 40 | 56 | 77 | 47 | 45 | 41 |
| co | 1 | 827 | 1 | 1 | 1 | 1 | 996 | 992 | 777 | 939 | 811 | 887 | 867 | 878 | 776 | 1 | 1 | 993 | 1 | 973 |
| no2 | 26 | 29 | 17 | 16 | 29 | 53 | 47 | 36 | 24 | 17 | 19 | 22 | 28 | 28 | 34 | 28 | 43 | 31 | 34 | 38 |
| o3 | 143 | 135 | 100 | 83 | 54 | 64 | 98 | 121 | 171 | 167 | 139 | 170 | 150 | 133 | 112 | 55 | 57 | 51 | 88 | 104 |
| pm10 | 64 | 68 | 56 | 48 | 68 | 95 | 87 | 65 | 65 | 45 | 39 | 46 | 75 | 63 | 72 | 78 | 120 | 72 | 68 | 71 |
| so2 | 16 | 15 | 14 | 10 | 7.5 | 14 | 16 | 19 | 13 | 10 | 7.5 | 9.3 | 9.5 | 9.3 | 11 | 7.1 | 9.7 | 6.3 | 8.5 | 12 |