Air Pollution in Huangnidun: Real-time Air Quality Index and smog alert.
Pollution and air quality forecast for Huangnidun. Today is Tuesday, June 2, 2026. The following air pollution values have been recorded for Huangnidun:- particulate matter (PM10) suspended dust - 179 (Very bad Hazardous)
- particulate matter (PM2.5) dust - 35 (Unhealthy for Sensitive Groups)
- ozone (O3) - 0 (Good)
- nitrogen dioxide (NO2) - 0 (Good)
- sulfur dioxide (SO2) - 0 (Good)

What is the air quality in Huangnidun today? Is the air polluted in Huangnidun?. Is there smog?
What is the level of PM10 today in Huangnidun? (particulate matter (PM10) suspended dust)
The current level of particulate matter PM10 in Huangnidun is:
179 (Very bad Hazardous)
The highest PM10 values usually occur in month: 136 (January 2019).
The lowest value of particulate matter PM10 pollution in Huangnidun is usually recorded in: July (60).
What is the current level of PM2.5 in Huangnidun? (particulate matter (PM2.5) dust)
Today's PM2.5 level is:
35 (Unhealthy for Sensitive Groups)
For comparison, the highest level of PM2.5 in Huangnidun in the last 7 days was: 56 (Friday, May 27, 2022) and the lowest: 56 (Friday, May 27, 2022).
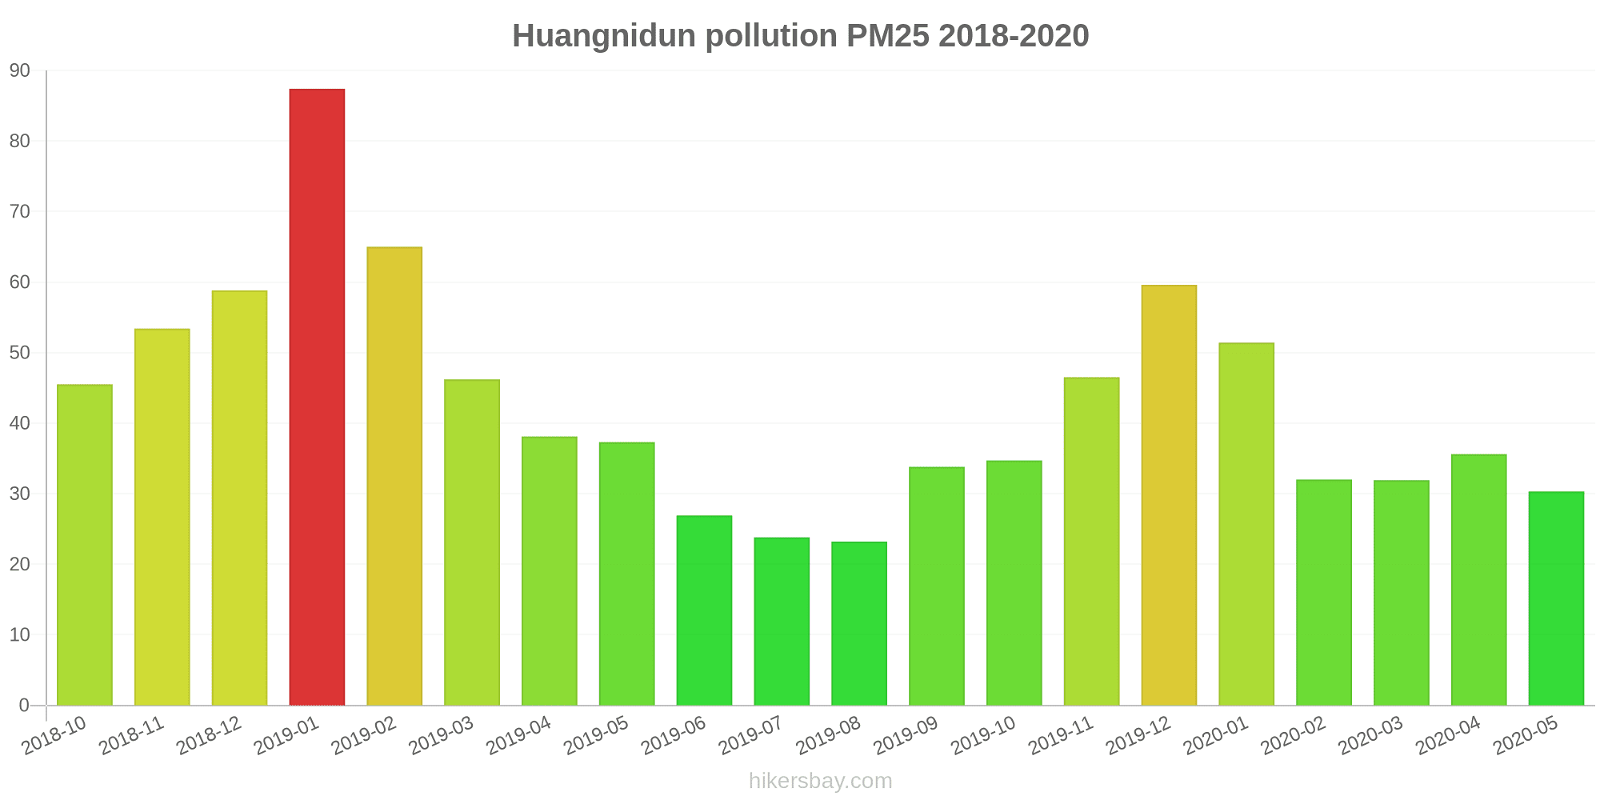
The highest PM2.5 values were recorded: 87 (January 2019).
The lowest level of particulate matter PM2.5 pollution occurs in month: August (23).
How is the O3 level today in Huangnidun? (ozone (O3))
0 (Good)
How high is the level of NO2? (nitrogen dioxide (NO2))
0 (Good)
What is the level of SO2 pollution? (sulfur dioxide (SO2))
0 (Good)
Current data Friday, May 27, 2022, 12:00 PM
PM10 179 (Very bad Hazardous)
PM2,5 35 (Unhealthy for Sensitive Groups)
O3 0 (Good)
NO2 0 (Good)
SO2 0 (Good)
Data on air pollution from recent days in Huangnidun
index
2022-05-27
pm10
56
Unhealthy for Sensitive Groups
pm25
56
Unhealthy
o3
0
Good
no2
0
Good
so2
0
Good
data source »
Air pollution in Huangnidun from October 2018 to May 2020
index
2020-05
2020-04
2020-03
2020-02
2020-01
2019-12
2019-11
2019-10
2019-09
2019-08
2019-07
2019-06
2019-05
2019-04
2019-03
2019-02
2019-01
2018-12
2018-11
2018-10
pm25
30 (Moderate)
36 (Unhealthy for Sensitive Groups)
32 (Moderate)
32 (Moderate)
51 (Unhealthy for Sensitive Groups)
60 (Unhealthy)
47 (Unhealthy for Sensitive Groups)
35 (Moderate)
34 (Moderate)
23 (Moderate)
24 (Moderate)
27 (Moderate)
37 (Unhealthy for Sensitive Groups)
38 (Unhealthy for Sensitive Groups)
46 (Unhealthy for Sensitive Groups)
65 (Unhealthy)
87 (Very Unhealthy)
59 (Unhealthy)
53 (Unhealthy for Sensitive Groups)
46 (Unhealthy for Sensitive Groups)
co
1 (Good)
1 (Good)
1 (Good)
1 (Good)
1 (Good)
1 (Good)
1 (Good)
1 (Good)
1 (Good)
929 (Good)
824 (Good)
1 (Good)
861 (Good)
1 (Good)
933 (Good)
996 (Good)
1 (Good)
949 (Good)
1 (Good)
933 (Good)
no2
29 (Good)
38 (Good)
27 (Good)
24 (Good)
31 (Good)
53 (Moderate)
50 (Moderate)
34 (Good)
32 (Good)
21 (Good)
24 (Good)
33 (Good)
35 (Good)
35 (Good)
39 (Good)
21 (Good)
34 (Good)
31 (Good)
38 (Good)
39 (Good)
o3
137 (Unhealthy for Sensitive Groups)
137 (Unhealthy for Sensitive Groups)
98 (Moderate)
83 (Moderate)
54 (Good)
68 (Good)
99 (Moderate)
124 (Unhealthy for Sensitive Groups)
173 (Unhealthy)
174 (Unhealthy)
143 (Unhealthy for Sensitive Groups)
158 (Unhealthy)
121 (Unhealthy for Sensitive Groups)
118 (Moderate)
105 (Moderate)
54 (Good)
62 (Good)
50 (Good)
86 (Moderate)
116 (Moderate)
pm10
64 (Unhealthy for Sensitive Groups)
73 (Unhealthy for Sensitive Groups)
67 (Unhealthy for Sensitive Groups)
64 (Unhealthy for Sensitive Groups)
90 (Unhealthy)
113 (Very Unhealthy)
105 (Unhealthy)
74 (Unhealthy for Sensitive Groups)
87 (Unhealthy)
62 (Unhealthy for Sensitive Groups)
60 (Unhealthy for Sensitive Groups)
68 (Unhealthy for Sensitive Groups)
105 (Unhealthy)
85 (Unhealthy)
95 (Unhealthy)
98 (Unhealthy)
136 (Very Unhealthy)
102 (Unhealthy)
94 (Unhealthy)
93 (Unhealthy)
so2
15 (Good)
15 (Good)
13 (Good)
11 (Good)
10 (Good)
17 (Good)
16 (Good)
12 (Good)
12 (Good)
12 (Good)
7.7 (Good)
16 (Good)
13 (Good)
16 (Good)
15 (Good)
9.6 (Good)
8.8 (Good)
9.3 (Good)
14 (Good)
11 (Good)
data source »
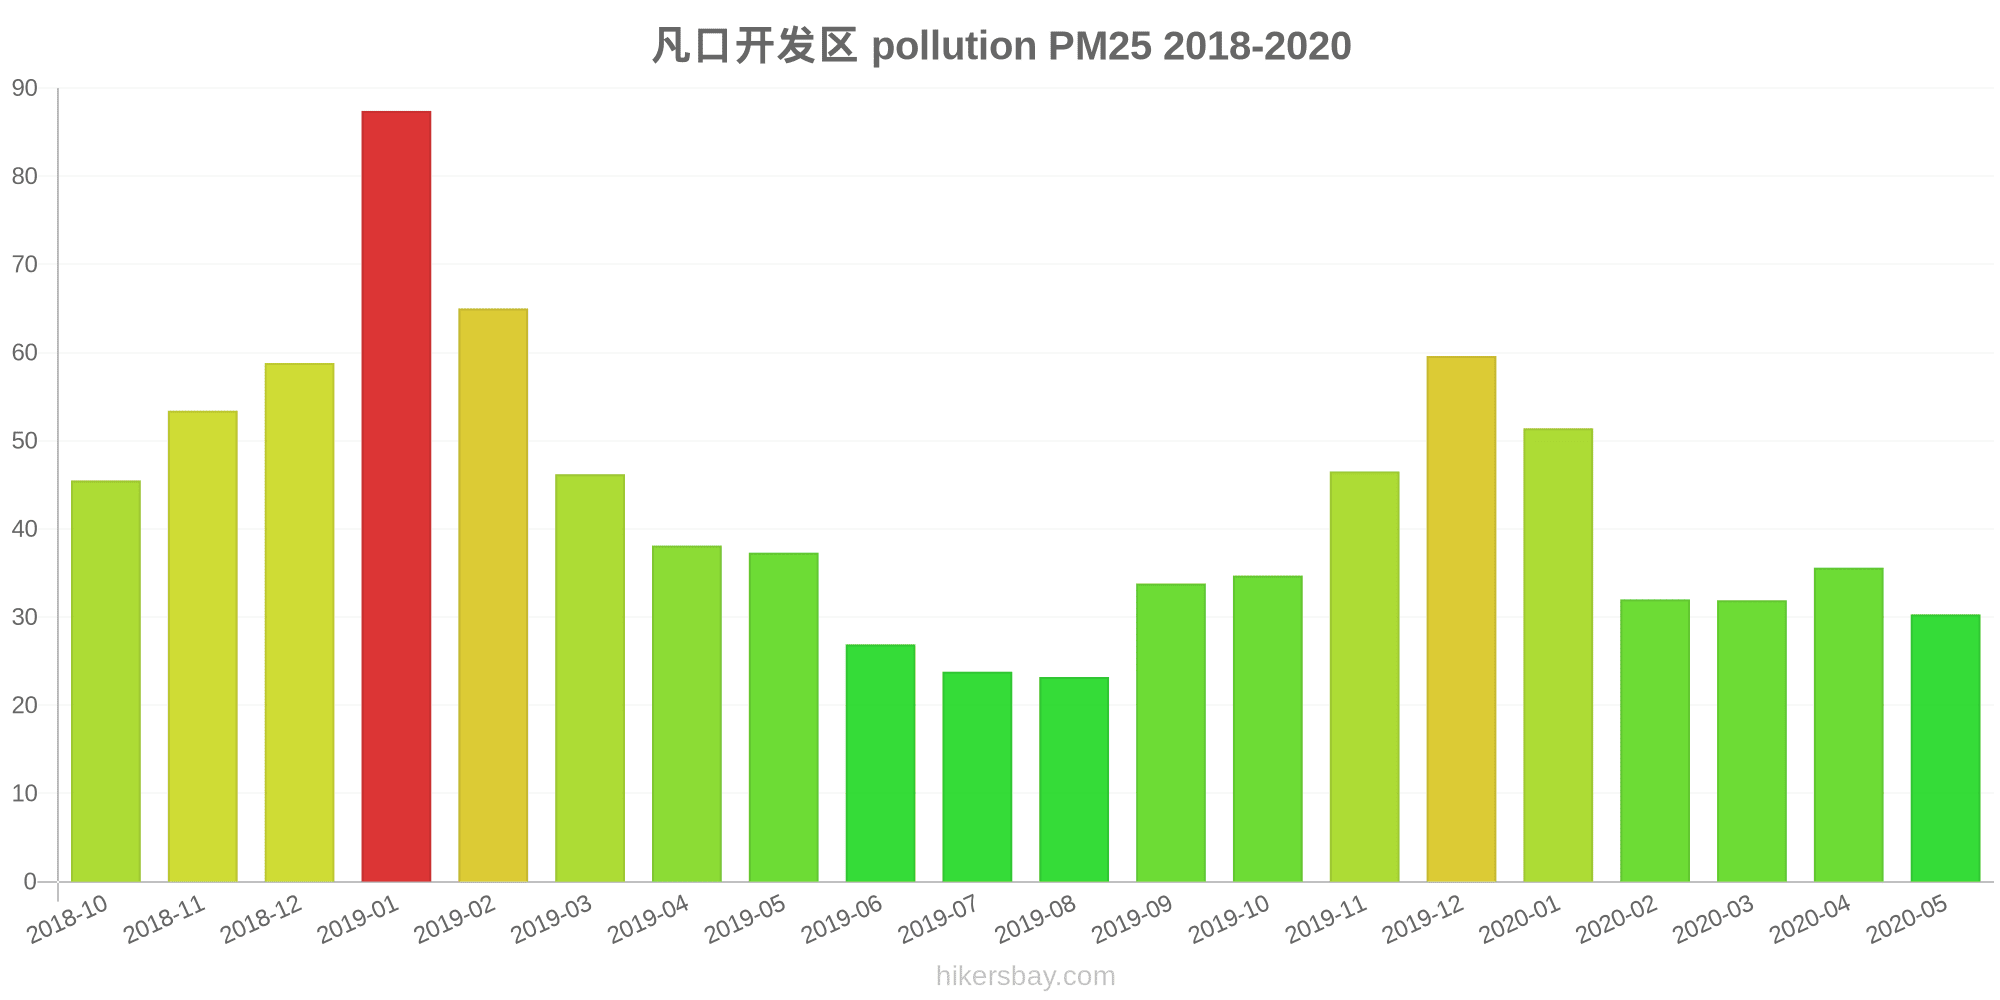
凡口开发区
Friday, May 27, 2022, 12:00 PM
PM10 179 (Very bad Hazardous)
particulate matter (PM10) suspended dust
PM2,5 35 (Unhealthy for Sensitive Groups)
particulate matter (PM2.5) dust
O3 0.04 (Good)
ozone (O3)
NO2 0 (Good)
nitrogen dioxide (NO2)
SO2 0 (Good)
sulfur dioxide (SO2)
凡口开发区
index
2022-05-27
pm10
56
pm25
56
o3
0.03
no2
0
so2
0
凡口开发区
2018-10 2020-05

index
2020-05
2020-04
2020-03
2020-02
2020-01
2019-12
2019-11
2019-10
2019-09
2019-08
2019-07
2019-06
2019-05
2019-04
2019-03
2019-02
2019-01
2018-12
2018-11
2018-10
pm25
30
36
32
32
51
60
47
35
34
23
24
27
37
38
46
65
87
59
53
46
co
1
1
1
1
1
1
1
1
1
929
824
1
861
1
933
996
1
949
1
933
no2
29
38
27
24
31
53
50
34
32
21
24
33
35
35
39
21
34
31
38
39
o3
137
137
98
83
54
68
99
124
173
174
143
158
121
118
105
54
62
50
86
116
pm10
64
73
67
64
90
113
105
74
87
62
60
68
105
85
95
98
136
102
94
93
so2
15
15
13
11
10
17
16
12
12
12
7.7
16
13
16
15
9.6
8.8
9.3
14
11
* Pollution data source:
https://openaq.org
(ChinaAQIData)
The data is licensed under CC-By 4.0
PM10 179 (Very bad Hazardous)
PM2,5 35 (Unhealthy for Sensitive Groups)
O3 0 (Good)
NO2 0 (Good)
SO2 0 (Good)
Data on air pollution from recent days in Huangnidun
| index | 2022-05-27 |
|---|---|
| pm10 | 56 Unhealthy for Sensitive Groups |
| pm25 | 56 Unhealthy |
| o3 | 0 Good |
| no2 | 0 Good |
| so2 | 0 Good |

| index | 2020-05 | 2020-04 | 2020-03 | 2020-02 | 2020-01 | 2019-12 | 2019-11 | 2019-10 | 2019-09 | 2019-08 | 2019-07 | 2019-06 | 2019-05 | 2019-04 | 2019-03 | 2019-02 | 2019-01 | 2018-12 | 2018-11 | 2018-10 |
|---|---|---|---|---|---|---|---|---|---|---|---|---|---|---|---|---|---|---|---|---|
| pm25 | 30 (Moderate) | 36 (Unhealthy for Sensitive Groups) | 32 (Moderate) | 32 (Moderate) | 51 (Unhealthy for Sensitive Groups) | 60 (Unhealthy) | 47 (Unhealthy for Sensitive Groups) | 35 (Moderate) | 34 (Moderate) | 23 (Moderate) | 24 (Moderate) | 27 (Moderate) | 37 (Unhealthy for Sensitive Groups) | 38 (Unhealthy for Sensitive Groups) | 46 (Unhealthy for Sensitive Groups) | 65 (Unhealthy) | 87 (Very Unhealthy) | 59 (Unhealthy) | 53 (Unhealthy for Sensitive Groups) | 46 (Unhealthy for Sensitive Groups) |
| co | 1 (Good) | 1 (Good) | 1 (Good) | 1 (Good) | 1 (Good) | 1 (Good) | 1 (Good) | 1 (Good) | 1 (Good) | 929 (Good) | 824 (Good) | 1 (Good) | 861 (Good) | 1 (Good) | 933 (Good) | 996 (Good) | 1 (Good) | 949 (Good) | 1 (Good) | 933 (Good) |
| no2 | 29 (Good) | 38 (Good) | 27 (Good) | 24 (Good) | 31 (Good) | 53 (Moderate) | 50 (Moderate) | 34 (Good) | 32 (Good) | 21 (Good) | 24 (Good) | 33 (Good) | 35 (Good) | 35 (Good) | 39 (Good) | 21 (Good) | 34 (Good) | 31 (Good) | 38 (Good) | 39 (Good) |
| o3 | 137 (Unhealthy for Sensitive Groups) | 137 (Unhealthy for Sensitive Groups) | 98 (Moderate) | 83 (Moderate) | 54 (Good) | 68 (Good) | 99 (Moderate) | 124 (Unhealthy for Sensitive Groups) | 173 (Unhealthy) | 174 (Unhealthy) | 143 (Unhealthy for Sensitive Groups) | 158 (Unhealthy) | 121 (Unhealthy for Sensitive Groups) | 118 (Moderate) | 105 (Moderate) | 54 (Good) | 62 (Good) | 50 (Good) | 86 (Moderate) | 116 (Moderate) |
| pm10 | 64 (Unhealthy for Sensitive Groups) | 73 (Unhealthy for Sensitive Groups) | 67 (Unhealthy for Sensitive Groups) | 64 (Unhealthy for Sensitive Groups) | 90 (Unhealthy) | 113 (Very Unhealthy) | 105 (Unhealthy) | 74 (Unhealthy for Sensitive Groups) | 87 (Unhealthy) | 62 (Unhealthy for Sensitive Groups) | 60 (Unhealthy for Sensitive Groups) | 68 (Unhealthy for Sensitive Groups) | 105 (Unhealthy) | 85 (Unhealthy) | 95 (Unhealthy) | 98 (Unhealthy) | 136 (Very Unhealthy) | 102 (Unhealthy) | 94 (Unhealthy) | 93 (Unhealthy) |
| so2 | 15 (Good) | 15 (Good) | 13 (Good) | 11 (Good) | 10 (Good) | 17 (Good) | 16 (Good) | 12 (Good) | 12 (Good) | 12 (Good) | 7.7 (Good) | 16 (Good) | 13 (Good) | 16 (Good) | 15 (Good) | 9.6 (Good) | 8.8 (Good) | 9.3 (Good) | 14 (Good) | 11 (Good) |
PM10 179 (Very bad Hazardous)
particulate matter (PM10) suspended dustPM2,5 35 (Unhealthy for Sensitive Groups)
particulate matter (PM2.5) dustO3 0.04 (Good)
ozone (O3)NO2 0 (Good)
nitrogen dioxide (NO2)SO2 0 (Good)
sulfur dioxide (SO2)凡口开发区
| index | 2022-05-27 |
|---|---|
| pm10 | 56 |
| pm25 | 56 |
| o3 | 0.03 |
| no2 | 0 |
| so2 | 0 |
凡口开发区
| index | 2020-05 | 2020-04 | 2020-03 | 2020-02 | 2020-01 | 2019-12 | 2019-11 | 2019-10 | 2019-09 | 2019-08 | 2019-07 | 2019-06 | 2019-05 | 2019-04 | 2019-03 | 2019-02 | 2019-01 | 2018-12 | 2018-11 | 2018-10 |
|---|---|---|---|---|---|---|---|---|---|---|---|---|---|---|---|---|---|---|---|---|
| pm25 | 30 | 36 | 32 | 32 | 51 | 60 | 47 | 35 | 34 | 23 | 24 | 27 | 37 | 38 | 46 | 65 | 87 | 59 | 53 | 46 |
| co | 1 | 1 | 1 | 1 | 1 | 1 | 1 | 1 | 1 | 929 | 824 | 1 | 861 | 1 | 933 | 996 | 1 | 949 | 1 | 933 |
| no2 | 29 | 38 | 27 | 24 | 31 | 53 | 50 | 34 | 32 | 21 | 24 | 33 | 35 | 35 | 39 | 21 | 34 | 31 | 38 | 39 |
| o3 | 137 | 137 | 98 | 83 | 54 | 68 | 99 | 124 | 173 | 174 | 143 | 158 | 121 | 118 | 105 | 54 | 62 | 50 | 86 | 116 |
| pm10 | 64 | 73 | 67 | 64 | 90 | 113 | 105 | 74 | 87 | 62 | 60 | 68 | 105 | 85 | 95 | 98 | 136 | 102 | 94 | 93 |
| so2 | 15 | 15 | 13 | 11 | 10 | 17 | 16 | 12 | 12 | 12 | 7.7 | 16 | 13 | 16 | 15 | 9.6 | 8.8 | 9.3 | 14 | 11 |