Air Pollution in Machidun: Real-time Air Quality Index and smog alert.
Pollution and air quality forecast for Machidun. Today is Tuesday, June 2, 2026. The following air pollution values have been recorded for Machidun:- particulate matter (PM10) suspended dust - 179 (Very bad Hazardous)
- particulate matter (PM2.5) dust - 35 (Unhealthy for Sensitive Groups)
- ozone (O3) - 0 (Good)
- nitrogen dioxide (NO2) - 0 (Good)
- sulfur dioxide (SO2) - 0 (Good)

What is the air quality in Machidun today? Is the air polluted in Machidun?. Is there smog?
What is the level of PM10 today in Machidun? (particulate matter (PM10) suspended dust)
The current level of particulate matter PM10 in Machidun is:
179 (Very bad Hazardous)
The highest PM10 values usually occur in month: 117 (January 2019).
The lowest value of particulate matter PM10 pollution in Machidun is usually recorded in: February (45).
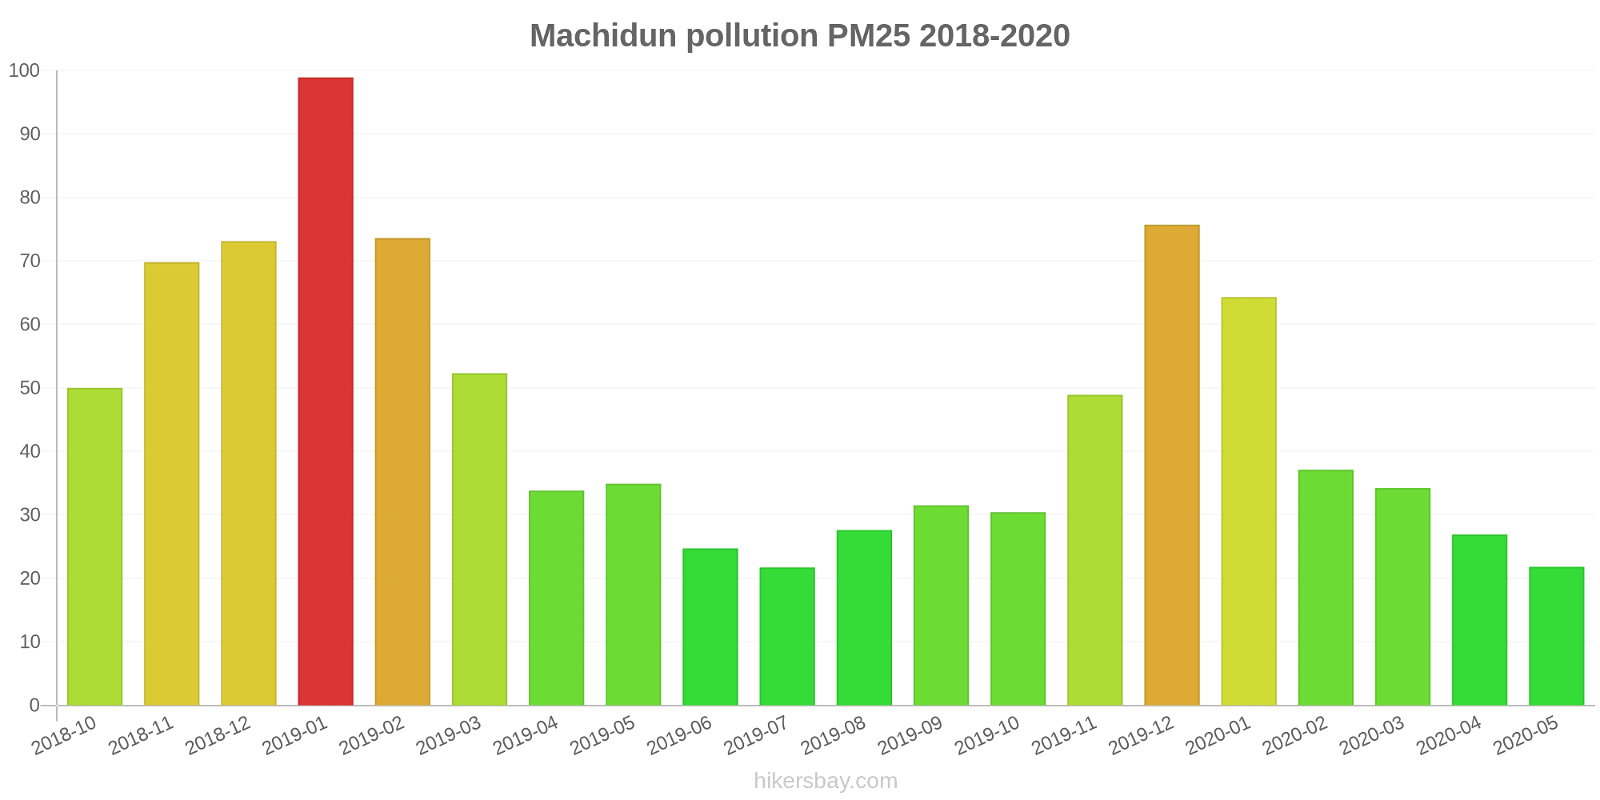
What is the current level of PM2.5 in Machidun? (particulate matter (PM2.5) dust)
Today's PM2.5 level is:
35 (Unhealthy for Sensitive Groups)
For comparison, the highest level of PM2.5 in Machidun in the last 7 days was: 56 (Friday, May 27, 2022) and the lowest: 56 (Friday, May 27, 2022).
The highest PM2.5 values were recorded: 99 (January 2019).
The lowest level of particulate matter PM2.5 pollution occurs in month: July (22).
How is the O3 level today in Machidun? (ozone (O3))
0 (Good)
How high is the level of NO2? (nitrogen dioxide (NO2))
0 (Good)
What is the level of SO2 pollution? (sulfur dioxide (SO2))
0 (Good)
Current data Friday, May 27, 2022, 12:00 PM
PM10 179 (Very bad Hazardous)
PM2,5 35 (Unhealthy for Sensitive Groups)
O3 0 (Good)
NO2 0 (Good)
SO2 0 (Good)
Data on air pollution from recent days in Machidun
index
2022-05-27
pm10
56
Unhealthy for Sensitive Groups
pm25
56
Unhealthy
o3
0
Good
no2
0
Good
so2
0
Good
data source »
Air pollution in Machidun from October 2018 to May 2020
index
2020-05
2020-04
2020-03
2020-02
2020-01
2019-12
2019-11
2019-10
2019-09
2019-08
2019-07
2019-06
2019-05
2019-04
2019-03
2019-02
2019-01
2018-12
2018-11
2018-10
pm25
22 (Moderate)
27 (Moderate)
34 (Moderate)
37 (Unhealthy for Sensitive Groups)
64 (Unhealthy)
76 (Very Unhealthy)
49 (Unhealthy for Sensitive Groups)
30 (Moderate)
32 (Moderate)
28 (Moderate)
22 (Moderate)
25 (Moderate)
35 (Moderate)
34 (Moderate)
52 (Unhealthy for Sensitive Groups)
74 (Unhealthy)
99 (Very Unhealthy)
73 (Unhealthy)
70 (Unhealthy)
50 (Unhealthy for Sensitive Groups)
co
753 (Good)
686 (Good)
910 (Good)
811 (Good)
939 (Good)
1 (Good)
1 (Good)
962 (Good)
959 (Good)
912 (Good)
809 (Good)
829 (Good)
856 (Good)
1 (Good)
1 (Good)
857 (Good)
1 (Good)
1 (Good)
1 (Good)
1 (Good)
no2
22 (Good)
32 (Good)
20 (Good)
18 (Good)
36 (Good)
64 (Moderate)
57 (Moderate)
41 (Moderate)
44 (Moderate)
33 (Good)
37 (Good)
33 (Good)
47 (Moderate)
44 (Moderate)
56 (Moderate)
36 (Good)
60 (Moderate)
48 (Moderate)
59 (Moderate)
64 (Moderate)
o3
134 (Unhealthy for Sensitive Groups)
138 (Unhealthy for Sensitive Groups)
106 (Moderate)
89 (Moderate)
61 (Good)
64 (Good)
94 (Moderate)
126 (Unhealthy for Sensitive Groups)
191 (Very Unhealthy)
178 (Unhealthy)
152 (Unhealthy)
183 (Very Unhealthy)
144 (Unhealthy for Sensitive Groups)
135 (Unhealthy for Sensitive Groups)
107 (Moderate)
65 (Good)
52 (Good)
47 (Good)
86 (Moderate)
116 (Moderate)
pm10
55 (Unhealthy for Sensitive Groups)
60 (Unhealthy for Sensitive Groups)
53 (Unhealthy for Sensitive Groups)
45 (Moderate)
68 (Unhealthy for Sensitive Groups)
100 (Unhealthy)
92 (Unhealthy)
58 (Unhealthy for Sensitive Groups)
69 (Unhealthy for Sensitive Groups)
65 (Unhealthy for Sensitive Groups)
54 (Unhealthy for Sensitive Groups)
58 (Unhealthy for Sensitive Groups)
96 (Unhealthy)
76 (Unhealthy for Sensitive Groups)
99 (Unhealthy)
90 (Unhealthy)
117 (Very Unhealthy)
94 (Unhealthy)
95 (Unhealthy)
90 (Unhealthy)
so2
8.1 (Good)
7.9 (Good)
6.8 (Good)
5.8 (Good)
5.9 (Good)
11 (Good)
10 (Good)
7.4 (Good)
11 (Good)
7.8 (Good)
6.8 (Good)
7.5 (Good)
9.1 (Good)
9.1 (Good)
9.9 (Good)
7 (Good)
9.1 (Good)
7.2 (Good)
9.2 (Good)
11 (Good)
data source »
吴家山
Friday, May 27, 2022, 12:00 PM
PM10 179 (Very bad Hazardous)
particulate matter (PM10) suspended dust
PM2,5 35 (Unhealthy for Sensitive Groups)
particulate matter (PM2.5) dust
O3 0.04 (Good)
ozone (O3)
NO2 0 (Good)
nitrogen dioxide (NO2)
SO2 0 (Good)
sulfur dioxide (SO2)
吴家山
index
2022-05-27
pm10
56
pm25
56
o3
0.03
no2
0
so2
0
吴家山
2018-10 2020-05

index
2020-05
2020-04
2020-03
2020-02
2020-01
2019-12
2019-11
2019-10
2019-09
2019-08
2019-07
2019-06
2019-05
2019-04
2019-03
2019-02
2019-01
2018-12
2018-11
2018-10
pm25
22
27
34
37
64
76
49
30
32
28
22
25
35
34
52
74
99
73
70
50
co
753
686
910
811
939
1
1
962
959
912
809
829
856
1
1
857
1
1
1
1
no2
22
32
20
18
36
64
57
41
44
33
37
33
47
44
56
36
60
48
59
64
o3
134
138
106
89
61
64
94
126
191
178
152
183
144
135
107
65
52
47
86
116
pm10
55
60
53
45
68
100
92
58
69
65
54
58
96
76
99
90
117
94
95
90
so2
8.1
7.9
6.8
5.8
5.9
11
10
7.4
11
7.8
6.8
7.5
9.1
9.1
9.9
7
9.1
7.2
9.2
11
* Pollution data source:
https://openaq.org
(ChinaAQIData)
The data is licensed under CC-By 4.0
PM10 179 (Very bad Hazardous)
PM2,5 35 (Unhealthy for Sensitive Groups)
O3 0 (Good)
NO2 0 (Good)
SO2 0 (Good)
Data on air pollution from recent days in Machidun
| index | 2022-05-27 |
|---|---|
| pm10 | 56 Unhealthy for Sensitive Groups |
| pm25 | 56 Unhealthy |
| o3 | 0 Good |
| no2 | 0 Good |
| so2 | 0 Good |

| index | 2020-05 | 2020-04 | 2020-03 | 2020-02 | 2020-01 | 2019-12 | 2019-11 | 2019-10 | 2019-09 | 2019-08 | 2019-07 | 2019-06 | 2019-05 | 2019-04 | 2019-03 | 2019-02 | 2019-01 | 2018-12 | 2018-11 | 2018-10 |
|---|---|---|---|---|---|---|---|---|---|---|---|---|---|---|---|---|---|---|---|---|
| pm25 | 22 (Moderate) | 27 (Moderate) | 34 (Moderate) | 37 (Unhealthy for Sensitive Groups) | 64 (Unhealthy) | 76 (Very Unhealthy) | 49 (Unhealthy for Sensitive Groups) | 30 (Moderate) | 32 (Moderate) | 28 (Moderate) | 22 (Moderate) | 25 (Moderate) | 35 (Moderate) | 34 (Moderate) | 52 (Unhealthy for Sensitive Groups) | 74 (Unhealthy) | 99 (Very Unhealthy) | 73 (Unhealthy) | 70 (Unhealthy) | 50 (Unhealthy for Sensitive Groups) |
| co | 753 (Good) | 686 (Good) | 910 (Good) | 811 (Good) | 939 (Good) | 1 (Good) | 1 (Good) | 962 (Good) | 959 (Good) | 912 (Good) | 809 (Good) | 829 (Good) | 856 (Good) | 1 (Good) | 1 (Good) | 857 (Good) | 1 (Good) | 1 (Good) | 1 (Good) | 1 (Good) |
| no2 | 22 (Good) | 32 (Good) | 20 (Good) | 18 (Good) | 36 (Good) | 64 (Moderate) | 57 (Moderate) | 41 (Moderate) | 44 (Moderate) | 33 (Good) | 37 (Good) | 33 (Good) | 47 (Moderate) | 44 (Moderate) | 56 (Moderate) | 36 (Good) | 60 (Moderate) | 48 (Moderate) | 59 (Moderate) | 64 (Moderate) |
| o3 | 134 (Unhealthy for Sensitive Groups) | 138 (Unhealthy for Sensitive Groups) | 106 (Moderate) | 89 (Moderate) | 61 (Good) | 64 (Good) | 94 (Moderate) | 126 (Unhealthy for Sensitive Groups) | 191 (Very Unhealthy) | 178 (Unhealthy) | 152 (Unhealthy) | 183 (Very Unhealthy) | 144 (Unhealthy for Sensitive Groups) | 135 (Unhealthy for Sensitive Groups) | 107 (Moderate) | 65 (Good) | 52 (Good) | 47 (Good) | 86 (Moderate) | 116 (Moderate) |
| pm10 | 55 (Unhealthy for Sensitive Groups) | 60 (Unhealthy for Sensitive Groups) | 53 (Unhealthy for Sensitive Groups) | 45 (Moderate) | 68 (Unhealthy for Sensitive Groups) | 100 (Unhealthy) | 92 (Unhealthy) | 58 (Unhealthy for Sensitive Groups) | 69 (Unhealthy for Sensitive Groups) | 65 (Unhealthy for Sensitive Groups) | 54 (Unhealthy for Sensitive Groups) | 58 (Unhealthy for Sensitive Groups) | 96 (Unhealthy) | 76 (Unhealthy for Sensitive Groups) | 99 (Unhealthy) | 90 (Unhealthy) | 117 (Very Unhealthy) | 94 (Unhealthy) | 95 (Unhealthy) | 90 (Unhealthy) |
| so2 | 8.1 (Good) | 7.9 (Good) | 6.8 (Good) | 5.8 (Good) | 5.9 (Good) | 11 (Good) | 10 (Good) | 7.4 (Good) | 11 (Good) | 7.8 (Good) | 6.8 (Good) | 7.5 (Good) | 9.1 (Good) | 9.1 (Good) | 9.9 (Good) | 7 (Good) | 9.1 (Good) | 7.2 (Good) | 9.2 (Good) | 11 (Good) |
PM10 179 (Very bad Hazardous)
particulate matter (PM10) suspended dustPM2,5 35 (Unhealthy for Sensitive Groups)
particulate matter (PM2.5) dustO3 0.04 (Good)
ozone (O3)NO2 0 (Good)
nitrogen dioxide (NO2)SO2 0 (Good)
sulfur dioxide (SO2)吴家山
| index | 2022-05-27 |
|---|---|
| pm10 | 56 |
| pm25 | 56 |
| o3 | 0.03 |
| no2 | 0 |
| so2 | 0 |
吴家山

| index | 2020-05 | 2020-04 | 2020-03 | 2020-02 | 2020-01 | 2019-12 | 2019-11 | 2019-10 | 2019-09 | 2019-08 | 2019-07 | 2019-06 | 2019-05 | 2019-04 | 2019-03 | 2019-02 | 2019-01 | 2018-12 | 2018-11 | 2018-10 |
|---|---|---|---|---|---|---|---|---|---|---|---|---|---|---|---|---|---|---|---|---|
| pm25 | 22 | 27 | 34 | 37 | 64 | 76 | 49 | 30 | 32 | 28 | 22 | 25 | 35 | 34 | 52 | 74 | 99 | 73 | 70 | 50 |
| co | 753 | 686 | 910 | 811 | 939 | 1 | 1 | 962 | 959 | 912 | 809 | 829 | 856 | 1 | 1 | 857 | 1 | 1 | 1 | 1 |
| no2 | 22 | 32 | 20 | 18 | 36 | 64 | 57 | 41 | 44 | 33 | 37 | 33 | 47 | 44 | 56 | 36 | 60 | 48 | 59 | 64 |
| o3 | 134 | 138 | 106 | 89 | 61 | 64 | 94 | 126 | 191 | 178 | 152 | 183 | 144 | 135 | 107 | 65 | 52 | 47 | 86 | 116 |
| pm10 | 55 | 60 | 53 | 45 | 68 | 100 | 92 | 58 | 69 | 65 | 54 | 58 | 96 | 76 | 99 | 90 | 117 | 94 | 95 | 90 |
| so2 | 8.1 | 7.9 | 6.8 | 5.8 | 5.9 | 11 | 10 | 7.4 | 11 | 7.8 | 6.8 | 7.5 | 9.1 | 9.1 | 9.9 | 7 | 9.1 | 7.2 | 9.2 | 11 |