Air Pollution in Bafangwan: Real-time Air Quality Index and smog alert.
Pollution and air quality forecast for Bafangwan. Today is Tuesday, June 2, 2026. The following air pollution values have been recorded for Bafangwan:- particulate matter (PM10) suspended dust - 179 (Very bad Hazardous)
- particulate matter (PM2.5) dust - 35 (Unhealthy for Sensitive Groups)
- ozone (O3) - 0 (Good)
- nitrogen dioxide (NO2) - 0 (Good)
- sulfur dioxide (SO2) - 0 (Good)

What is the air quality in Bafangwan today? Is the air polluted in Bafangwan?. Is there smog?
What is the level of PM10 today in Bafangwan? (particulate matter (PM10) suspended dust)
The current level of particulate matter PM10 in Bafangwan is:
179 (Very bad Hazardous)
The highest PM10 values usually occur in month: 119 (January 2019).
The lowest value of particulate matter PM10 pollution in Bafangwan is usually recorded in: February (43).
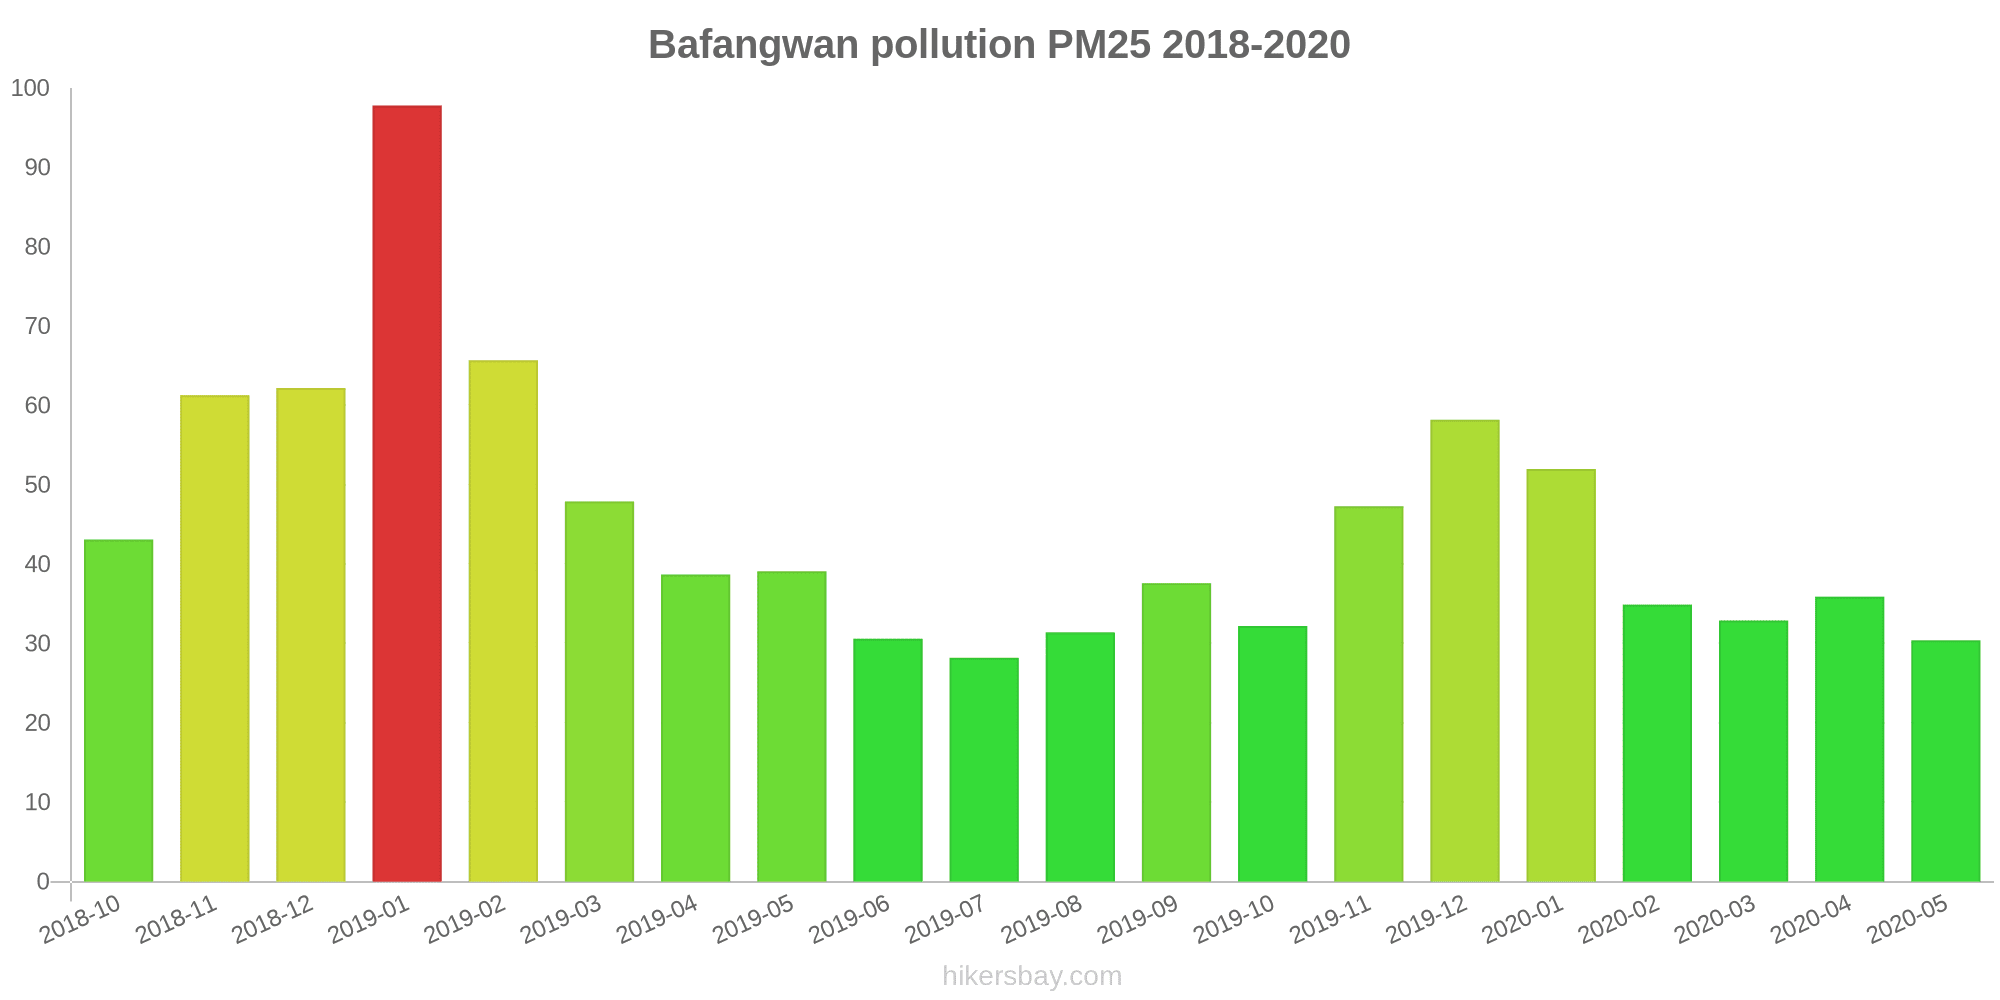
What is the current level of PM2.5 in Bafangwan? (particulate matter (PM2.5) dust)
Today's PM2.5 level is:
35 (Unhealthy for Sensitive Groups)
For comparison, the highest level of PM2.5 in Bafangwan in the last 7 days was: 56 (Friday, May 27, 2022) and the lowest: 56 (Friday, May 27, 2022).
The highest PM2.5 values were recorded: 98 (January 2019).
The lowest level of particulate matter PM2.5 pollution occurs in month: July (28).
How is the O3 level today in Bafangwan? (ozone (O3))
0 (Good)
How high is the level of NO2? (nitrogen dioxide (NO2))
0 (Good)
What is the level of SO2 pollution? (sulfur dioxide (SO2))
0 (Good)
Current data Friday, May 27, 2022, 12:00 PM
PM10 179 (Very bad Hazardous)
PM2,5 35 (Unhealthy for Sensitive Groups)
O3 0 (Good)
NO2 0 (Good)
SO2 0 (Good)
Data on air pollution from recent days in Bafangwan
index
2022-05-27
pm10
56
Unhealthy for Sensitive Groups
pm25
56
Unhealthy
o3
0
Good
no2
0
Good
so2
0
Good
data source »
Air pollution in Bafangwan from October 2018 to May 2020

index
2020-05
2020-04
2020-03
2020-02
2020-01
2019-12
2019-11
2019-10
2019-09
2019-08
2019-07
2019-06
2019-05
2019-04
2019-03
2019-02
2019-01
2018-12
2018-11
2018-10
pm25
30 (Moderate)
36 (Unhealthy for Sensitive Groups)
33 (Moderate)
35 (Moderate)
52 (Unhealthy for Sensitive Groups)
58 (Unhealthy)
47 (Unhealthy for Sensitive Groups)
32 (Moderate)
38 (Unhealthy for Sensitive Groups)
31 (Moderate)
28 (Moderate)
31 (Moderate)
39 (Unhealthy for Sensitive Groups)
39 (Unhealthy for Sensitive Groups)
48 (Unhealthy for Sensitive Groups)
66 (Unhealthy)
98 (Very Unhealthy)
62 (Unhealthy)
61 (Unhealthy)
43 (Unhealthy for Sensitive Groups)
co
556 (Good)
689 (Good)
1 (Good)
687 (Good)
940 (Good)
1 (Good)
1 (Good)
785 (Good)
985 (Good)
941 (Good)
944 (Good)
857 (Good)
868 (Good)
1 (Good)
962 (Good)
1 (Good)
1 (Good)
1 (Good)
1 (Good)
765 (Good)
no2
30 (Good)
44 (Moderate)
24 (Good)
23 (Good)
35 (Good)
67 (Moderate)
59 (Moderate)
45 (Moderate)
46 (Moderate)
30 (Good)
35 (Good)
39 (Good)
53 (Moderate)
47 (Moderate)
48 (Moderate)
30 (Good)
49 (Moderate)
40 (Good)
54 (Moderate)
62 (Moderate)
o3
131 (Unhealthy for Sensitive Groups)
133 (Unhealthy for Sensitive Groups)
103 (Moderate)
86 (Moderate)
56 (Good)
57 (Good)
92 (Moderate)
124 (Unhealthy for Sensitive Groups)
190 (Very Unhealthy)
183 (Very Unhealthy)
150 (Unhealthy)
170 (Unhealthy)
149 (Unhealthy for Sensitive Groups)
137 (Unhealthy for Sensitive Groups)
82 (Moderate)
49 (Good)
40 (Good)
32 (Good)
70 (Good)
97 (Moderate)
pm10
56 (Unhealthy for Sensitive Groups)
64 (Unhealthy for Sensitive Groups)
54 (Unhealthy for Sensitive Groups)
43 (Moderate)
71 (Unhealthy for Sensitive Groups)
104 (Unhealthy)
97 (Unhealthy)
61 (Unhealthy for Sensitive Groups)
71 (Unhealthy for Sensitive Groups)
57 (Unhealthy for Sensitive Groups)
53 (Unhealthy for Sensitive Groups)
54 (Unhealthy for Sensitive Groups)
78 (Unhealthy for Sensitive Groups)
71 (Unhealthy for Sensitive Groups)
89 (Unhealthy)
84 (Unhealthy)
119 (Very Unhealthy)
89 (Unhealthy)
85 (Unhealthy)
84 (Unhealthy)
so2
9.1 (Good)
11 (Good)
9.7 (Good)
8 (Good)
6.4 (Good)
14 (Good)
13 (Good)
7.9 (Good)
13 (Good)
7.8 (Good)
5.5 (Good)
6.7 (Good)
10 (Good)
11 (Good)
10 (Good)
8 (Good)
9.5 (Good)
6.6 (Good)
7.4 (Good)
9.6 (Good)
data source »
沌口新区
Friday, May 27, 2022, 12:00 PM
PM10 179 (Very bad Hazardous)
particulate matter (PM10) suspended dust
PM2,5 35 (Unhealthy for Sensitive Groups)
particulate matter (PM2.5) dust
O3 0.04 (Good)
ozone (O3)
NO2 0 (Good)
nitrogen dioxide (NO2)
SO2 0 (Good)
sulfur dioxide (SO2)
沌口新区
index
2022-05-27
pm10
56
pm25
56
o3
0.03
no2
0
so2
0
沌口新区
2018-10 2020-05

index
2020-05
2020-04
2020-03
2020-02
2020-01
2019-12
2019-11
2019-10
2019-09
2019-08
2019-07
2019-06
2019-05
2019-04
2019-03
2019-02
2019-01
2018-12
2018-11
2018-10
pm25
30
36
33
35
52
58
47
32
38
31
28
31
39
39
48
66
98
62
61
43
co
556
689
1
687
940
1
1
785
985
941
944
857
868
1
962
1
1
1
1
765
no2
30
44
24
23
35
67
59
45
46
30
35
39
53
47
48
30
49
40
54
62
o3
131
133
103
86
56
57
92
124
190
183
150
170
149
137
82
49
40
32
70
97
pm10
56
64
54
43
71
104
97
61
71
57
53
54
78
71
89
84
119
89
85
84
so2
9.1
11
9.7
8
6.4
14
13
7.9
13
7.8
5.5
6.7
10
11
10
8
9.5
6.6
7.4
9.6
* Pollution data source:
https://openaq.org
(ChinaAQIData)
The data is licensed under CC-By 4.0
PM10 179 (Very bad Hazardous)
PM2,5 35 (Unhealthy for Sensitive Groups)
O3 0 (Good)
NO2 0 (Good)
SO2 0 (Good)
Data on air pollution from recent days in Bafangwan
| index | 2022-05-27 |
|---|---|
| pm10 | 56 Unhealthy for Sensitive Groups |
| pm25 | 56 Unhealthy |
| o3 | 0 Good |
| no2 | 0 Good |
| so2 | 0 Good |
| index | 2020-05 | 2020-04 | 2020-03 | 2020-02 | 2020-01 | 2019-12 | 2019-11 | 2019-10 | 2019-09 | 2019-08 | 2019-07 | 2019-06 | 2019-05 | 2019-04 | 2019-03 | 2019-02 | 2019-01 | 2018-12 | 2018-11 | 2018-10 |
|---|---|---|---|---|---|---|---|---|---|---|---|---|---|---|---|---|---|---|---|---|
| pm25 | 30 (Moderate) | 36 (Unhealthy for Sensitive Groups) | 33 (Moderate) | 35 (Moderate) | 52 (Unhealthy for Sensitive Groups) | 58 (Unhealthy) | 47 (Unhealthy for Sensitive Groups) | 32 (Moderate) | 38 (Unhealthy for Sensitive Groups) | 31 (Moderate) | 28 (Moderate) | 31 (Moderate) | 39 (Unhealthy for Sensitive Groups) | 39 (Unhealthy for Sensitive Groups) | 48 (Unhealthy for Sensitive Groups) | 66 (Unhealthy) | 98 (Very Unhealthy) | 62 (Unhealthy) | 61 (Unhealthy) | 43 (Unhealthy for Sensitive Groups) |
| co | 556 (Good) | 689 (Good) | 1 (Good) | 687 (Good) | 940 (Good) | 1 (Good) | 1 (Good) | 785 (Good) | 985 (Good) | 941 (Good) | 944 (Good) | 857 (Good) | 868 (Good) | 1 (Good) | 962 (Good) | 1 (Good) | 1 (Good) | 1 (Good) | 1 (Good) | 765 (Good) |
| no2 | 30 (Good) | 44 (Moderate) | 24 (Good) | 23 (Good) | 35 (Good) | 67 (Moderate) | 59 (Moderate) | 45 (Moderate) | 46 (Moderate) | 30 (Good) | 35 (Good) | 39 (Good) | 53 (Moderate) | 47 (Moderate) | 48 (Moderate) | 30 (Good) | 49 (Moderate) | 40 (Good) | 54 (Moderate) | 62 (Moderate) |
| o3 | 131 (Unhealthy for Sensitive Groups) | 133 (Unhealthy for Sensitive Groups) | 103 (Moderate) | 86 (Moderate) | 56 (Good) | 57 (Good) | 92 (Moderate) | 124 (Unhealthy for Sensitive Groups) | 190 (Very Unhealthy) | 183 (Very Unhealthy) | 150 (Unhealthy) | 170 (Unhealthy) | 149 (Unhealthy for Sensitive Groups) | 137 (Unhealthy for Sensitive Groups) | 82 (Moderate) | 49 (Good) | 40 (Good) | 32 (Good) | 70 (Good) | 97 (Moderate) |
| pm10 | 56 (Unhealthy for Sensitive Groups) | 64 (Unhealthy for Sensitive Groups) | 54 (Unhealthy for Sensitive Groups) | 43 (Moderate) | 71 (Unhealthy for Sensitive Groups) | 104 (Unhealthy) | 97 (Unhealthy) | 61 (Unhealthy for Sensitive Groups) | 71 (Unhealthy for Sensitive Groups) | 57 (Unhealthy for Sensitive Groups) | 53 (Unhealthy for Sensitive Groups) | 54 (Unhealthy for Sensitive Groups) | 78 (Unhealthy for Sensitive Groups) | 71 (Unhealthy for Sensitive Groups) | 89 (Unhealthy) | 84 (Unhealthy) | 119 (Very Unhealthy) | 89 (Unhealthy) | 85 (Unhealthy) | 84 (Unhealthy) |
| so2 | 9.1 (Good) | 11 (Good) | 9.7 (Good) | 8 (Good) | 6.4 (Good) | 14 (Good) | 13 (Good) | 7.9 (Good) | 13 (Good) | 7.8 (Good) | 5.5 (Good) | 6.7 (Good) | 10 (Good) | 11 (Good) | 10 (Good) | 8 (Good) | 9.5 (Good) | 6.6 (Good) | 7.4 (Good) | 9.6 (Good) |
PM10 179 (Very bad Hazardous)
particulate matter (PM10) suspended dustPM2,5 35 (Unhealthy for Sensitive Groups)
particulate matter (PM2.5) dustO3 0.04 (Good)
ozone (O3)NO2 0 (Good)
nitrogen dioxide (NO2)SO2 0 (Good)
sulfur dioxide (SO2)沌口新区
| index | 2022-05-27 |
|---|---|
| pm10 | 56 |
| pm25 | 56 |
| o3 | 0.03 |
| no2 | 0 |
| so2 | 0 |
沌口新区

| index | 2020-05 | 2020-04 | 2020-03 | 2020-02 | 2020-01 | 2019-12 | 2019-11 | 2019-10 | 2019-09 | 2019-08 | 2019-07 | 2019-06 | 2019-05 | 2019-04 | 2019-03 | 2019-02 | 2019-01 | 2018-12 | 2018-11 | 2018-10 |
|---|---|---|---|---|---|---|---|---|---|---|---|---|---|---|---|---|---|---|---|---|
| pm25 | 30 | 36 | 33 | 35 | 52 | 58 | 47 | 32 | 38 | 31 | 28 | 31 | 39 | 39 | 48 | 66 | 98 | 62 | 61 | 43 |
| co | 556 | 689 | 1 | 687 | 940 | 1 | 1 | 785 | 985 | 941 | 944 | 857 | 868 | 1 | 962 | 1 | 1 | 1 | 1 | 765 |
| no2 | 30 | 44 | 24 | 23 | 35 | 67 | 59 | 45 | 46 | 30 | 35 | 39 | 53 | 47 | 48 | 30 | 49 | 40 | 54 | 62 |
| o3 | 131 | 133 | 103 | 86 | 56 | 57 | 92 | 124 | 190 | 183 | 150 | 170 | 149 | 137 | 82 | 49 | 40 | 32 | 70 | 97 |
| pm10 | 56 | 64 | 54 | 43 | 71 | 104 | 97 | 61 | 71 | 57 | 53 | 54 | 78 | 71 | 89 | 84 | 119 | 89 | 85 | 84 |
| so2 | 9.1 | 11 | 9.7 | 8 | 6.4 | 14 | 13 | 7.9 | 13 | 7.8 | 5.5 | 6.7 | 10 | 11 | 10 | 8 | 9.5 | 6.6 | 7.4 | 9.6 |