Air Pollution in Chengbei: Real-time Air Quality Index and smog alert.
Pollution and air quality forecast for Chengbei. Today is Tuesday, June 2, 2026. The following air pollution values have been recorded for Chengbei:- particulate matter (PM10) suspended dust - 179 (Very bad Hazardous)
- particulate matter (PM2.5) dust - 35 (Unhealthy for Sensitive Groups)
- ozone (O3) - 0 (Good)
- nitrogen dioxide (NO2) - 0 (Good)
- sulfur dioxide (SO2) - 0 (Good)

What is the air quality in Chengbei today? Is the air polluted in Chengbei?. Is there smog?
What is the level of PM10 today in Chengbei? (particulate matter (PM10) suspended dust)
The current level of particulate matter PM10 in Chengbei is:
179 (Very bad Hazardous)
The highest PM10 values usually occur in month: 97 (November 2019).
The lowest value of particulate matter PM10 pollution in Chengbei is usually recorded in: September (42).
What is the current level of PM2.5 in Chengbei? (particulate matter (PM2.5) dust)
Today's PM2.5 level is:
35 (Unhealthy for Sensitive Groups)
For comparison, the highest level of PM2.5 in Chengbei in the last 7 days was: 56 (Friday, May 27, 2022) and the lowest: 56 (Friday, May 27, 2022).
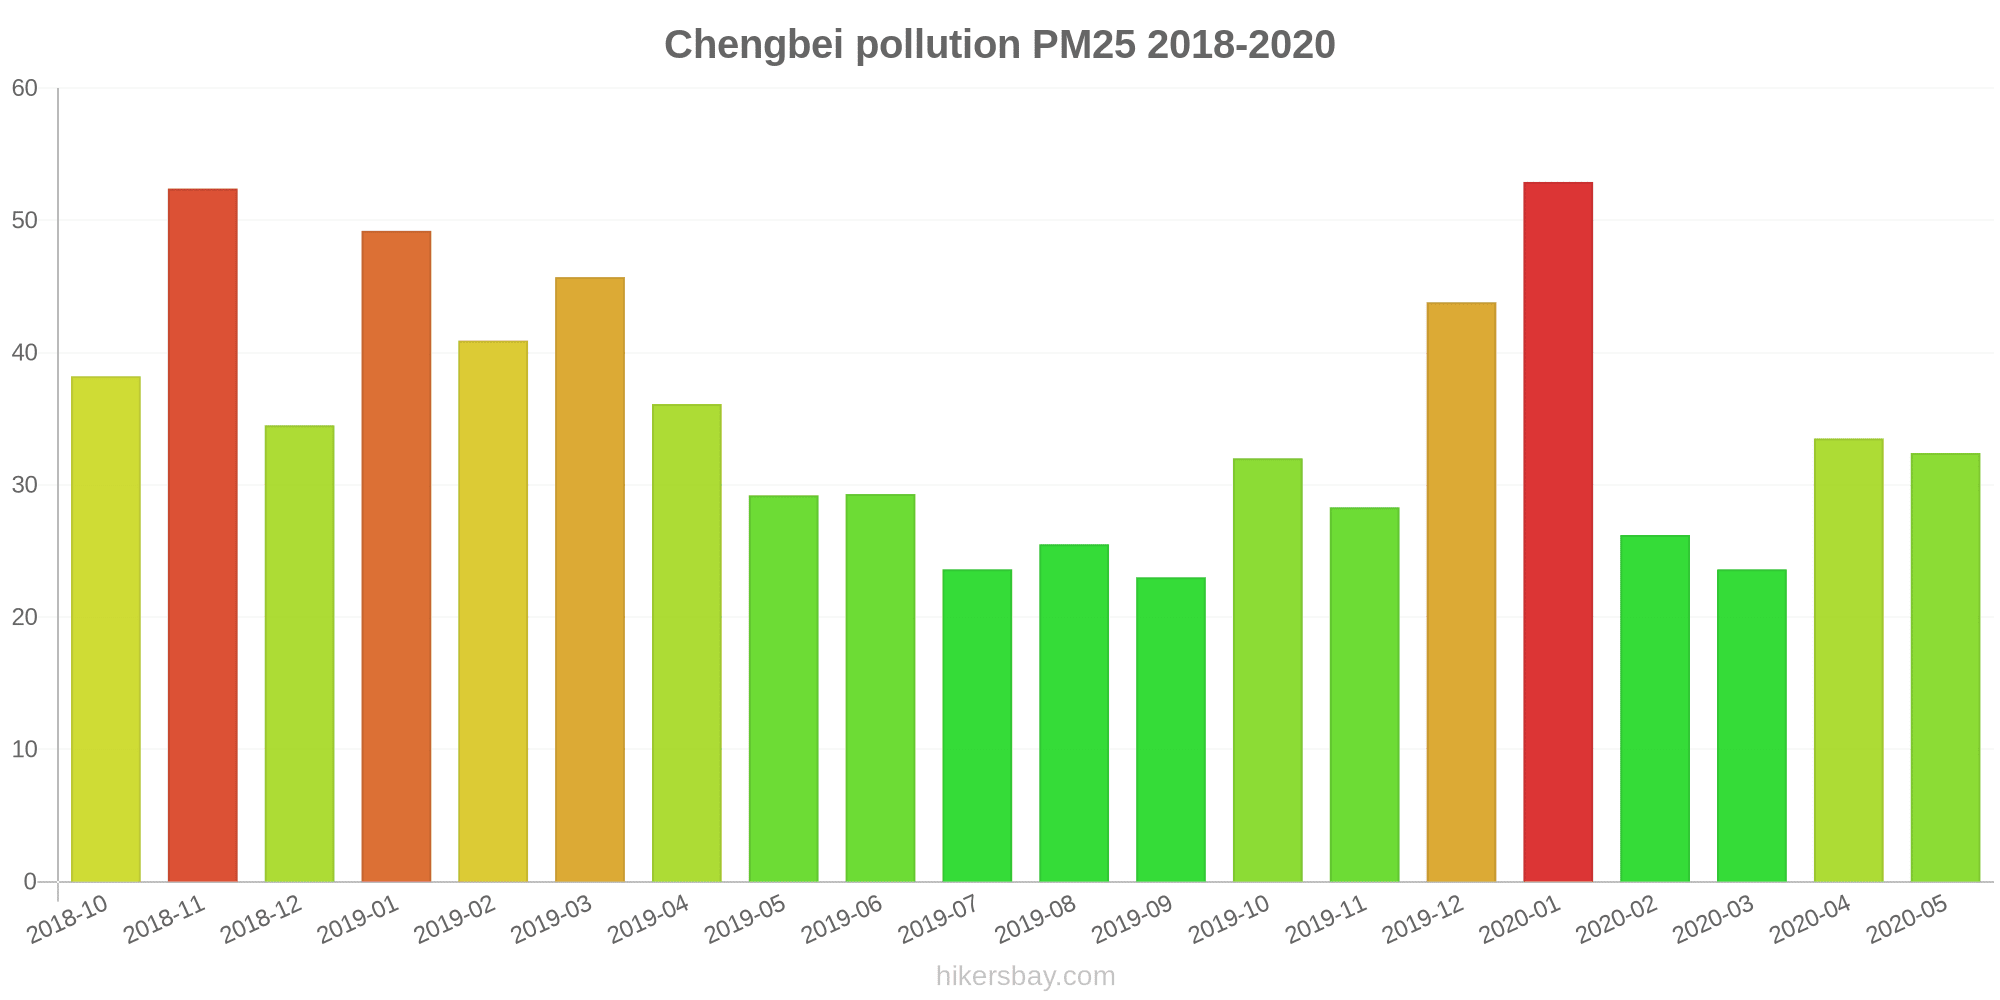
The highest PM2.5 values were recorded: 53 (January 2020).
The lowest level of particulate matter PM2.5 pollution occurs in month: September (23).
How is the O3 level today in Chengbei? (ozone (O3))
0 (Good)
How high is the level of NO2? (nitrogen dioxide (NO2))
0 (Good)
What is the level of SO2 pollution? (sulfur dioxide (SO2))
0 (Good)
Current data Friday, May 27, 2022, 12:00 PM
PM10 179 (Very bad Hazardous)
PM2,5 35 (Unhealthy for Sensitive Groups)
O3 0 (Good)
NO2 0 (Good)
SO2 0 (Good)
Data on air pollution from recent days in Chengbei
index
2022-05-27
pm10
56
Unhealthy for Sensitive Groups
pm25
56
Unhealthy
o3
0
Good
no2
0
Good
so2
0
Good
data source »
Air pollution in Chengbei from October 2018 to May 2020

index
2020-05
2020-04
2020-03
2020-02
2020-01
2019-12
2019-11
2019-10
2019-09
2019-08
2019-07
2019-06
2019-05
2019-04
2019-03
2019-02
2019-01
2018-12
2018-11
2018-10
pm25
32 (Moderate)
34 (Moderate)
24 (Moderate)
26 (Moderate)
53 (Unhealthy for Sensitive Groups)
44 (Unhealthy for Sensitive Groups)
28 (Moderate)
32 (Moderate)
23 (Moderate)
26 (Moderate)
24 (Moderate)
29 (Moderate)
29 (Moderate)
36 (Unhealthy for Sensitive Groups)
46 (Unhealthy for Sensitive Groups)
41 (Unhealthy for Sensitive Groups)
49 (Unhealthy for Sensitive Groups)
35 (Moderate)
52 (Unhealthy for Sensitive Groups)
38 (Unhealthy for Sensitive Groups)
co
865 (Good)
873 (Good)
662 (Good)
1 (Good)
1 (Good)
980 (Good)
808 (Good)
759 (Good)
628 (Good)
703 (Good)
556 (Good)
619 (Good)
604 (Good)
774 (Good)
949 (Good)
905 (Good)
1 (Good)
910 (Good)
903 (Good)
735 (Good)
no2
30 (Good)
38 (Good)
33 (Good)
20 (Good)
30 (Good)
52 (Moderate)
42 (Moderate)
43 (Moderate)
22 (Good)
20 (Good)
22 (Good)
21 (Good)
32 (Good)
36 (Good)
46 (Moderate)
32 (Good)
53 (Moderate)
50 (Moderate)
51 (Moderate)
45 (Moderate)
o3
146 (Unhealthy for Sensitive Groups)
138 (Unhealthy for Sensitive Groups)
113 (Moderate)
89 (Moderate)
82 (Moderate)
77 (Moderate)
82 (Moderate)
132 (Unhealthy for Sensitive Groups)
139 (Unhealthy for Sensitive Groups)
158 (Unhealthy)
152 (Unhealthy)
154 (Unhealthy)
163 (Unhealthy)
128 (Unhealthy for Sensitive Groups)
128 (Unhealthy for Sensitive Groups)
86 (Moderate)
78 (Moderate)
69 (Good)
105 (Moderate)
140 (Unhealthy for Sensitive Groups)
pm10
55 (Unhealthy for Sensitive Groups)
66 (Unhealthy for Sensitive Groups)
49 (Moderate)
43 (Moderate)
68 (Unhealthy for Sensitive Groups)
- (Good)
97 (Unhealthy)
68 (Unhealthy for Sensitive Groups)
42 (Moderate)
45 (Moderate)
42 (Moderate)
43 (Moderate)
60 (Unhealthy for Sensitive Groups)
58 (Unhealthy for Sensitive Groups)
75 (Unhealthy for Sensitive Groups)
64 (Unhealthy for Sensitive Groups)
75 (Unhealthy for Sensitive Groups)
64 (Unhealthy for Sensitive Groups)
67 (Unhealthy for Sensitive Groups)
60 (Unhealthy for Sensitive Groups)
so2
6.1 (Good)
8.6 (Good)
9 (Good)
6.2 (Good)
6.9 (Good)
8.6 (Good)
7.7 (Good)
8.2 (Good)
11 (Good)
11 (Good)
11 (Good)
9.1 (Good)
11 (Good)
9.9 (Good)
11 (Good)
7.6 (Good)
14 (Good)
14 (Good)
12 (Good)
13 (Good)
data source »
昆山实验小学
Friday, May 27, 2022, 12:00 PM
PM10 179 (Very bad Hazardous)
particulate matter (PM10) suspended dust
PM2,5 35 (Unhealthy for Sensitive Groups)
particulate matter (PM2.5) dust
O3 0.04 (Good)
ozone (O3)
NO2 0 (Good)
nitrogen dioxide (NO2)
SO2 0 (Good)
sulfur dioxide (SO2)
昆山实验小学
index
2022-05-27
pm10
56
pm25
56
o3
0.03
no2
0
so2
0
昆山实验小学
2018-10 2020-05
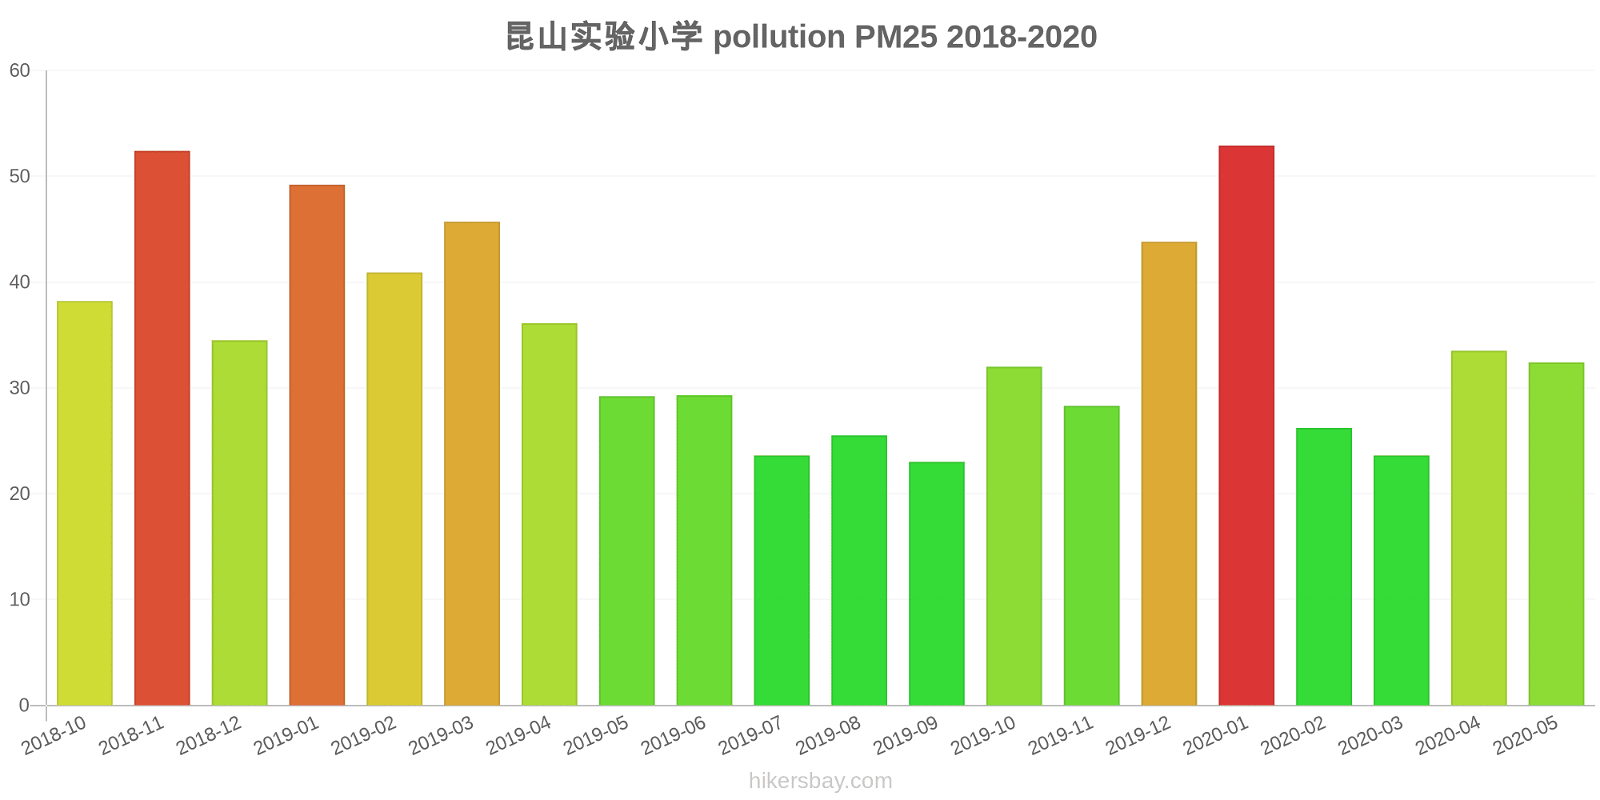
index
2020-05
2020-04
2020-03
2020-02
2020-01
2019-12
2019-11
2019-10
2019-09
2019-08
2019-07
2019-06
2019-05
2019-04
2019-03
2019-02
2019-01
2018-12
2018-11
2018-10
pm25
32
34
24
26
53
44
28
32
23
26
24
29
29
36
46
41
49
35
52
38
co
865
873
662
1
1
980
808
759
628
703
556
619
604
774
949
905
1
910
903
735
no2
30
38
33
20
30
52
42
43
22
20
22
21
32
36
46
32
53
50
51
45
o3
146
138
113
89
82
77
82
132
139
158
152
154
163
128
128
86
78
69
105
140
pm10
55
66
49
43
68
-
97
68
42
45
42
43
60
58
75
64
75
64
67
60
so2
6.1
8.6
9
6.2
6.9
8.6
7.7
8.2
11
11
11
9.1
11
9.9
11
7.6
14
14
12
13
* Pollution data source:
https://openaq.org
(ChinaAQIData)
The data is licensed under CC-By 4.0
PM10 179 (Very bad Hazardous)
PM2,5 35 (Unhealthy for Sensitive Groups)
O3 0 (Good)
NO2 0 (Good)
SO2 0 (Good)
Data on air pollution from recent days in Chengbei
| index | 2022-05-27 |
|---|---|
| pm10 | 56 Unhealthy for Sensitive Groups |
| pm25 | 56 Unhealthy |
| o3 | 0 Good |
| no2 | 0 Good |
| so2 | 0 Good |
| index | 2020-05 | 2020-04 | 2020-03 | 2020-02 | 2020-01 | 2019-12 | 2019-11 | 2019-10 | 2019-09 | 2019-08 | 2019-07 | 2019-06 | 2019-05 | 2019-04 | 2019-03 | 2019-02 | 2019-01 | 2018-12 | 2018-11 | 2018-10 |
|---|---|---|---|---|---|---|---|---|---|---|---|---|---|---|---|---|---|---|---|---|
| pm25 | 32 (Moderate) | 34 (Moderate) | 24 (Moderate) | 26 (Moderate) | 53 (Unhealthy for Sensitive Groups) | 44 (Unhealthy for Sensitive Groups) | 28 (Moderate) | 32 (Moderate) | 23 (Moderate) | 26 (Moderate) | 24 (Moderate) | 29 (Moderate) | 29 (Moderate) | 36 (Unhealthy for Sensitive Groups) | 46 (Unhealthy for Sensitive Groups) | 41 (Unhealthy for Sensitive Groups) | 49 (Unhealthy for Sensitive Groups) | 35 (Moderate) | 52 (Unhealthy for Sensitive Groups) | 38 (Unhealthy for Sensitive Groups) |
| co | 865 (Good) | 873 (Good) | 662 (Good) | 1 (Good) | 1 (Good) | 980 (Good) | 808 (Good) | 759 (Good) | 628 (Good) | 703 (Good) | 556 (Good) | 619 (Good) | 604 (Good) | 774 (Good) | 949 (Good) | 905 (Good) | 1 (Good) | 910 (Good) | 903 (Good) | 735 (Good) |
| no2 | 30 (Good) | 38 (Good) | 33 (Good) | 20 (Good) | 30 (Good) | 52 (Moderate) | 42 (Moderate) | 43 (Moderate) | 22 (Good) | 20 (Good) | 22 (Good) | 21 (Good) | 32 (Good) | 36 (Good) | 46 (Moderate) | 32 (Good) | 53 (Moderate) | 50 (Moderate) | 51 (Moderate) | 45 (Moderate) |
| o3 | 146 (Unhealthy for Sensitive Groups) | 138 (Unhealthy for Sensitive Groups) | 113 (Moderate) | 89 (Moderate) | 82 (Moderate) | 77 (Moderate) | 82 (Moderate) | 132 (Unhealthy for Sensitive Groups) | 139 (Unhealthy for Sensitive Groups) | 158 (Unhealthy) | 152 (Unhealthy) | 154 (Unhealthy) | 163 (Unhealthy) | 128 (Unhealthy for Sensitive Groups) | 128 (Unhealthy for Sensitive Groups) | 86 (Moderate) | 78 (Moderate) | 69 (Good) | 105 (Moderate) | 140 (Unhealthy for Sensitive Groups) |
| pm10 | 55 (Unhealthy for Sensitive Groups) | 66 (Unhealthy for Sensitive Groups) | 49 (Moderate) | 43 (Moderate) | 68 (Unhealthy for Sensitive Groups) | - (Good) | 97 (Unhealthy) | 68 (Unhealthy for Sensitive Groups) | 42 (Moderate) | 45 (Moderate) | 42 (Moderate) | 43 (Moderate) | 60 (Unhealthy for Sensitive Groups) | 58 (Unhealthy for Sensitive Groups) | 75 (Unhealthy for Sensitive Groups) | 64 (Unhealthy for Sensitive Groups) | 75 (Unhealthy for Sensitive Groups) | 64 (Unhealthy for Sensitive Groups) | 67 (Unhealthy for Sensitive Groups) | 60 (Unhealthy for Sensitive Groups) |
| so2 | 6.1 (Good) | 8.6 (Good) | 9 (Good) | 6.2 (Good) | 6.9 (Good) | 8.6 (Good) | 7.7 (Good) | 8.2 (Good) | 11 (Good) | 11 (Good) | 11 (Good) | 9.1 (Good) | 11 (Good) | 9.9 (Good) | 11 (Good) | 7.6 (Good) | 14 (Good) | 14 (Good) | 12 (Good) | 13 (Good) |
PM10 179 (Very bad Hazardous)
particulate matter (PM10) suspended dustPM2,5 35 (Unhealthy for Sensitive Groups)
particulate matter (PM2.5) dustO3 0.04 (Good)
ozone (O3)NO2 0 (Good)
nitrogen dioxide (NO2)SO2 0 (Good)
sulfur dioxide (SO2)昆山实验小学
| index | 2022-05-27 |
|---|---|
| pm10 | 56 |
| pm25 | 56 |
| o3 | 0.03 |
| no2 | 0 |
| so2 | 0 |
昆山实验小学

| index | 2020-05 | 2020-04 | 2020-03 | 2020-02 | 2020-01 | 2019-12 | 2019-11 | 2019-10 | 2019-09 | 2019-08 | 2019-07 | 2019-06 | 2019-05 | 2019-04 | 2019-03 | 2019-02 | 2019-01 | 2018-12 | 2018-11 | 2018-10 |
|---|---|---|---|---|---|---|---|---|---|---|---|---|---|---|---|---|---|---|---|---|
| pm25 | 32 | 34 | 24 | 26 | 53 | 44 | 28 | 32 | 23 | 26 | 24 | 29 | 29 | 36 | 46 | 41 | 49 | 35 | 52 | 38 |
| co | 865 | 873 | 662 | 1 | 1 | 980 | 808 | 759 | 628 | 703 | 556 | 619 | 604 | 774 | 949 | 905 | 1 | 910 | 903 | 735 |
| no2 | 30 | 38 | 33 | 20 | 30 | 52 | 42 | 43 | 22 | 20 | 22 | 21 | 32 | 36 | 46 | 32 | 53 | 50 | 51 | 45 |
| o3 | 146 | 138 | 113 | 89 | 82 | 77 | 82 | 132 | 139 | 158 | 152 | 154 | 163 | 128 | 128 | 86 | 78 | 69 | 105 | 140 |
| pm10 | 55 | 66 | 49 | 43 | 68 | - | 97 | 68 | 42 | 45 | 42 | 43 | 60 | 58 | 75 | 64 | 75 | 64 | 67 | 60 |
| so2 | 6.1 | 8.6 | 9 | 6.2 | 6.9 | 8.6 | 7.7 | 8.2 | 11 | 11 | 11 | 9.1 | 11 | 9.9 | 11 | 7.6 | 14 | 14 | 12 | 13 |