Air Pollution in Guanwangmiao: Real-time Air Quality Index and smog alert.
Pollution and air quality forecast for Guanwangmiao. Today is Friday, June 19, 2026. The following air pollution values have been recorded for Guanwangmiao:- particulate matter (PM10) suspended dust - 53 (Unhealthy for Sensitive Groups)
- ozone (O3) - 0 (Good)
- particulate matter (PM2.5) dust - 7 (Good)
- sulfur dioxide (SO2) - 18 (Good)
- nitrogen dioxide (NO2) - 3 (Good)
- carbon monoxide (CO) - 1 (Good)

What is the air quality in Guanwangmiao today? Is the air polluted in Guanwangmiao?. Is there smog?
What is the level of PM10 today in Guanwangmiao? (particulate matter (PM10) suspended dust)
The current level of particulate matter PM10 in Guanwangmiao is:
53 (Unhealthy for Sensitive Groups)
The highest PM10 values usually occur in month: 63 (October 2018).
The lowest value of particulate matter PM10 pollution in Guanwangmiao is usually recorded in: June (32).
How is the O3 level today in Guanwangmiao? (ozone (O3))
0 (Good)
What is the current level of PM2.5 in Guanwangmiao? (particulate matter (PM2.5) dust)
Today's PM2.5 level is:
7 (Good)
For comparison, the highest level of PM2.5 in Guanwangmiao in the last 7 days was: 21 (Friday, May 27, 2022) and the lowest: 21 (Friday, May 27, 2022).
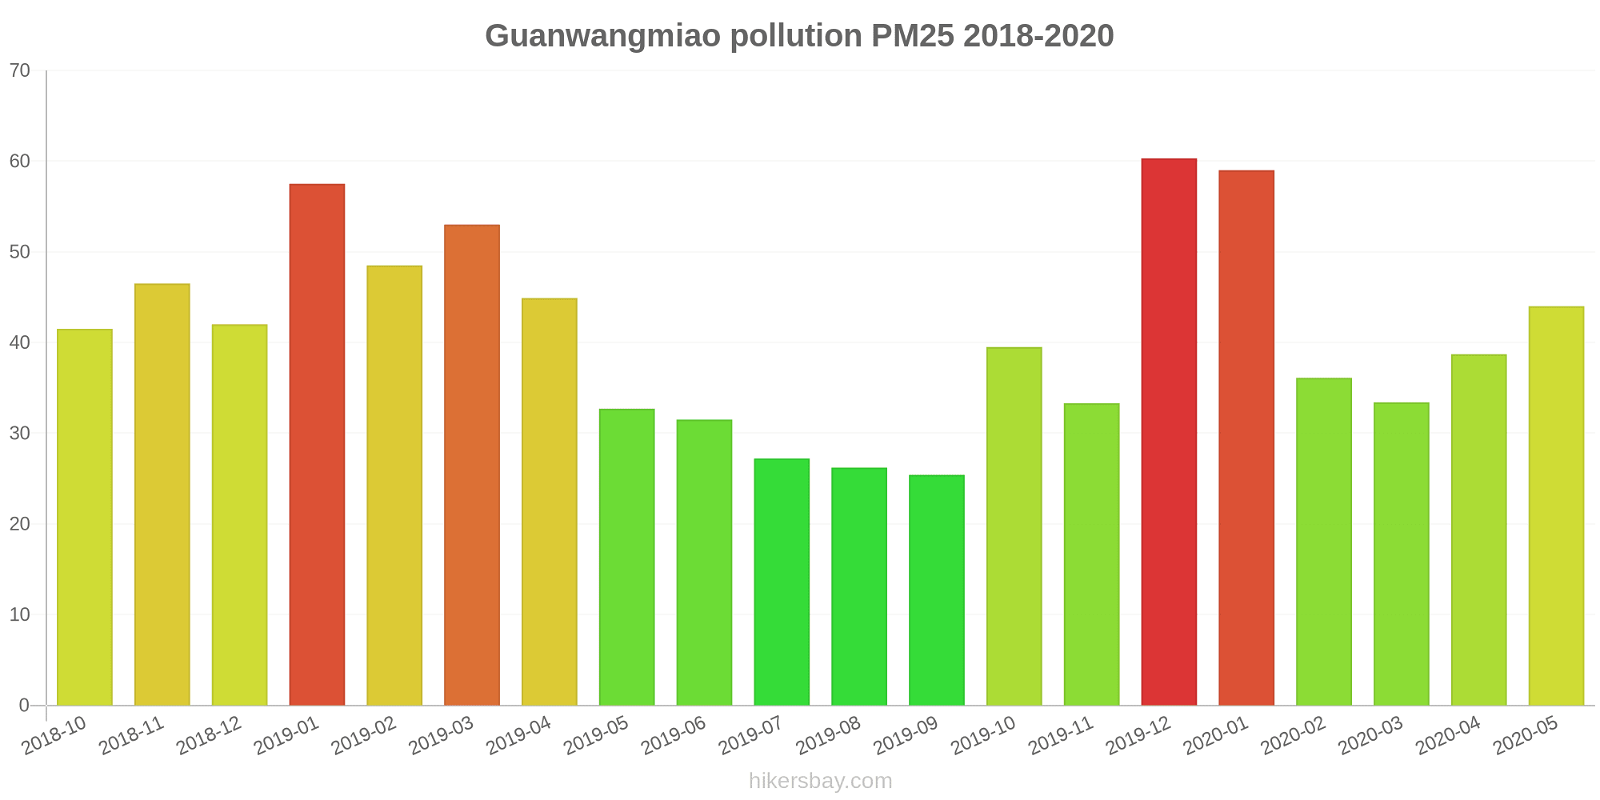
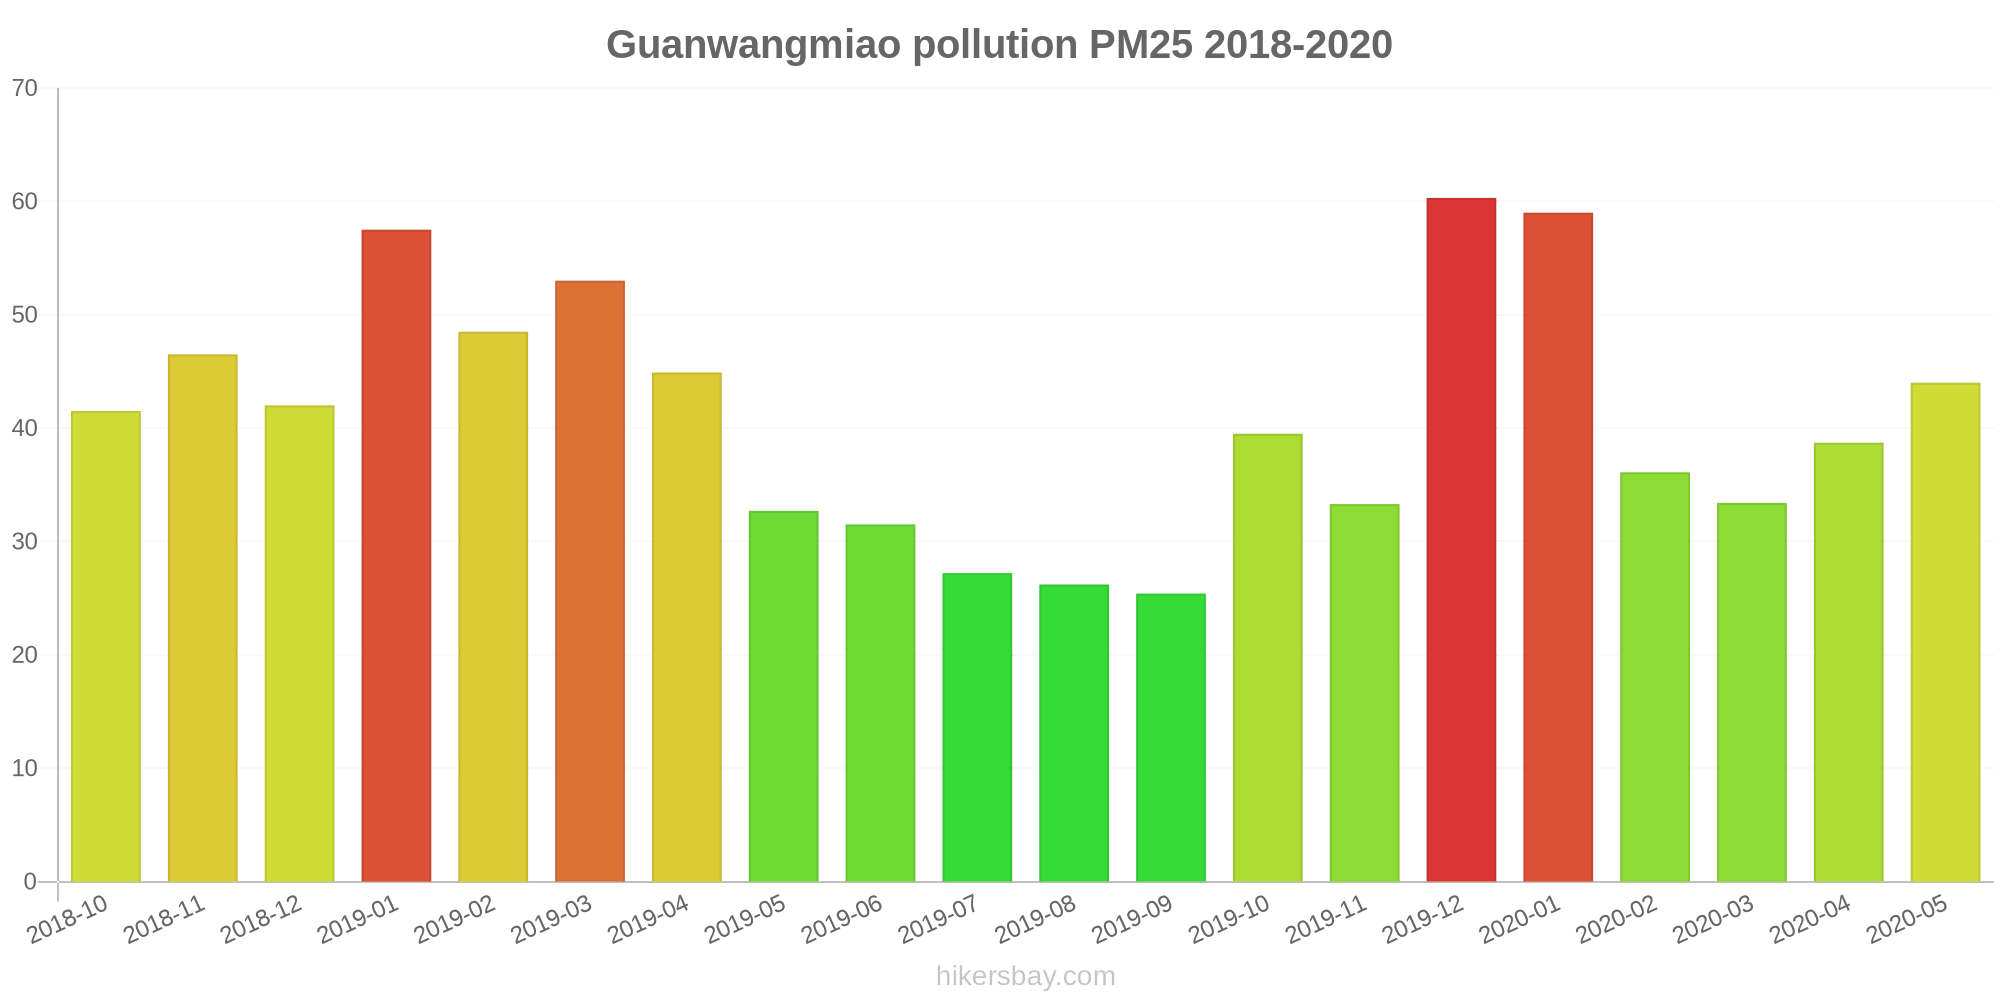
The highest PM2.5 values were recorded: 60 (December 2019).
The lowest level of particulate matter PM2.5 pollution occurs in month: September (25).
What is the level of SO2 pollution? (sulfur dioxide (SO2))
18 (Good)
How high is the level of NO2? (nitrogen dioxide (NO2))
3 (Good)
How high is the CO level? (carbon monoxide (CO))
1 (Good)
Current data Friday, May 27, 2022, 12:00 PM
PM10 53 (Unhealthy for Sensitive Groups)
O3 0 (Good)
PM2,5 7 (Good)
SO2 18 (Good)
NO2 3 (Good)
CO 1 (Good)
Data on air pollution from recent days in Guanwangmiao
index
2022-05-27
pm10
51
Unhealthy for Sensitive Groups
o3
0
Good
pm25
21
Moderate
so2
10
Good
no2
0
Good
co
1
Good
data source »
Air pollution in Guanwangmiao from October 2018 to May 2020
index
2020-05
2020-04
2020-03
2020-02
2020-01
2019-12
2019-11
2019-10
2019-09
2019-08
2019-07
2019-06
2019-05
2019-04
2019-03
2019-02
2019-01
2018-12
2018-11
2018-10
pm25
44 (Unhealthy for Sensitive Groups)
39 (Unhealthy for Sensitive Groups)
33 (Moderate)
36 (Unhealthy for Sensitive Groups)
59 (Unhealthy)
60 (Unhealthy)
33 (Moderate)
40 (Unhealthy for Sensitive Groups)
25 (Moderate)
26 (Moderate)
27 (Moderate)
32 (Moderate)
33 (Moderate)
45 (Unhealthy for Sensitive Groups)
53 (Unhealthy for Sensitive Groups)
49 (Unhealthy for Sensitive Groups)
58 (Unhealthy)
42 (Unhealthy for Sensitive Groups)
47 (Unhealthy for Sensitive Groups)
42 (Unhealthy for Sensitive Groups)
co
701 (Good)
575 (Good)
593 (Good)
530 (Good)
812 (Good)
814 (Good)
658 (Good)
561 (Good)
582 (Good)
607 (Good)
467 (Good)
511 (Good)
724 (Good)
779 (Good)
822 (Good)
793 (Good)
827 (Good)
790 (Good)
761 (Good)
598 (Good)
no2
30 (Good)
41 (Moderate)
37 (Good)
24 (Good)
42 (Moderate)
63 (Moderate)
48 (Moderate)
44 (Moderate)
24 (Good)
21 (Good)
28 (Good)
24 (Good)
34 (Good)
38 (Good)
45 (Moderate)
30 (Good)
49 (Moderate)
43 (Moderate)
52 (Moderate)
46 (Moderate)
o3
159 (Unhealthy)
157 (Unhealthy)
117 (Moderate)
104 (Moderate)
77 (Moderate)
78 (Moderate)
101 (Moderate)
127 (Unhealthy for Sensitive Groups)
151 (Unhealthy)
147 (Unhealthy for Sensitive Groups)
144 (Unhealthy for Sensitive Groups)
174 (Unhealthy)
181 (Very Unhealthy)
146 (Unhealthy for Sensitive Groups)
126 (Unhealthy for Sensitive Groups)
90 (Moderate)
73 (Moderate)
65 (Good)
100 (Moderate)
131 (Unhealthy for Sensitive Groups)
pm10
46 (Moderate)
53 (Unhealthy for Sensitive Groups)
37 (Moderate)
34 (Moderate)
47 (Moderate)
55 (Unhealthy for Sensitive Groups)
62 (Unhealthy for Sensitive Groups)
60 (Unhealthy for Sensitive Groups)
35 (Moderate)
33 (Moderate)
34 (Moderate)
32 (Moderate)
50 (Moderate)
50 (Moderate)
61 (Unhealthy for Sensitive Groups)
46 (Moderate)
63 (Unhealthy for Sensitive Groups)
55 (Unhealthy for Sensitive Groups)
44 (Moderate)
63 (Unhealthy for Sensitive Groups)
so2
5.1 (Good)
5.8 (Good)
4.4 (Good)
4.8 (Good)
6.9 (Good)
8.1 (Good)
9.2 (Good)
8.8 (Good)
6 (Good)
4.1 (Good)
2.8 (Good)
4.8 (Good)
7.2 (Good)
6.9 (Good)
7.2 (Good)
5.6 (Good)
7.2 (Good)
7 (Good)
6.9 (Good)
9.3 (Good)
data source »
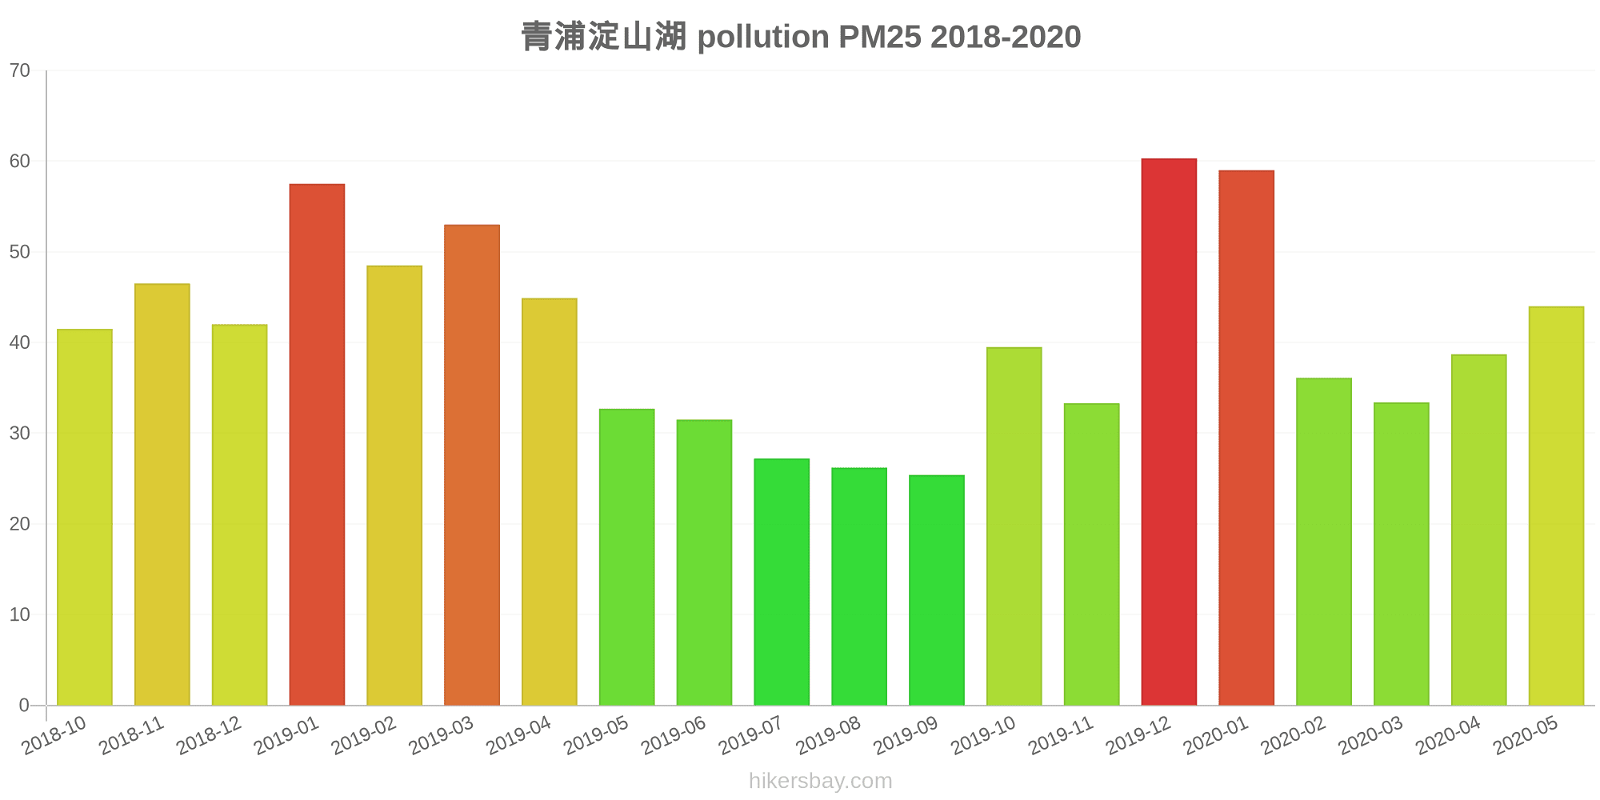
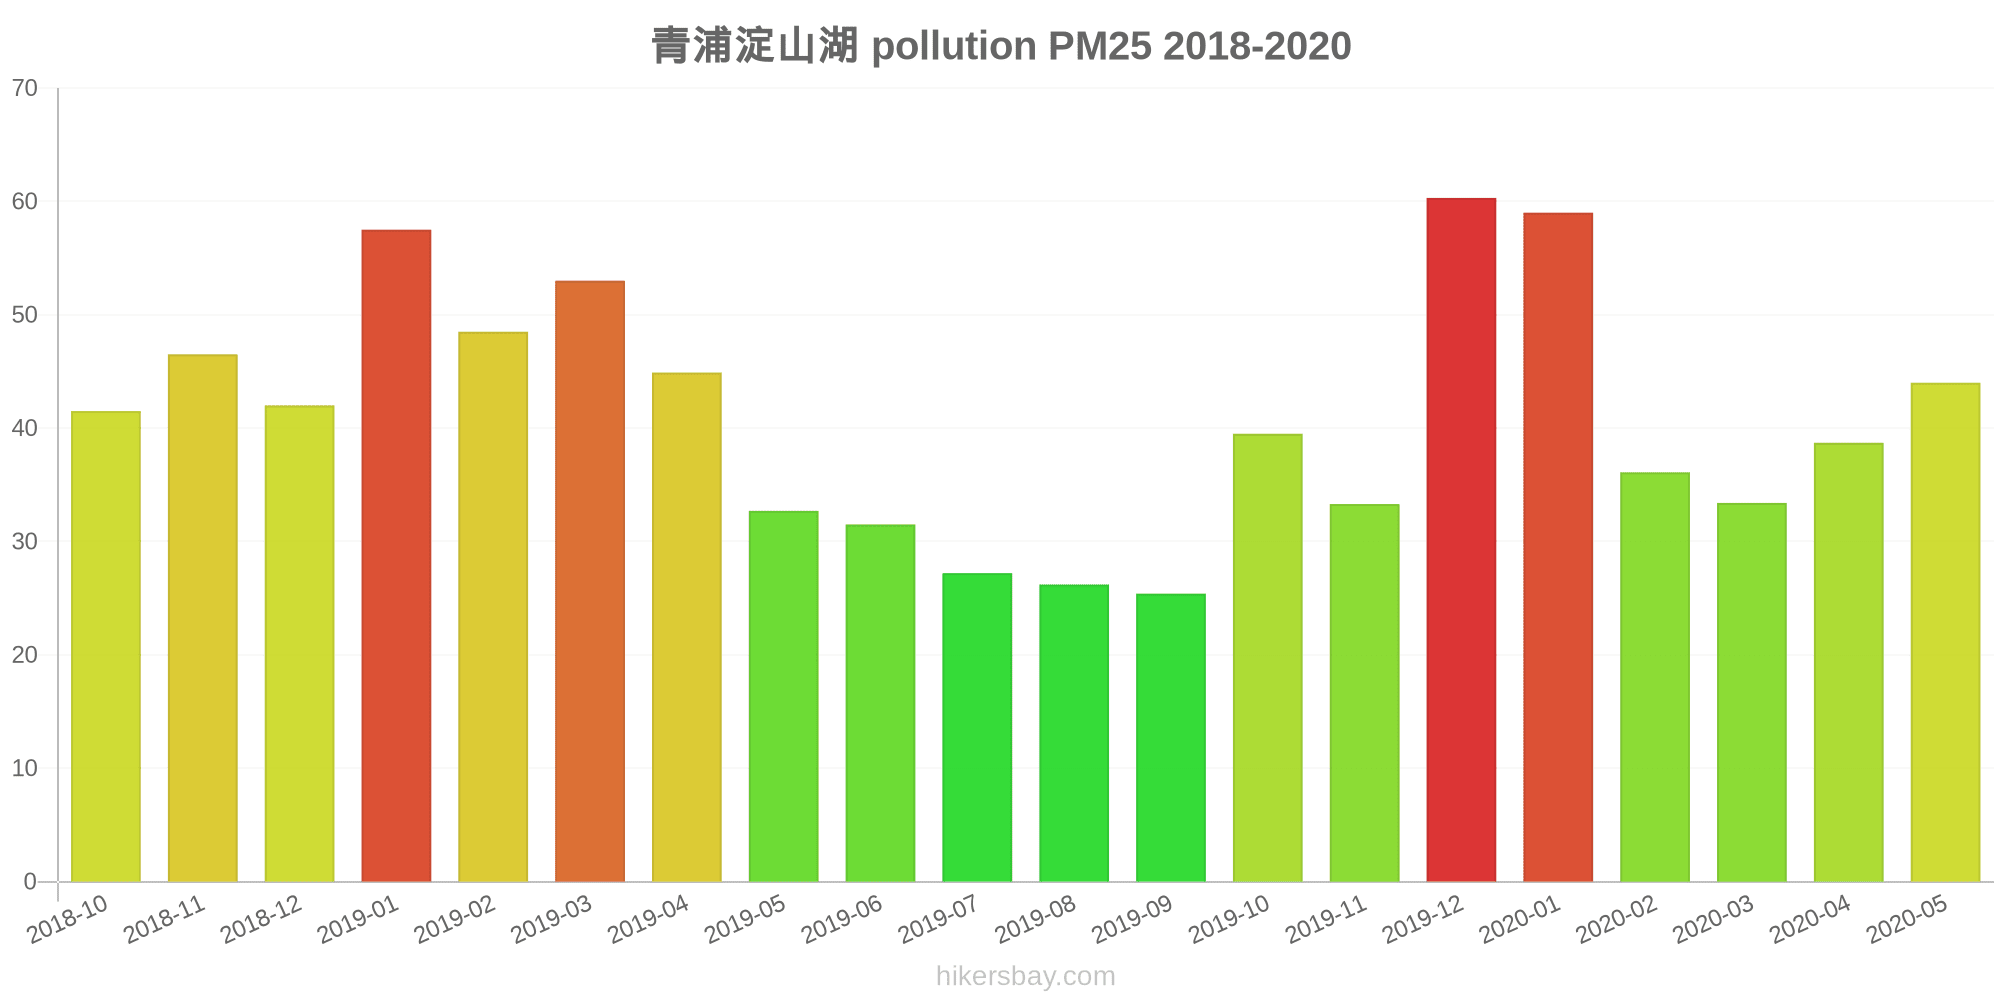
青浦淀山湖
Friday, May 27, 2022, 12:00 PM
PM10 53 (Unhealthy for Sensitive Groups)
particulate matter (PM10) suspended dust
O3 0.02 (Good)
ozone (O3)
PM2,5 6.6 (Good)
particulate matter (PM2.5) dust
SO2 18 (Good)
sulfur dioxide (SO2)
NO2 3 (Good)
nitrogen dioxide (NO2)
CO 1.3 (Good)
carbon monoxide (CO)
青浦淀山湖
index
2022-05-27
pm10
51
o3
0.02
pm25
21
so2
9.6
no2
0.38
co
0.64
青浦淀山湖
2018-10 2020-05
index
2020-05
2020-04
2020-03
2020-02
2020-01
2019-12
2019-11
2019-10
2019-09
2019-08
2019-07
2019-06
2019-05
2019-04
2019-03
2019-02
2019-01
2018-12
2018-11
2018-10
pm25
44
39
33
36
59
60
33
40
25
26
27
32
33
45
53
49
58
42
47
42
co
701
575
593
530
812
814
658
561
582
607
467
511
724
779
822
793
827
790
761
598
no2
30
41
37
24
42
63
48
44
24
21
28
24
34
38
45
30
49
43
52
46
o3
159
157
117
104
77
78
101
127
151
147
144
174
181
146
126
90
73
65
100
131
pm10
46
53
37
34
47
55
62
60
35
33
34
32
50
50
61
46
63
55
44
63
so2
5.1
5.8
4.4
4.8
6.9
8.1
9.2
8.8
6
4.1
2.8
4.8
7.2
6.9
7.2
5.6
7.2
7
6.9
9.3
* Pollution data source:
https://openaq.org
(ChinaAQIData)
The data is licensed under CC-By 4.0
PM10 53 (Unhealthy for Sensitive Groups)
O3 0 (Good)
PM2,5 7 (Good)
SO2 18 (Good)
NO2 3 (Good)
CO 1 (Good)
Data on air pollution from recent days in Guanwangmiao
| index | 2022-05-27 |
|---|---|
| pm10 | 51 Unhealthy for Sensitive Groups |
| o3 | 0 Good |
| pm25 | 21 Moderate |
| so2 | 10 Good |
| no2 | 0 Good |
| co | 1 Good |
| index | 2020-05 | 2020-04 | 2020-03 | 2020-02 | 2020-01 | 2019-12 | 2019-11 | 2019-10 | 2019-09 | 2019-08 | 2019-07 | 2019-06 | 2019-05 | 2019-04 | 2019-03 | 2019-02 | 2019-01 | 2018-12 | 2018-11 | 2018-10 |
|---|---|---|---|---|---|---|---|---|---|---|---|---|---|---|---|---|---|---|---|---|
| pm25 | 44 (Unhealthy for Sensitive Groups) | 39 (Unhealthy for Sensitive Groups) | 33 (Moderate) | 36 (Unhealthy for Sensitive Groups) | 59 (Unhealthy) | 60 (Unhealthy) | 33 (Moderate) | 40 (Unhealthy for Sensitive Groups) | 25 (Moderate) | 26 (Moderate) | 27 (Moderate) | 32 (Moderate) | 33 (Moderate) | 45 (Unhealthy for Sensitive Groups) | 53 (Unhealthy for Sensitive Groups) | 49 (Unhealthy for Sensitive Groups) | 58 (Unhealthy) | 42 (Unhealthy for Sensitive Groups) | 47 (Unhealthy for Sensitive Groups) | 42 (Unhealthy for Sensitive Groups) |
| co | 701 (Good) | 575 (Good) | 593 (Good) | 530 (Good) | 812 (Good) | 814 (Good) | 658 (Good) | 561 (Good) | 582 (Good) | 607 (Good) | 467 (Good) | 511 (Good) | 724 (Good) | 779 (Good) | 822 (Good) | 793 (Good) | 827 (Good) | 790 (Good) | 761 (Good) | 598 (Good) |
| no2 | 30 (Good) | 41 (Moderate) | 37 (Good) | 24 (Good) | 42 (Moderate) | 63 (Moderate) | 48 (Moderate) | 44 (Moderate) | 24 (Good) | 21 (Good) | 28 (Good) | 24 (Good) | 34 (Good) | 38 (Good) | 45 (Moderate) | 30 (Good) | 49 (Moderate) | 43 (Moderate) | 52 (Moderate) | 46 (Moderate) |
| o3 | 159 (Unhealthy) | 157 (Unhealthy) | 117 (Moderate) | 104 (Moderate) | 77 (Moderate) | 78 (Moderate) | 101 (Moderate) | 127 (Unhealthy for Sensitive Groups) | 151 (Unhealthy) | 147 (Unhealthy for Sensitive Groups) | 144 (Unhealthy for Sensitive Groups) | 174 (Unhealthy) | 181 (Very Unhealthy) | 146 (Unhealthy for Sensitive Groups) | 126 (Unhealthy for Sensitive Groups) | 90 (Moderate) | 73 (Moderate) | 65 (Good) | 100 (Moderate) | 131 (Unhealthy for Sensitive Groups) |
| pm10 | 46 (Moderate) | 53 (Unhealthy for Sensitive Groups) | 37 (Moderate) | 34 (Moderate) | 47 (Moderate) | 55 (Unhealthy for Sensitive Groups) | 62 (Unhealthy for Sensitive Groups) | 60 (Unhealthy for Sensitive Groups) | 35 (Moderate) | 33 (Moderate) | 34 (Moderate) | 32 (Moderate) | 50 (Moderate) | 50 (Moderate) | 61 (Unhealthy for Sensitive Groups) | 46 (Moderate) | 63 (Unhealthy for Sensitive Groups) | 55 (Unhealthy for Sensitive Groups) | 44 (Moderate) | 63 (Unhealthy for Sensitive Groups) |
| so2 | 5.1 (Good) | 5.8 (Good) | 4.4 (Good) | 4.8 (Good) | 6.9 (Good) | 8.1 (Good) | 9.2 (Good) | 8.8 (Good) | 6 (Good) | 4.1 (Good) | 2.8 (Good) | 4.8 (Good) | 7.2 (Good) | 6.9 (Good) | 7.2 (Good) | 5.6 (Good) | 7.2 (Good) | 7 (Good) | 6.9 (Good) | 9.3 (Good) |
PM10 53 (Unhealthy for Sensitive Groups)
particulate matter (PM10) suspended dustO3 0.02 (Good)
ozone (O3)PM2,5 6.6 (Good)
particulate matter (PM2.5) dustSO2 18 (Good)
sulfur dioxide (SO2)NO2 3 (Good)
nitrogen dioxide (NO2)CO 1.3 (Good)
carbon monoxide (CO)青浦淀山湖
| index | 2022-05-27 |
|---|---|
| pm10 | 51 |
| o3 | 0.02 |
| pm25 | 21 |
| so2 | 9.6 |
| no2 | 0.38 |
| co | 0.64 |
青浦淀山湖
| index | 2020-05 | 2020-04 | 2020-03 | 2020-02 | 2020-01 | 2019-12 | 2019-11 | 2019-10 | 2019-09 | 2019-08 | 2019-07 | 2019-06 | 2019-05 | 2019-04 | 2019-03 | 2019-02 | 2019-01 | 2018-12 | 2018-11 | 2018-10 |
|---|---|---|---|---|---|---|---|---|---|---|---|---|---|---|---|---|---|---|---|---|
| pm25 | 44 | 39 | 33 | 36 | 59 | 60 | 33 | 40 | 25 | 26 | 27 | 32 | 33 | 45 | 53 | 49 | 58 | 42 | 47 | 42 |
| co | 701 | 575 | 593 | 530 | 812 | 814 | 658 | 561 | 582 | 607 | 467 | 511 | 724 | 779 | 822 | 793 | 827 | 790 | 761 | 598 |
| no2 | 30 | 41 | 37 | 24 | 42 | 63 | 48 | 44 | 24 | 21 | 28 | 24 | 34 | 38 | 45 | 30 | 49 | 43 | 52 | 46 |
| o3 | 159 | 157 | 117 | 104 | 77 | 78 | 101 | 127 | 151 | 147 | 144 | 174 | 181 | 146 | 126 | 90 | 73 | 65 | 100 | 131 |
| pm10 | 46 | 53 | 37 | 34 | 47 | 55 | 62 | 60 | 35 | 33 | 34 | 32 | 50 | 50 | 61 | 46 | 63 | 55 | 44 | 63 |
| so2 | 5.1 | 5.8 | 4.4 | 4.8 | 6.9 | 8.1 | 9.2 | 8.8 | 6 | 4.1 | 2.8 | 4.8 | 7.2 | 6.9 | 7.2 | 5.6 | 7.2 | 7 | 6.9 | 9.3 |