Air Pollution in Xinzhuang: Real-time Air Quality Index and smog alert.
Pollution and air quality forecast for Xinzhuang. Today is Tuesday, June 2, 2026. The following air pollution values have been recorded for Xinzhuang:- particulate matter (PM10) suspended dust - 179 (Very bad Hazardous)
- particulate matter (PM2.5) dust - 35 (Unhealthy for Sensitive Groups)
- ozone (O3) - 0 (Good)
- nitrogen dioxide (NO2) - 0 (Good)
- sulfur dioxide (SO2) - 0 (Good)

What is the air quality in Xinzhuang today? Is the air polluted in Xinzhuang?. Is there smog?
What is the level of PM10 today in Xinzhuang? (particulate matter (PM10) suspended dust)
The current level of particulate matter PM10 in Xinzhuang is:
179 (Very bad Hazardous)
The highest PM10 values usually occur in month: 83 (January 2019).
The lowest value of particulate matter PM10 pollution in Xinzhuang is usually recorded in: July (30).
What is the current level of PM2.5 in Xinzhuang? (particulate matter (PM2.5) dust)
Today's PM2.5 level is:
35 (Unhealthy for Sensitive Groups)
For comparison, the highest level of PM2.5 in Xinzhuang in the last 7 days was: 56 (Friday, May 27, 2022) and the lowest: 56 (Friday, May 27, 2022).
The highest PM2.5 values were recorded: 59 (January 2019).
The lowest level of particulate matter PM2.5 pollution occurs in month: July (17).
How is the O3 level today in Xinzhuang? (ozone (O3))
0 (Good)
How high is the level of NO2? (nitrogen dioxide (NO2))
0 (Good)
What is the level of SO2 pollution? (sulfur dioxide (SO2))
0 (Good)
Current data Friday, May 27, 2022, 12:00 PM
PM10 179 (Very bad Hazardous)
PM2,5 35 (Unhealthy for Sensitive Groups)
O3 0 (Good)
NO2 0 (Good)
SO2 0 (Good)
Data on air pollution from recent days in Xinzhuang
index
2022-05-27
pm10
56
Unhealthy for Sensitive Groups
pm25
56
Unhealthy
o3
0
Good
no2
0
Good
so2
0
Good
data source »
Air pollution in Xinzhuang from October 2018 to May 2020
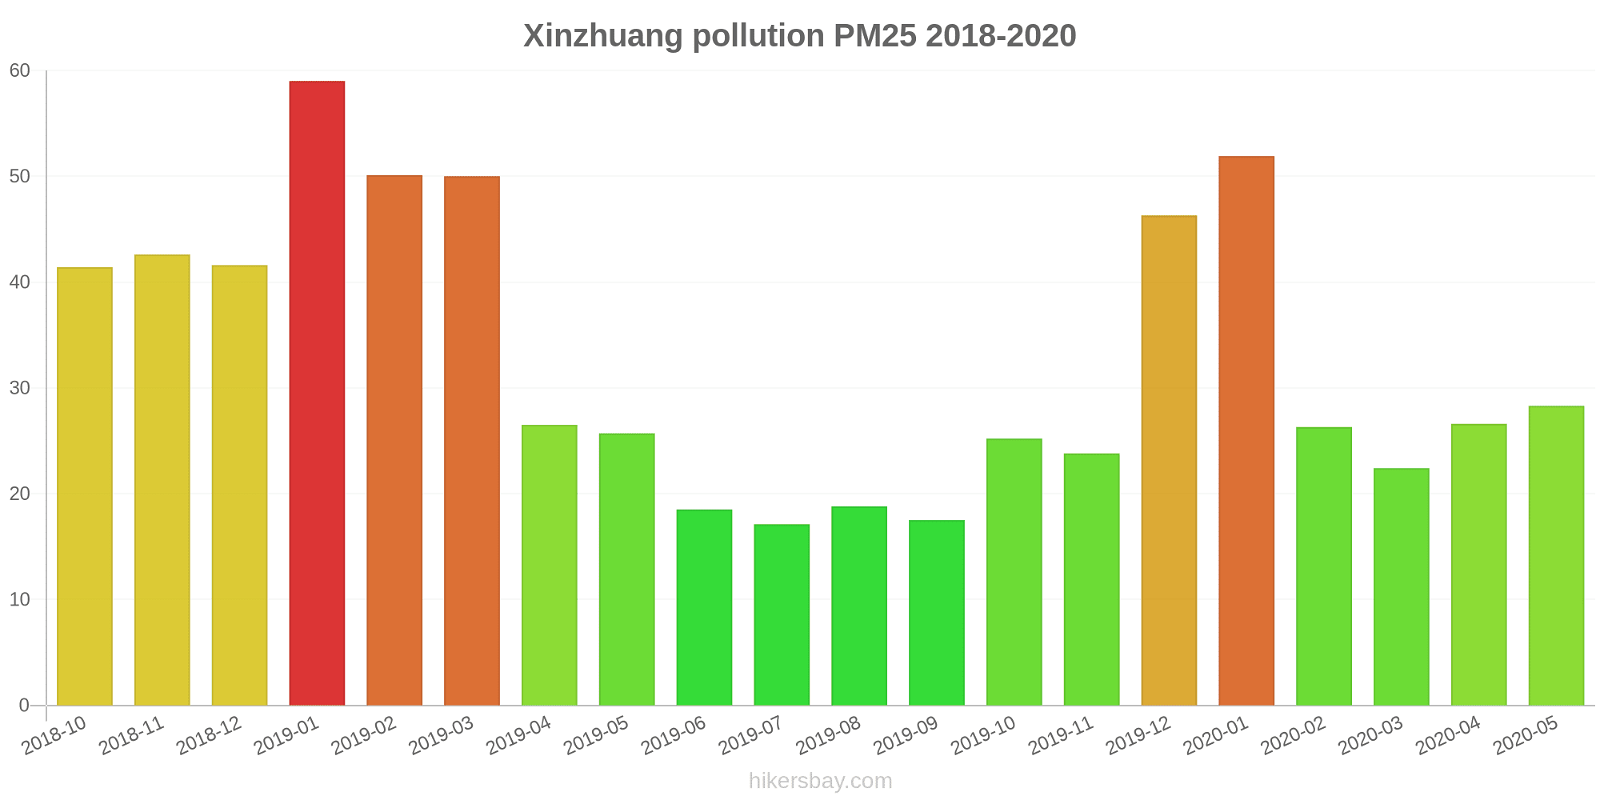
index
2020-05
2020-04
2020-03
2020-02
2020-01
2019-12
2019-11
2019-10
2019-09
2019-08
2019-07
2019-06
2019-05
2019-04
2019-03
2019-02
2019-01
2018-12
2018-11
2018-10
pm25
28 (Moderate)
27 (Moderate)
22 (Moderate)
26 (Moderate)
52 (Unhealthy for Sensitive Groups)
46 (Unhealthy for Sensitive Groups)
24 (Moderate)
25 (Moderate)
18 (Moderate)
19 (Moderate)
17 (Moderate)
19 (Moderate)
26 (Moderate)
27 (Moderate)
50 (Unhealthy for Sensitive Groups)
50 (Unhealthy for Sensitive Groups)
59 (Unhealthy)
42 (Unhealthy for Sensitive Groups)
43 (Unhealthy for Sensitive Groups)
41 (Unhealthy for Sensitive Groups)
co
954 (Good)
849 (Good)
676 (Good)
656 (Good)
821 (Good)
815 (Good)
520 (Good)
718 (Good)
635 (Good)
652 (Good)
645 (Good)
531 (Good)
461 (Good)
687 (Good)
763 (Good)
795 (Good)
937 (Good)
836 (Good)
843 (Good)
777 (Good)
no2
27 (Good)
31 (Good)
31 (Good)
22 (Good)
34 (Good)
50 (Moderate)
39 (Good)
40 (Good)
25 (Good)
23 (Good)
29 (Good)
26 (Good)
34 (Good)
41 (Moderate)
51 (Moderate)
31 (Good)
57 (Moderate)
53 (Moderate)
57 (Moderate)
48 (Moderate)
o3
165 (Unhealthy)
172 (Unhealthy)
136 (Unhealthy for Sensitive Groups)
104 (Moderate)
85 (Moderate)
89 (Moderate)
113 (Moderate)
132 (Unhealthy for Sensitive Groups)
153 (Unhealthy)
167 (Unhealthy)
179 (Unhealthy)
176 (Unhealthy)
158 (Unhealthy)
143 (Unhealthy for Sensitive Groups)
117 (Moderate)
97 (Moderate)
90 (Moderate)
81 (Moderate)
108 (Moderate)
140 (Unhealthy for Sensitive Groups)
pm10
50 (Moderate)
56 (Unhealthy for Sensitive Groups)
41 (Moderate)
38 (Moderate)
64 (Unhealthy for Sensitive Groups)
68 (Unhealthy for Sensitive Groups)
60 (Unhealthy for Sensitive Groups)
55 (Unhealthy for Sensitive Groups)
31 (Moderate)
32 (Moderate)
30 (Moderate)
30 (Moderate)
49 (Moderate)
46 (Moderate)
81 (Unhealthy)
71 (Unhealthy for Sensitive Groups)
83 (Unhealthy)
69 (Unhealthy for Sensitive Groups)
72 (Unhealthy for Sensitive Groups)
71 (Unhealthy for Sensitive Groups)
so2
9.8 (Good)
11 (Good)
9.7 (Good)
7.3 (Good)
8.9 (Good)
13 (Good)
11 (Good)
13 (Good)
13 (Good)
11 (Good)
11 (Good)
11 (Good)
7.9 (Good)
8 (Good)
11 (Good)
7.4 (Good)
13 (Good)
14 (Good)
11 (Good)
11 (Good)
data source »
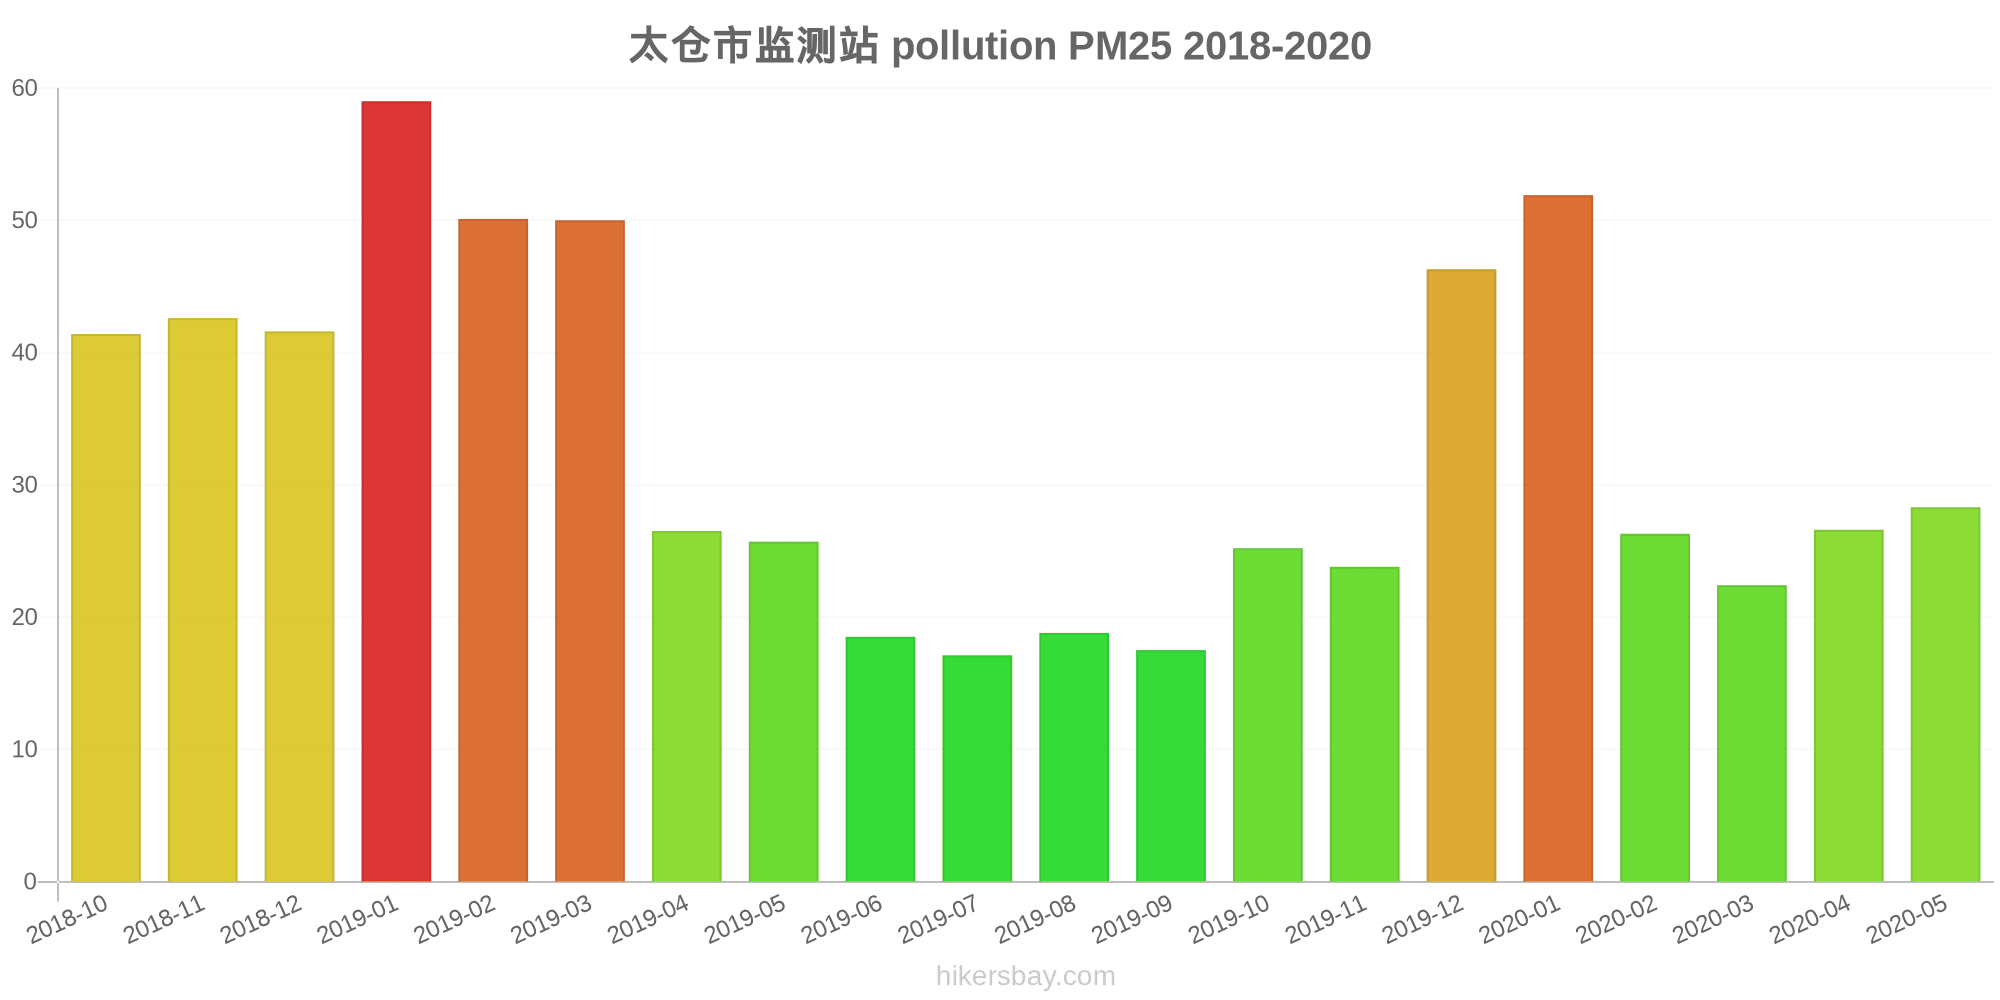
太仓市监测站
Friday, May 27, 2022, 12:00 PM
PM10 179 (Very bad Hazardous)
particulate matter (PM10) suspended dust
PM2,5 35 (Unhealthy for Sensitive Groups)
particulate matter (PM2.5) dust
O3 0.04 (Good)
ozone (O3)
NO2 0 (Good)
nitrogen dioxide (NO2)
SO2 0 (Good)
sulfur dioxide (SO2)
太仓市监测站
index
2022-05-27
pm10
56
pm25
56
o3
0.03
no2
0
so2
0
太仓市监测站
2018-10 2020-05

index
2020-05
2020-04
2020-03
2020-02
2020-01
2019-12
2019-11
2019-10
2019-09
2019-08
2019-07
2019-06
2019-05
2019-04
2019-03
2019-02
2019-01
2018-12
2018-11
2018-10
pm25
28
27
22
26
52
46
24
25
18
19
17
19
26
27
50
50
59
42
43
41
co
954
849
676
656
821
815
520
718
635
652
645
531
461
687
763
795
937
836
843
777
no2
27
31
31
22
34
50
39
40
25
23
29
26
34
41
51
31
57
53
57
48
o3
165
172
136
104
85
89
113
132
153
167
179
176
158
143
117
97
90
81
108
140
pm10
50
56
41
38
64
68
60
55
31
32
30
30
49
46
81
71
83
69
72
71
so2
9.8
11
9.7
7.3
8.9
13
11
13
13
11
11
11
7.9
8
11
7.4
13
14
11
11
* Pollution data source:
https://openaq.org
(ChinaAQIData)
The data is licensed under CC-By 4.0
PM10 179 (Very bad Hazardous)
PM2,5 35 (Unhealthy for Sensitive Groups)
O3 0 (Good)
NO2 0 (Good)
SO2 0 (Good)
Data on air pollution from recent days in Xinzhuang
| index | 2022-05-27 |
|---|---|
| pm10 | 56 Unhealthy for Sensitive Groups |
| pm25 | 56 Unhealthy |
| o3 | 0 Good |
| no2 | 0 Good |
| so2 | 0 Good |

| index | 2020-05 | 2020-04 | 2020-03 | 2020-02 | 2020-01 | 2019-12 | 2019-11 | 2019-10 | 2019-09 | 2019-08 | 2019-07 | 2019-06 | 2019-05 | 2019-04 | 2019-03 | 2019-02 | 2019-01 | 2018-12 | 2018-11 | 2018-10 |
|---|---|---|---|---|---|---|---|---|---|---|---|---|---|---|---|---|---|---|---|---|
| pm25 | 28 (Moderate) | 27 (Moderate) | 22 (Moderate) | 26 (Moderate) | 52 (Unhealthy for Sensitive Groups) | 46 (Unhealthy for Sensitive Groups) | 24 (Moderate) | 25 (Moderate) | 18 (Moderate) | 19 (Moderate) | 17 (Moderate) | 19 (Moderate) | 26 (Moderate) | 27 (Moderate) | 50 (Unhealthy for Sensitive Groups) | 50 (Unhealthy for Sensitive Groups) | 59 (Unhealthy) | 42 (Unhealthy for Sensitive Groups) | 43 (Unhealthy for Sensitive Groups) | 41 (Unhealthy for Sensitive Groups) |
| co | 954 (Good) | 849 (Good) | 676 (Good) | 656 (Good) | 821 (Good) | 815 (Good) | 520 (Good) | 718 (Good) | 635 (Good) | 652 (Good) | 645 (Good) | 531 (Good) | 461 (Good) | 687 (Good) | 763 (Good) | 795 (Good) | 937 (Good) | 836 (Good) | 843 (Good) | 777 (Good) |
| no2 | 27 (Good) | 31 (Good) | 31 (Good) | 22 (Good) | 34 (Good) | 50 (Moderate) | 39 (Good) | 40 (Good) | 25 (Good) | 23 (Good) | 29 (Good) | 26 (Good) | 34 (Good) | 41 (Moderate) | 51 (Moderate) | 31 (Good) | 57 (Moderate) | 53 (Moderate) | 57 (Moderate) | 48 (Moderate) |
| o3 | 165 (Unhealthy) | 172 (Unhealthy) | 136 (Unhealthy for Sensitive Groups) | 104 (Moderate) | 85 (Moderate) | 89 (Moderate) | 113 (Moderate) | 132 (Unhealthy for Sensitive Groups) | 153 (Unhealthy) | 167 (Unhealthy) | 179 (Unhealthy) | 176 (Unhealthy) | 158 (Unhealthy) | 143 (Unhealthy for Sensitive Groups) | 117 (Moderate) | 97 (Moderate) | 90 (Moderate) | 81 (Moderate) | 108 (Moderate) | 140 (Unhealthy for Sensitive Groups) |
| pm10 | 50 (Moderate) | 56 (Unhealthy for Sensitive Groups) | 41 (Moderate) | 38 (Moderate) | 64 (Unhealthy for Sensitive Groups) | 68 (Unhealthy for Sensitive Groups) | 60 (Unhealthy for Sensitive Groups) | 55 (Unhealthy for Sensitive Groups) | 31 (Moderate) | 32 (Moderate) | 30 (Moderate) | 30 (Moderate) | 49 (Moderate) | 46 (Moderate) | 81 (Unhealthy) | 71 (Unhealthy for Sensitive Groups) | 83 (Unhealthy) | 69 (Unhealthy for Sensitive Groups) | 72 (Unhealthy for Sensitive Groups) | 71 (Unhealthy for Sensitive Groups) |
| so2 | 9.8 (Good) | 11 (Good) | 9.7 (Good) | 7.3 (Good) | 8.9 (Good) | 13 (Good) | 11 (Good) | 13 (Good) | 13 (Good) | 11 (Good) | 11 (Good) | 11 (Good) | 7.9 (Good) | 8 (Good) | 11 (Good) | 7.4 (Good) | 13 (Good) | 14 (Good) | 11 (Good) | 11 (Good) |
PM10 179 (Very bad Hazardous)
particulate matter (PM10) suspended dustPM2,5 35 (Unhealthy for Sensitive Groups)
particulate matter (PM2.5) dustO3 0.04 (Good)
ozone (O3)NO2 0 (Good)
nitrogen dioxide (NO2)SO2 0 (Good)
sulfur dioxide (SO2)太仓市监测站
| index | 2022-05-27 |
|---|---|
| pm10 | 56 |
| pm25 | 56 |
| o3 | 0.03 |
| no2 | 0 |
| so2 | 0 |
太仓市监测站
| index | 2020-05 | 2020-04 | 2020-03 | 2020-02 | 2020-01 | 2019-12 | 2019-11 | 2019-10 | 2019-09 | 2019-08 | 2019-07 | 2019-06 | 2019-05 | 2019-04 | 2019-03 | 2019-02 | 2019-01 | 2018-12 | 2018-11 | 2018-10 |
|---|---|---|---|---|---|---|---|---|---|---|---|---|---|---|---|---|---|---|---|---|
| pm25 | 28 | 27 | 22 | 26 | 52 | 46 | 24 | 25 | 18 | 19 | 17 | 19 | 26 | 27 | 50 | 50 | 59 | 42 | 43 | 41 |
| co | 954 | 849 | 676 | 656 | 821 | 815 | 520 | 718 | 635 | 652 | 645 | 531 | 461 | 687 | 763 | 795 | 937 | 836 | 843 | 777 |
| no2 | 27 | 31 | 31 | 22 | 34 | 50 | 39 | 40 | 25 | 23 | 29 | 26 | 34 | 41 | 51 | 31 | 57 | 53 | 57 | 48 |
| o3 | 165 | 172 | 136 | 104 | 85 | 89 | 113 | 132 | 153 | 167 | 179 | 176 | 158 | 143 | 117 | 97 | 90 | 81 | 108 | 140 |
| pm10 | 50 | 56 | 41 | 38 | 64 | 68 | 60 | 55 | 31 | 32 | 30 | 30 | 49 | 46 | 81 | 71 | 83 | 69 | 72 | 71 |
| so2 | 9.8 | 11 | 9.7 | 7.3 | 8.9 | 13 | 11 | 13 | 13 | 11 | 11 | 11 | 7.9 | 8 | 11 | 7.4 | 13 | 14 | 11 | 11 |