Air Pollution in Tuanchengshan: Real-time Air Quality Index and smog alert.
Pollution and air quality forecast for Tuanchengshan. Today is Tuesday, June 2, 2026. The following air pollution values have been recorded for Tuanchengshan:- particulate matter (PM10) suspended dust - 179 (Very bad Hazardous)
- particulate matter (PM2.5) dust - 35 (Unhealthy for Sensitive Groups)
- ozone (O3) - 0 (Good)
- nitrogen dioxide (NO2) - 0 (Good)
- sulfur dioxide (SO2) - 0 (Good)

What is the air quality in Tuanchengshan today? Is the air polluted in Tuanchengshan?. Is there smog?
What is the level of PM10 today in Tuanchengshan? (particulate matter (PM10) suspended dust)
The current level of particulate matter PM10 in Tuanchengshan is:
179 (Very bad Hazardous)
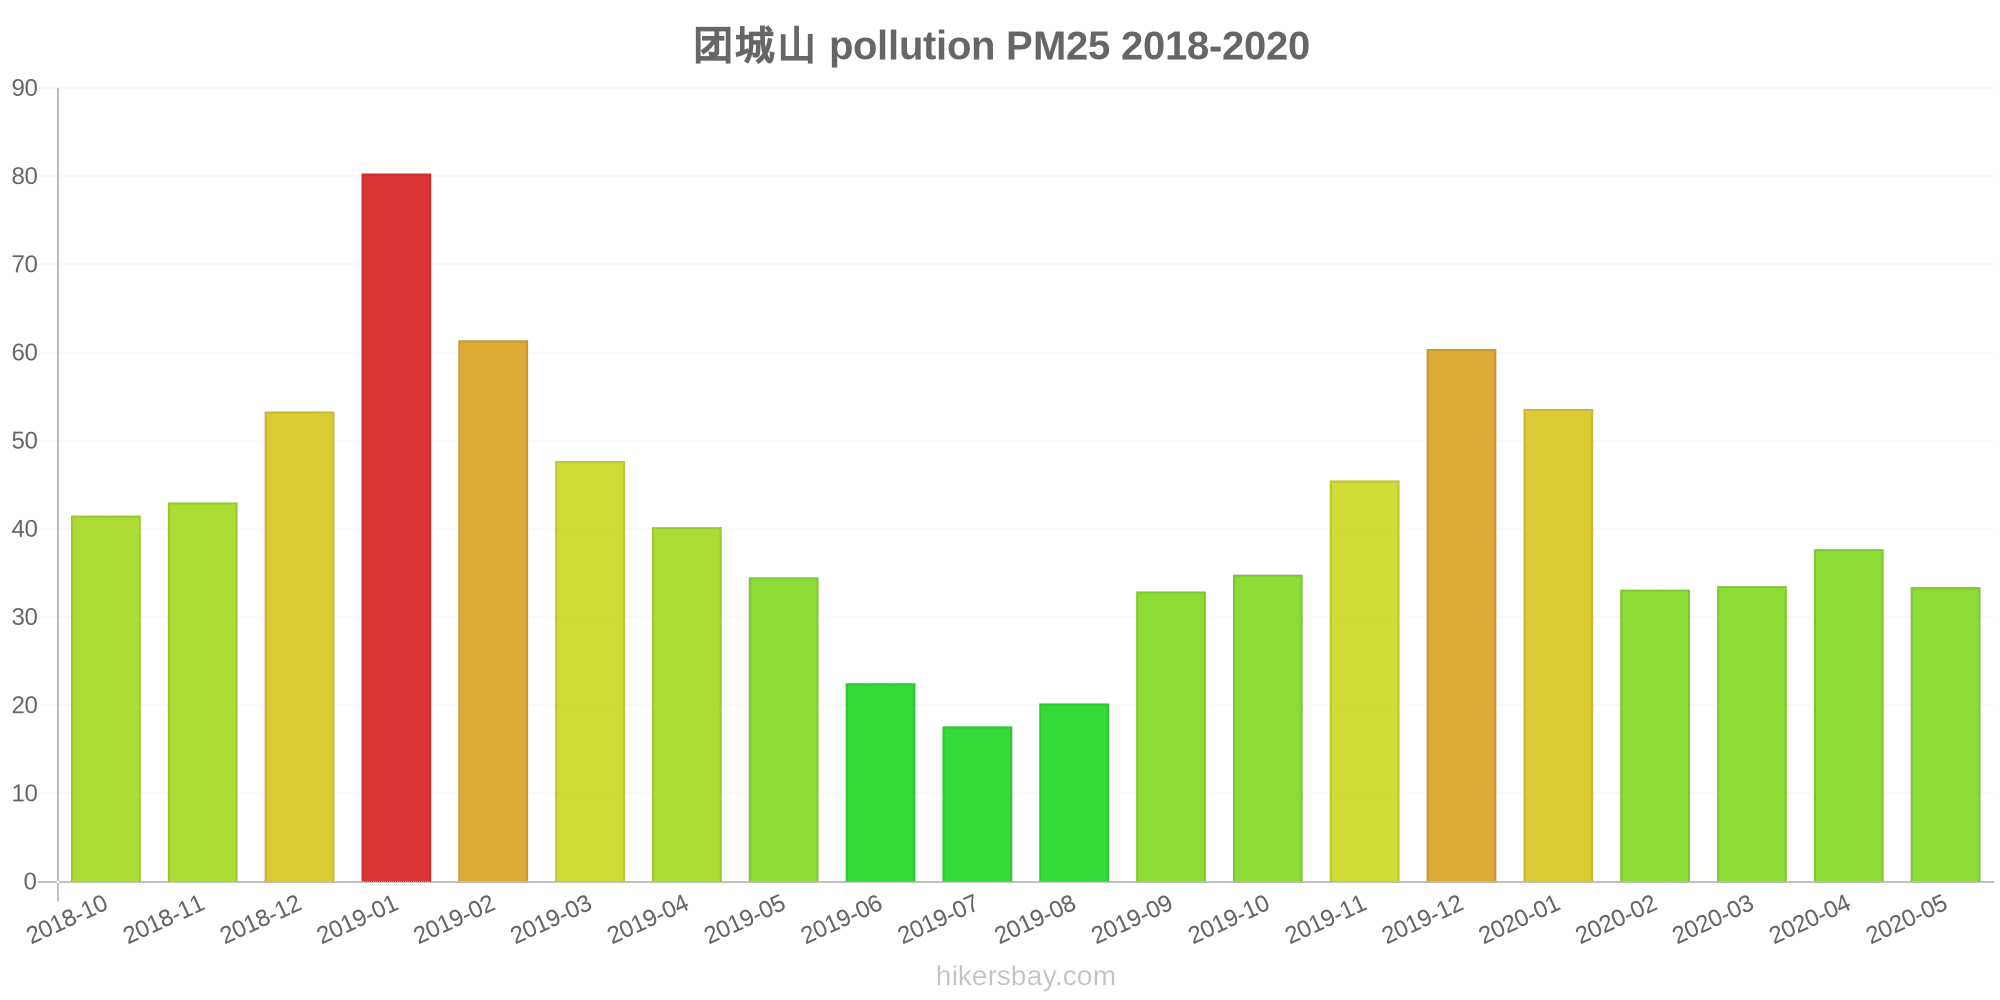
The highest PM10 values usually occur in month: 122 (January 2019).
The lowest value of particulate matter PM10 pollution in Tuanchengshan is usually recorded in: July (42).
What is the current level of PM2.5 in Tuanchengshan? (particulate matter (PM2.5) dust)
Today's PM2.5 level is:
35 (Unhealthy for Sensitive Groups)
For comparison, the highest level of PM2.5 in Tuanchengshan in the last 7 days was: 56 (Friday, May 27, 2022) and the lowest: 56 (Friday, May 27, 2022).
The highest PM2.5 values were recorded: 80 (January 2019).
The lowest level of particulate matter PM2.5 pollution occurs in month: July (18).
How is the O3 level today in Tuanchengshan? (ozone (O3))
0 (Good)
How high is the level of NO2? (nitrogen dioxide (NO2))
0 (Good)
What is the level of SO2 pollution? (sulfur dioxide (SO2))
0 (Good)
Current data Friday, May 27, 2022, 12:00 PM
PM10 179 (Very bad Hazardous)
PM2,5 35 (Unhealthy for Sensitive Groups)
O3 0 (Good)
NO2 0 (Good)
SO2 0 (Good)
Data on air pollution from recent days in Tuanchengshan
index
2022-05-27
pm10
56
Unhealthy for Sensitive Groups
pm25
56
Unhealthy
o3
0
Good
no2
0
Good
so2
0
Good
data source »
Air pollution in Tuanchengshan from October 2018 to May 2020
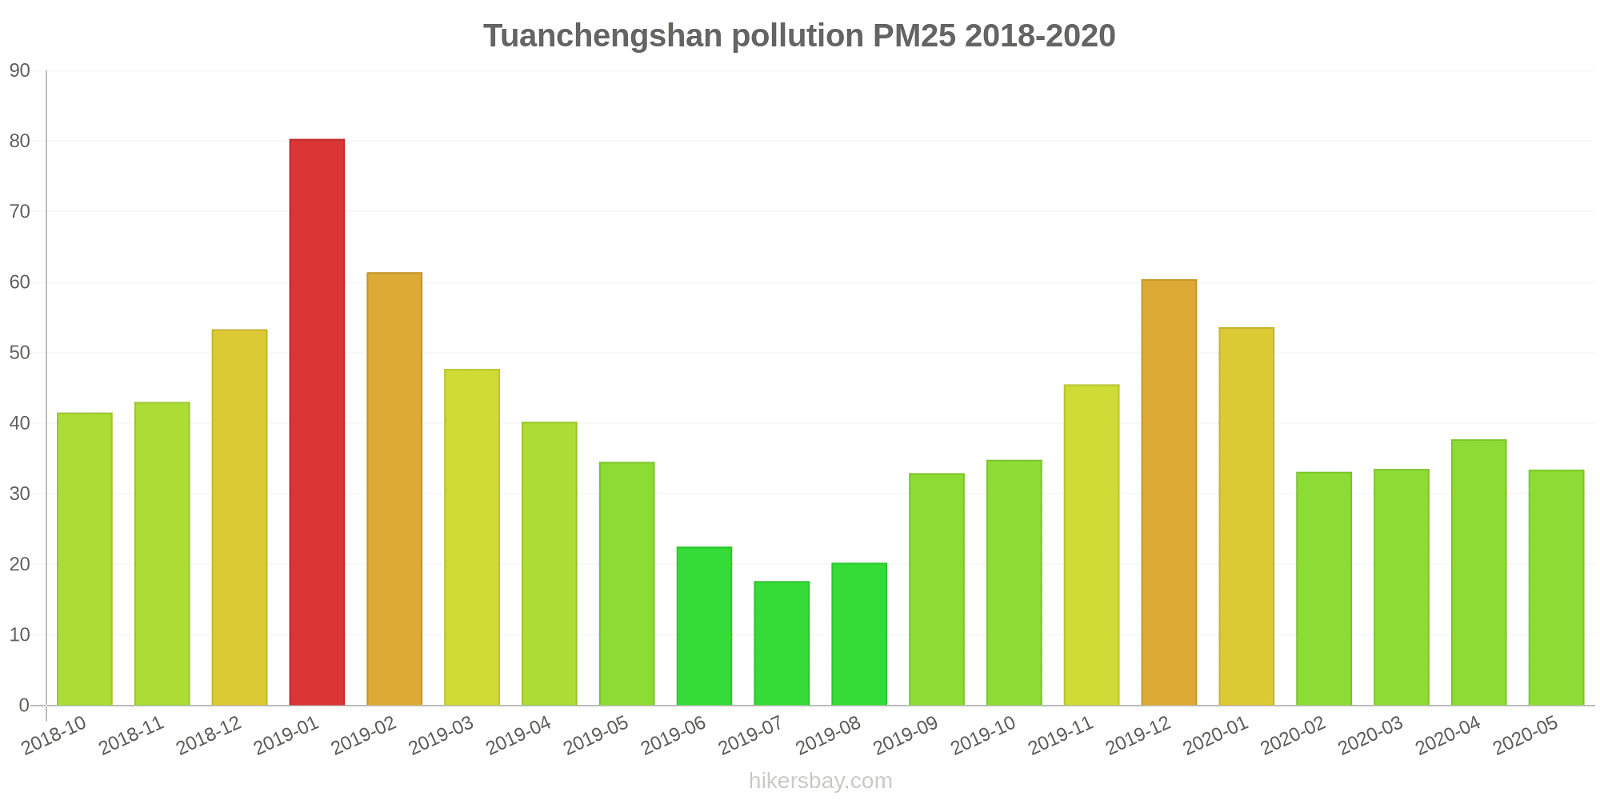
index
2020-05
2020-04
2020-03
2020-02
2020-01
2019-12
2019-11
2019-10
2019-09
2019-08
2019-07
2019-06
2019-05
2019-04
2019-03
2019-02
2019-01
2018-12
2018-11
2018-10
pm25
33 (Moderate)
38 (Unhealthy for Sensitive Groups)
34 (Moderate)
33 (Moderate)
54 (Unhealthy for Sensitive Groups)
60 (Unhealthy)
46 (Unhealthy for Sensitive Groups)
35 (Moderate)
33 (Moderate)
20 (Moderate)
18 (Moderate)
23 (Moderate)
35 (Moderate)
40 (Unhealthy for Sensitive Groups)
48 (Unhealthy for Sensitive Groups)
61 (Unhealthy)
80 (Very Unhealthy)
53 (Unhealthy for Sensitive Groups)
43 (Unhealthy for Sensitive Groups)
42 (Unhealthy for Sensitive Groups)
co
1 (Good)
981 (Good)
1 (Good)
1 (Good)
1 (Good)
1 (Good)
1 (Good)
968 (Good)
929 (Good)
994 (Good)
1 (Good)
1 (Good)
1 (Good)
1 (Good)
1 (Good)
1 (Good)
1 (Good)
1 (Good)
979 (Good)
1 (Good)
no2
24 (Good)
33 (Good)
22 (Good)
19 (Good)
36 (Good)
51 (Moderate)
39 (Good)
33 (Good)
25 (Good)
20 (Good)
22 (Good)
26 (Good)
32 (Good)
33 (Good)
37 (Good)
27 (Good)
40 (Moderate)
39 (Good)
41 (Moderate)
47 (Moderate)
o3
143 (Unhealthy for Sensitive Groups)
137 (Unhealthy for Sensitive Groups)
101 (Moderate)
91 (Moderate)
51 (Good)
64 (Good)
96 (Moderate)
120 (Unhealthy for Sensitive Groups)
185 (Very Unhealthy)
178 (Unhealthy)
143 (Unhealthy for Sensitive Groups)
170 (Unhealthy)
151 (Unhealthy)
121 (Unhealthy for Sensitive Groups)
112 (Moderate)
56 (Good)
57 (Good)
44 (Good)
81 (Moderate)
112 (Moderate)
pm10
67 (Unhealthy for Sensitive Groups)
71 (Unhealthy for Sensitive Groups)
64 (Unhealthy for Sensitive Groups)
56 (Unhealthy for Sensitive Groups)
76 (Unhealthy for Sensitive Groups)
98 (Unhealthy)
97 (Unhealthy)
68 (Unhealthy for Sensitive Groups)
61 (Unhealthy for Sensitive Groups)
44 (Moderate)
42 (Moderate)
51 (Unhealthy for Sensitive Groups)
88 (Unhealthy)
71 (Unhealthy for Sensitive Groups)
77 (Unhealthy for Sensitive Groups)
81 (Unhealthy)
122 (Very Unhealthy)
78 (Unhealthy for Sensitive Groups)
67 (Unhealthy for Sensitive Groups)
72 (Unhealthy for Sensitive Groups)
so2
24 (Good)
22 (Good)
14 (Good)
18 (Good)
10 (Good)
19 (Good)
18 (Good)
14 (Good)
13 (Good)
13 (Good)
14 (Good)
12 (Good)
12 (Good)
16 (Good)
9.6 (Good)
7.5 (Good)
13 (Good)
10 (Good)
10 (Good)
15 (Good)
data source »
团城山
Friday, May 27, 2022, 12:00 PM
PM10 179 (Very bad Hazardous)
particulate matter (PM10) suspended dust
PM2,5 35 (Unhealthy for Sensitive Groups)
particulate matter (PM2.5) dust
O3 0.04 (Good)
ozone (O3)
NO2 0 (Good)
nitrogen dioxide (NO2)
SO2 0 (Good)
sulfur dioxide (SO2)
团城山
index
2022-05-27
pm10
56
pm25
56
o3
0.03
no2
0
so2
0
团城山
2018-10 2020-05

index
2020-05
2020-04
2020-03
2020-02
2020-01
2019-12
2019-11
2019-10
2019-09
2019-08
2019-07
2019-06
2019-05
2019-04
2019-03
2019-02
2019-01
2018-12
2018-11
2018-10
pm25
33
38
34
33
54
60
46
35
33
20
18
23
35
40
48
61
80
53
43
42
co
1
981
1
1
1
1
1
968
929
994
1
1
1
1
1
1
1
1
979
1
no2
24
33
22
19
36
51
39
33
25
20
22
26
32
33
37
27
40
39
41
47
o3
143
137
101
91
51
64
96
120
185
178
143
170
151
121
112
56
57
44
81
112
pm10
67
71
64
56
76
98
97
68
61
44
42
51
88
71
77
81
122
78
67
72
so2
24
22
14
18
10
19
18
14
13
13
14
12
12
16
9.6
7.5
13
10
10
15
* Pollution data source:
https://openaq.org
(ChinaAQIData)
The data is licensed under CC-By 4.0
PM10 179 (Very bad Hazardous)
PM2,5 35 (Unhealthy for Sensitive Groups)
O3 0 (Good)
NO2 0 (Good)
SO2 0 (Good)
Data on air pollution from recent days in Tuanchengshan
| index | 2022-05-27 |
|---|---|
| pm10 | 56 Unhealthy for Sensitive Groups |
| pm25 | 56 Unhealthy |
| o3 | 0 Good |
| no2 | 0 Good |
| so2 | 0 Good |

| index | 2020-05 | 2020-04 | 2020-03 | 2020-02 | 2020-01 | 2019-12 | 2019-11 | 2019-10 | 2019-09 | 2019-08 | 2019-07 | 2019-06 | 2019-05 | 2019-04 | 2019-03 | 2019-02 | 2019-01 | 2018-12 | 2018-11 | 2018-10 |
|---|---|---|---|---|---|---|---|---|---|---|---|---|---|---|---|---|---|---|---|---|
| pm25 | 33 (Moderate) | 38 (Unhealthy for Sensitive Groups) | 34 (Moderate) | 33 (Moderate) | 54 (Unhealthy for Sensitive Groups) | 60 (Unhealthy) | 46 (Unhealthy for Sensitive Groups) | 35 (Moderate) | 33 (Moderate) | 20 (Moderate) | 18 (Moderate) | 23 (Moderate) | 35 (Moderate) | 40 (Unhealthy for Sensitive Groups) | 48 (Unhealthy for Sensitive Groups) | 61 (Unhealthy) | 80 (Very Unhealthy) | 53 (Unhealthy for Sensitive Groups) | 43 (Unhealthy for Sensitive Groups) | 42 (Unhealthy for Sensitive Groups) |
| co | 1 (Good) | 981 (Good) | 1 (Good) | 1 (Good) | 1 (Good) | 1 (Good) | 1 (Good) | 968 (Good) | 929 (Good) | 994 (Good) | 1 (Good) | 1 (Good) | 1 (Good) | 1 (Good) | 1 (Good) | 1 (Good) | 1 (Good) | 1 (Good) | 979 (Good) | 1 (Good) |
| no2 | 24 (Good) | 33 (Good) | 22 (Good) | 19 (Good) | 36 (Good) | 51 (Moderate) | 39 (Good) | 33 (Good) | 25 (Good) | 20 (Good) | 22 (Good) | 26 (Good) | 32 (Good) | 33 (Good) | 37 (Good) | 27 (Good) | 40 (Moderate) | 39 (Good) | 41 (Moderate) | 47 (Moderate) |
| o3 | 143 (Unhealthy for Sensitive Groups) | 137 (Unhealthy for Sensitive Groups) | 101 (Moderate) | 91 (Moderate) | 51 (Good) | 64 (Good) | 96 (Moderate) | 120 (Unhealthy for Sensitive Groups) | 185 (Very Unhealthy) | 178 (Unhealthy) | 143 (Unhealthy for Sensitive Groups) | 170 (Unhealthy) | 151 (Unhealthy) | 121 (Unhealthy for Sensitive Groups) | 112 (Moderate) | 56 (Good) | 57 (Good) | 44 (Good) | 81 (Moderate) | 112 (Moderate) |
| pm10 | 67 (Unhealthy for Sensitive Groups) | 71 (Unhealthy for Sensitive Groups) | 64 (Unhealthy for Sensitive Groups) | 56 (Unhealthy for Sensitive Groups) | 76 (Unhealthy for Sensitive Groups) | 98 (Unhealthy) | 97 (Unhealthy) | 68 (Unhealthy for Sensitive Groups) | 61 (Unhealthy for Sensitive Groups) | 44 (Moderate) | 42 (Moderate) | 51 (Unhealthy for Sensitive Groups) | 88 (Unhealthy) | 71 (Unhealthy for Sensitive Groups) | 77 (Unhealthy for Sensitive Groups) | 81 (Unhealthy) | 122 (Very Unhealthy) | 78 (Unhealthy for Sensitive Groups) | 67 (Unhealthy for Sensitive Groups) | 72 (Unhealthy for Sensitive Groups) |
| so2 | 24 (Good) | 22 (Good) | 14 (Good) | 18 (Good) | 10 (Good) | 19 (Good) | 18 (Good) | 14 (Good) | 13 (Good) | 13 (Good) | 14 (Good) | 12 (Good) | 12 (Good) | 16 (Good) | 9.6 (Good) | 7.5 (Good) | 13 (Good) | 10 (Good) | 10 (Good) | 15 (Good) |
PM10 179 (Very bad Hazardous)
particulate matter (PM10) suspended dustPM2,5 35 (Unhealthy for Sensitive Groups)
particulate matter (PM2.5) dustO3 0.04 (Good)
ozone (O3)NO2 0 (Good)
nitrogen dioxide (NO2)SO2 0 (Good)
sulfur dioxide (SO2)团城山
| index | 2022-05-27 |
|---|---|
| pm10 | 56 |
| pm25 | 56 |
| o3 | 0.03 |
| no2 | 0 |
| so2 | 0 |
团城山
| index | 2020-05 | 2020-04 | 2020-03 | 2020-02 | 2020-01 | 2019-12 | 2019-11 | 2019-10 | 2019-09 | 2019-08 | 2019-07 | 2019-06 | 2019-05 | 2019-04 | 2019-03 | 2019-02 | 2019-01 | 2018-12 | 2018-11 | 2018-10 |
|---|---|---|---|---|---|---|---|---|---|---|---|---|---|---|---|---|---|---|---|---|
| pm25 | 33 | 38 | 34 | 33 | 54 | 60 | 46 | 35 | 33 | 20 | 18 | 23 | 35 | 40 | 48 | 61 | 80 | 53 | 43 | 42 |
| co | 1 | 981 | 1 | 1 | 1 | 1 | 1 | 968 | 929 | 994 | 1 | 1 | 1 | 1 | 1 | 1 | 1 | 1 | 979 | 1 |
| no2 | 24 | 33 | 22 | 19 | 36 | 51 | 39 | 33 | 25 | 20 | 22 | 26 | 32 | 33 | 37 | 27 | 40 | 39 | 41 | 47 |
| o3 | 143 | 137 | 101 | 91 | 51 | 64 | 96 | 120 | 185 | 178 | 143 | 170 | 151 | 121 | 112 | 56 | 57 | 44 | 81 | 112 |
| pm10 | 67 | 71 | 64 | 56 | 76 | 98 | 97 | 68 | 61 | 44 | 42 | 51 | 88 | 71 | 77 | 81 | 122 | 78 | 67 | 72 |
| so2 | 24 | 22 | 14 | 18 | 10 | 19 | 18 | 14 | 13 | 13 | 14 | 12 | 12 | 16 | 9.6 | 7.5 | 13 | 10 | 10 | 15 |