Air Pollution in Lishihai: Real-time Air Quality Index and smog alert.
Pollution and air quality forecast for Lishihai. Today is Tuesday, June 2, 2026. The following air pollution values have been recorded for Lishihai:- particulate matter (PM10) suspended dust - 179 (Very bad Hazardous)
- particulate matter (PM2.5) dust - 35 (Unhealthy for Sensitive Groups)
- ozone (O3) - 0 (Good)
- nitrogen dioxide (NO2) - 0 (Good)
- sulfur dioxide (SO2) - 0 (Good)

What is the air quality in Lishihai today? Is the air polluted in Lishihai?. Is there smog?
What is the level of PM10 today in Lishihai? (particulate matter (PM10) suspended dust)
The current level of particulate matter PM10 in Lishihai is:
179 (Very bad Hazardous)
The highest PM10 values usually occur in month: 109 (January 2019).
The lowest value of particulate matter PM10 pollution in Lishihai is usually recorded in: July (40).
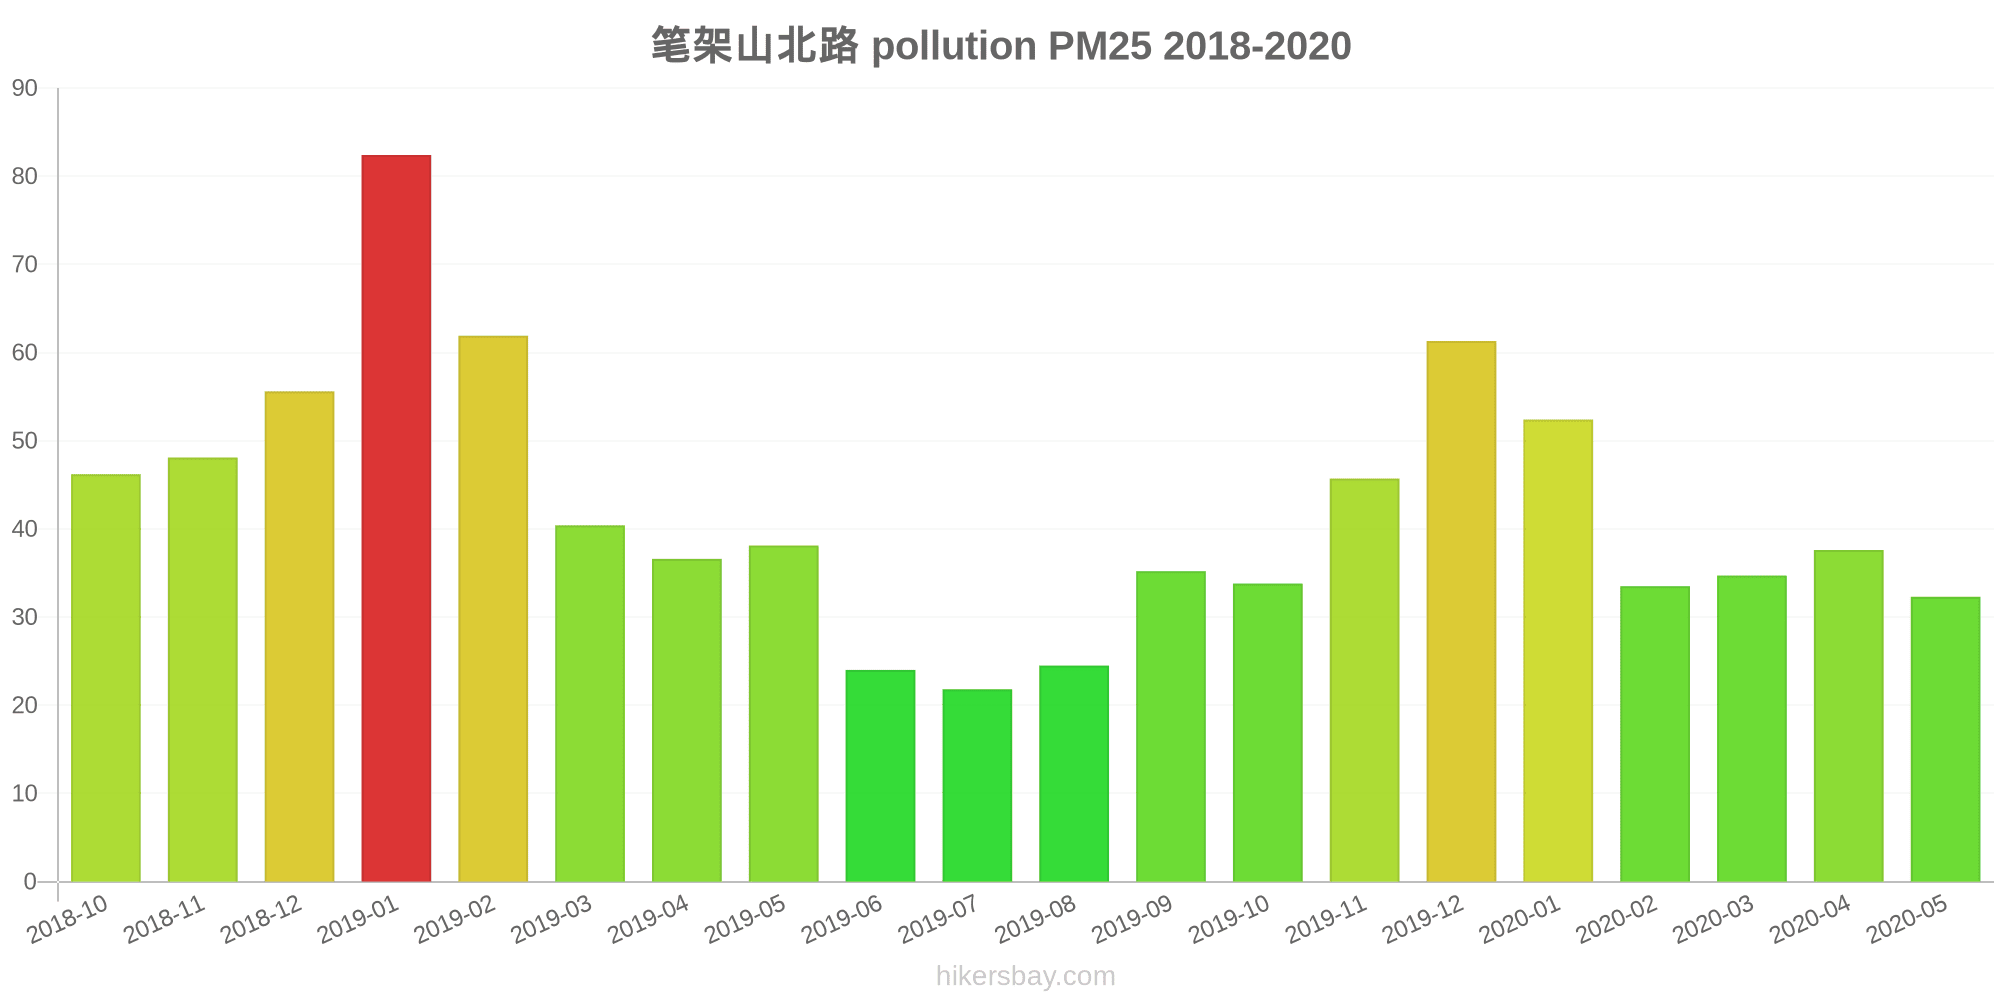
What is the current level of PM2.5 in Lishihai? (particulate matter (PM2.5) dust)
Today's PM2.5 level is:
35 (Unhealthy for Sensitive Groups)
For comparison, the highest level of PM2.5 in Lishihai in the last 7 days was: 56 (Friday, May 27, 2022) and the lowest: 56 (Friday, May 27, 2022).
The highest PM2.5 values were recorded: 82 (January 2019).
The lowest level of particulate matter PM2.5 pollution occurs in month: July (22).
How is the O3 level today in Lishihai? (ozone (O3))
0 (Good)
How high is the level of NO2? (nitrogen dioxide (NO2))
0 (Good)
What is the level of SO2 pollution? (sulfur dioxide (SO2))
0 (Good)
Current data Friday, May 27, 2022, 12:00 PM
PM10 179 (Very bad Hazardous)
PM2,5 35 (Unhealthy for Sensitive Groups)
O3 0 (Good)
NO2 0 (Good)
SO2 0 (Good)
Data on air pollution from recent days in Lishihai
index
2022-05-27
pm10
56
Unhealthy for Sensitive Groups
pm25
56
Unhealthy
o3
0
Good
no2
0
Good
so2
0
Good
data source »
Air pollution in Lishihai from October 2018 to May 2020

index
2020-05
2020-04
2020-03
2020-02
2020-01
2019-12
2019-11
2019-10
2019-09
2019-08
2019-07
2019-06
2019-05
2019-04
2019-03
2019-02
2019-01
2018-12
2018-11
2018-10
o3
136 (Unhealthy for Sensitive Groups)
145 (Unhealthy for Sensitive Groups)
106 (Moderate)
88 (Moderate)
60 (Good)
71 (Moderate)
92 (Moderate)
107 (Moderate)
172 (Unhealthy)
171 (Unhealthy)
135 (Unhealthy for Sensitive Groups)
157 (Unhealthy)
146 (Unhealthy for Sensitive Groups)
111 (Moderate)
109 (Moderate)
55 (Good)
51 (Good)
45 (Good)
89 (Moderate)
119 (Moderate)
pm25
32 (Moderate)
38 (Unhealthy for Sensitive Groups)
35 (Moderate)
34 (Moderate)
52 (Unhealthy for Sensitive Groups)
61 (Unhealthy)
46 (Unhealthy for Sensitive Groups)
34 (Moderate)
35 (Unhealthy for Sensitive Groups)
25 (Moderate)
22 (Moderate)
24 (Moderate)
38 (Unhealthy for Sensitive Groups)
37 (Unhealthy for Sensitive Groups)
40 (Unhealthy for Sensitive Groups)
62 (Unhealthy)
82 (Very Unhealthy)
56 (Unhealthy)
48 (Unhealthy for Sensitive Groups)
46 (Unhealthy for Sensitive Groups)
co
1 (Good)
940 (Good)
1 (Good)
1 (Good)
1 (Good)
1 (Good)
968 (Good)
966 (Good)
889 (Good)
953 (Good)
845 (Good)
812 (Good)
994 (Good)
1 (Good)
1 (Good)
1 (Good)
1 (Good)
1 (Good)
1 (Good)
1 (Good)
no2
23 (Good)
31 (Good)
18 (Good)
17 (Good)
32 (Good)
53 (Moderate)
40 (Moderate)
30 (Good)
25 (Good)
18 (Good)
16 (Good)
17 (Good)
28 (Good)
30 (Good)
32 (Good)
25 (Good)
46 (Moderate)
39 (Good)
37 (Good)
40 (Moderate)
pm10
65 (Unhealthy for Sensitive Groups)
71 (Unhealthy for Sensitive Groups)
56 (Unhealthy for Sensitive Groups)
41 (Moderate)
72 (Unhealthy for Sensitive Groups)
105 (Unhealthy)
86 (Unhealthy)
66 (Unhealthy for Sensitive Groups)
61 (Unhealthy for Sensitive Groups)
45 (Moderate)
40 (Moderate)
43 (Moderate)
70 (Unhealthy for Sensitive Groups)
58 (Unhealthy for Sensitive Groups)
67 (Unhealthy for Sensitive Groups)
74 (Unhealthy for Sensitive Groups)
109 (Unhealthy)
70 (Unhealthy for Sensitive Groups)
64 (Unhealthy for Sensitive Groups)
70 (Unhealthy for Sensitive Groups)
so2
17 (Good)
16 (Good)
15 (Good)
15 (Good)
13 (Good)
18 (Good)
15 (Good)
13 (Good)
13 (Good)
14 (Good)
10 (Good)
12 (Good)
14 (Good)
14 (Good)
11 (Good)
9.5 (Good)
14 (Good)
10 (Good)
11 (Good)
13 (Good)
data source »
笔架山北路
Friday, May 27, 2022, 12:00 PM
PM10 179 (Very bad Hazardous)
particulate matter (PM10) suspended dust
PM2,5 35 (Unhealthy for Sensitive Groups)
particulate matter (PM2.5) dust
O3 0.04 (Good)
ozone (O3)
NO2 0 (Good)
nitrogen dioxide (NO2)
SO2 0 (Good)
sulfur dioxide (SO2)
笔架山北路
index
2022-05-27
pm10
56
pm25
56
o3
0.03
no2
0
so2
0
笔架山北路
2018-10 2020-05

index
2020-05
2020-04
2020-03
2020-02
2020-01
2019-12
2019-11
2019-10
2019-09
2019-08
2019-07
2019-06
2019-05
2019-04
2019-03
2019-02
2019-01
2018-12
2018-11
2018-10
pm25
32
38
35
34
52
61
46
34
35
25
22
24
38
37
40
62
82
56
48
46
co
1
940
1
1
1
1
968
966
889
953
845
812
994
1
1
1
1
1
1
1
no2
23
31
18
17
32
53
40
30
25
18
16
17
28
30
32
25
46
39
37
40
o3
136
145
106
88
60
71
92
107
172
171
135
157
146
111
109
55
51
45
89
119
pm10
65
71
56
41
72
105
86
66
61
45
40
43
70
58
67
74
109
70
64
70
so2
17
16
15
15
13
18
15
13
13
14
10
12
14
14
11
9.5
14
10
11
13
* Pollution data source:
https://openaq.org
(ChinaAQIData)
The data is licensed under CC-By 4.0
PM10 179 (Very bad Hazardous)
PM2,5 35 (Unhealthy for Sensitive Groups)
O3 0 (Good)
NO2 0 (Good)
SO2 0 (Good)
Data on air pollution from recent days in Lishihai
| index | 2022-05-27 |
|---|---|
| pm10 | 56 Unhealthy for Sensitive Groups |
| pm25 | 56 Unhealthy |
| o3 | 0 Good |
| no2 | 0 Good |
| so2 | 0 Good |

| index | 2020-05 | 2020-04 | 2020-03 | 2020-02 | 2020-01 | 2019-12 | 2019-11 | 2019-10 | 2019-09 | 2019-08 | 2019-07 | 2019-06 | 2019-05 | 2019-04 | 2019-03 | 2019-02 | 2019-01 | 2018-12 | 2018-11 | 2018-10 |
|---|---|---|---|---|---|---|---|---|---|---|---|---|---|---|---|---|---|---|---|---|
| o3 | 136 (Unhealthy for Sensitive Groups) | 145 (Unhealthy for Sensitive Groups) | 106 (Moderate) | 88 (Moderate) | 60 (Good) | 71 (Moderate) | 92 (Moderate) | 107 (Moderate) | 172 (Unhealthy) | 171 (Unhealthy) | 135 (Unhealthy for Sensitive Groups) | 157 (Unhealthy) | 146 (Unhealthy for Sensitive Groups) | 111 (Moderate) | 109 (Moderate) | 55 (Good) | 51 (Good) | 45 (Good) | 89 (Moderate) | 119 (Moderate) |
| pm25 | 32 (Moderate) | 38 (Unhealthy for Sensitive Groups) | 35 (Moderate) | 34 (Moderate) | 52 (Unhealthy for Sensitive Groups) | 61 (Unhealthy) | 46 (Unhealthy for Sensitive Groups) | 34 (Moderate) | 35 (Unhealthy for Sensitive Groups) | 25 (Moderate) | 22 (Moderate) | 24 (Moderate) | 38 (Unhealthy for Sensitive Groups) | 37 (Unhealthy for Sensitive Groups) | 40 (Unhealthy for Sensitive Groups) | 62 (Unhealthy) | 82 (Very Unhealthy) | 56 (Unhealthy) | 48 (Unhealthy for Sensitive Groups) | 46 (Unhealthy for Sensitive Groups) |
| co | 1 (Good) | 940 (Good) | 1 (Good) | 1 (Good) | 1 (Good) | 1 (Good) | 968 (Good) | 966 (Good) | 889 (Good) | 953 (Good) | 845 (Good) | 812 (Good) | 994 (Good) | 1 (Good) | 1 (Good) | 1 (Good) | 1 (Good) | 1 (Good) | 1 (Good) | 1 (Good) |
| no2 | 23 (Good) | 31 (Good) | 18 (Good) | 17 (Good) | 32 (Good) | 53 (Moderate) | 40 (Moderate) | 30 (Good) | 25 (Good) | 18 (Good) | 16 (Good) | 17 (Good) | 28 (Good) | 30 (Good) | 32 (Good) | 25 (Good) | 46 (Moderate) | 39 (Good) | 37 (Good) | 40 (Moderate) |
| pm10 | 65 (Unhealthy for Sensitive Groups) | 71 (Unhealthy for Sensitive Groups) | 56 (Unhealthy for Sensitive Groups) | 41 (Moderate) | 72 (Unhealthy for Sensitive Groups) | 105 (Unhealthy) | 86 (Unhealthy) | 66 (Unhealthy for Sensitive Groups) | 61 (Unhealthy for Sensitive Groups) | 45 (Moderate) | 40 (Moderate) | 43 (Moderate) | 70 (Unhealthy for Sensitive Groups) | 58 (Unhealthy for Sensitive Groups) | 67 (Unhealthy for Sensitive Groups) | 74 (Unhealthy for Sensitive Groups) | 109 (Unhealthy) | 70 (Unhealthy for Sensitive Groups) | 64 (Unhealthy for Sensitive Groups) | 70 (Unhealthy for Sensitive Groups) |
| so2 | 17 (Good) | 16 (Good) | 15 (Good) | 15 (Good) | 13 (Good) | 18 (Good) | 15 (Good) | 13 (Good) | 13 (Good) | 14 (Good) | 10 (Good) | 12 (Good) | 14 (Good) | 14 (Good) | 11 (Good) | 9.5 (Good) | 14 (Good) | 10 (Good) | 11 (Good) | 13 (Good) |
PM10 179 (Very bad Hazardous)
particulate matter (PM10) suspended dustPM2,5 35 (Unhealthy for Sensitive Groups)
particulate matter (PM2.5) dustO3 0.04 (Good)
ozone (O3)NO2 0 (Good)
nitrogen dioxide (NO2)SO2 0 (Good)
sulfur dioxide (SO2)笔架山北路
| index | 2022-05-27 |
|---|---|
| pm10 | 56 |
| pm25 | 56 |
| o3 | 0.03 |
| no2 | 0 |
| so2 | 0 |
笔架山北路
| index | 2020-05 | 2020-04 | 2020-03 | 2020-02 | 2020-01 | 2019-12 | 2019-11 | 2019-10 | 2019-09 | 2019-08 | 2019-07 | 2019-06 | 2019-05 | 2019-04 | 2019-03 | 2019-02 | 2019-01 | 2018-12 | 2018-11 | 2018-10 |
|---|---|---|---|---|---|---|---|---|---|---|---|---|---|---|---|---|---|---|---|---|
| pm25 | 32 | 38 | 35 | 34 | 52 | 61 | 46 | 34 | 35 | 25 | 22 | 24 | 38 | 37 | 40 | 62 | 82 | 56 | 48 | 46 |
| co | 1 | 940 | 1 | 1 | 1 | 1 | 968 | 966 | 889 | 953 | 845 | 812 | 994 | 1 | 1 | 1 | 1 | 1 | 1 | 1 |
| no2 | 23 | 31 | 18 | 17 | 32 | 53 | 40 | 30 | 25 | 18 | 16 | 17 | 28 | 30 | 32 | 25 | 46 | 39 | 37 | 40 |
| o3 | 136 | 145 | 106 | 88 | 60 | 71 | 92 | 107 | 172 | 171 | 135 | 157 | 146 | 111 | 109 | 55 | 51 | 45 | 89 | 119 |
| pm10 | 65 | 71 | 56 | 41 | 72 | 105 | 86 | 66 | 61 | 45 | 40 | 43 | 70 | 58 | 67 | 74 | 109 | 70 | 64 | 70 |
| so2 | 17 | 16 | 15 | 15 | 13 | 18 | 15 | 13 | 13 | 14 | 10 | 12 | 14 | 14 | 11 | 9.5 | 14 | 10 | 11 | 13 |