Air Pollution in Lujiaqiao: Real-time Air Quality Index and smog alert.
Pollution and air quality forecast for Lujiaqiao. Today is Tuesday, June 2, 2026. The following air pollution values have been recorded for Lujiaqiao:- particulate matter (PM10) suspended dust - 179 (Very bad Hazardous)
- particulate matter (PM2.5) dust - 35 (Unhealthy for Sensitive Groups)
- ozone (O3) - 0 (Good)
- nitrogen dioxide (NO2) - 0 (Good)
- sulfur dioxide (SO2) - 0 (Good)

What is the air quality in Lujiaqiao today? Is the air polluted in Lujiaqiao?. Is there smog?
What is the level of PM10 today in Lujiaqiao? (particulate matter (PM10) suspended dust)
The current level of particulate matter PM10 in Lujiaqiao is:
179 (Very bad Hazardous)
The highest PM10 values usually occur in month: 99 (January 2019).
The lowest value of particulate matter PM10 pollution in Lujiaqiao is usually recorded in: July (36).
What is the current level of PM2.5 in Lujiaqiao? (particulate matter (PM2.5) dust)
Today's PM2.5 level is:
35 (Unhealthy for Sensitive Groups)
For comparison, the highest level of PM2.5 in Lujiaqiao in the last 7 days was: 56 (Friday, May 27, 2022) and the lowest: 56 (Friday, May 27, 2022).
The highest PM2.5 values were recorded: 84 (January 2019).
The lowest level of particulate matter PM2.5 pollution occurs in month: July (19).
How is the O3 level today in Lujiaqiao? (ozone (O3))
0 (Good)
How high is the level of NO2? (nitrogen dioxide (NO2))
0 (Good)
What is the level of SO2 pollution? (sulfur dioxide (SO2))
0 (Good)
Current data Friday, May 27, 2022, 12:00 PM
PM10 179 (Very bad Hazardous)
PM2,5 35 (Unhealthy for Sensitive Groups)
O3 0 (Good)
NO2 0 (Good)
SO2 0 (Good)
Data on air pollution from recent days in Lujiaqiao
index
2022-05-27
pm10
56
Unhealthy for Sensitive Groups
pm25
56
Unhealthy
o3
0
Good
no2
0
Good
so2
0
Good
data source »
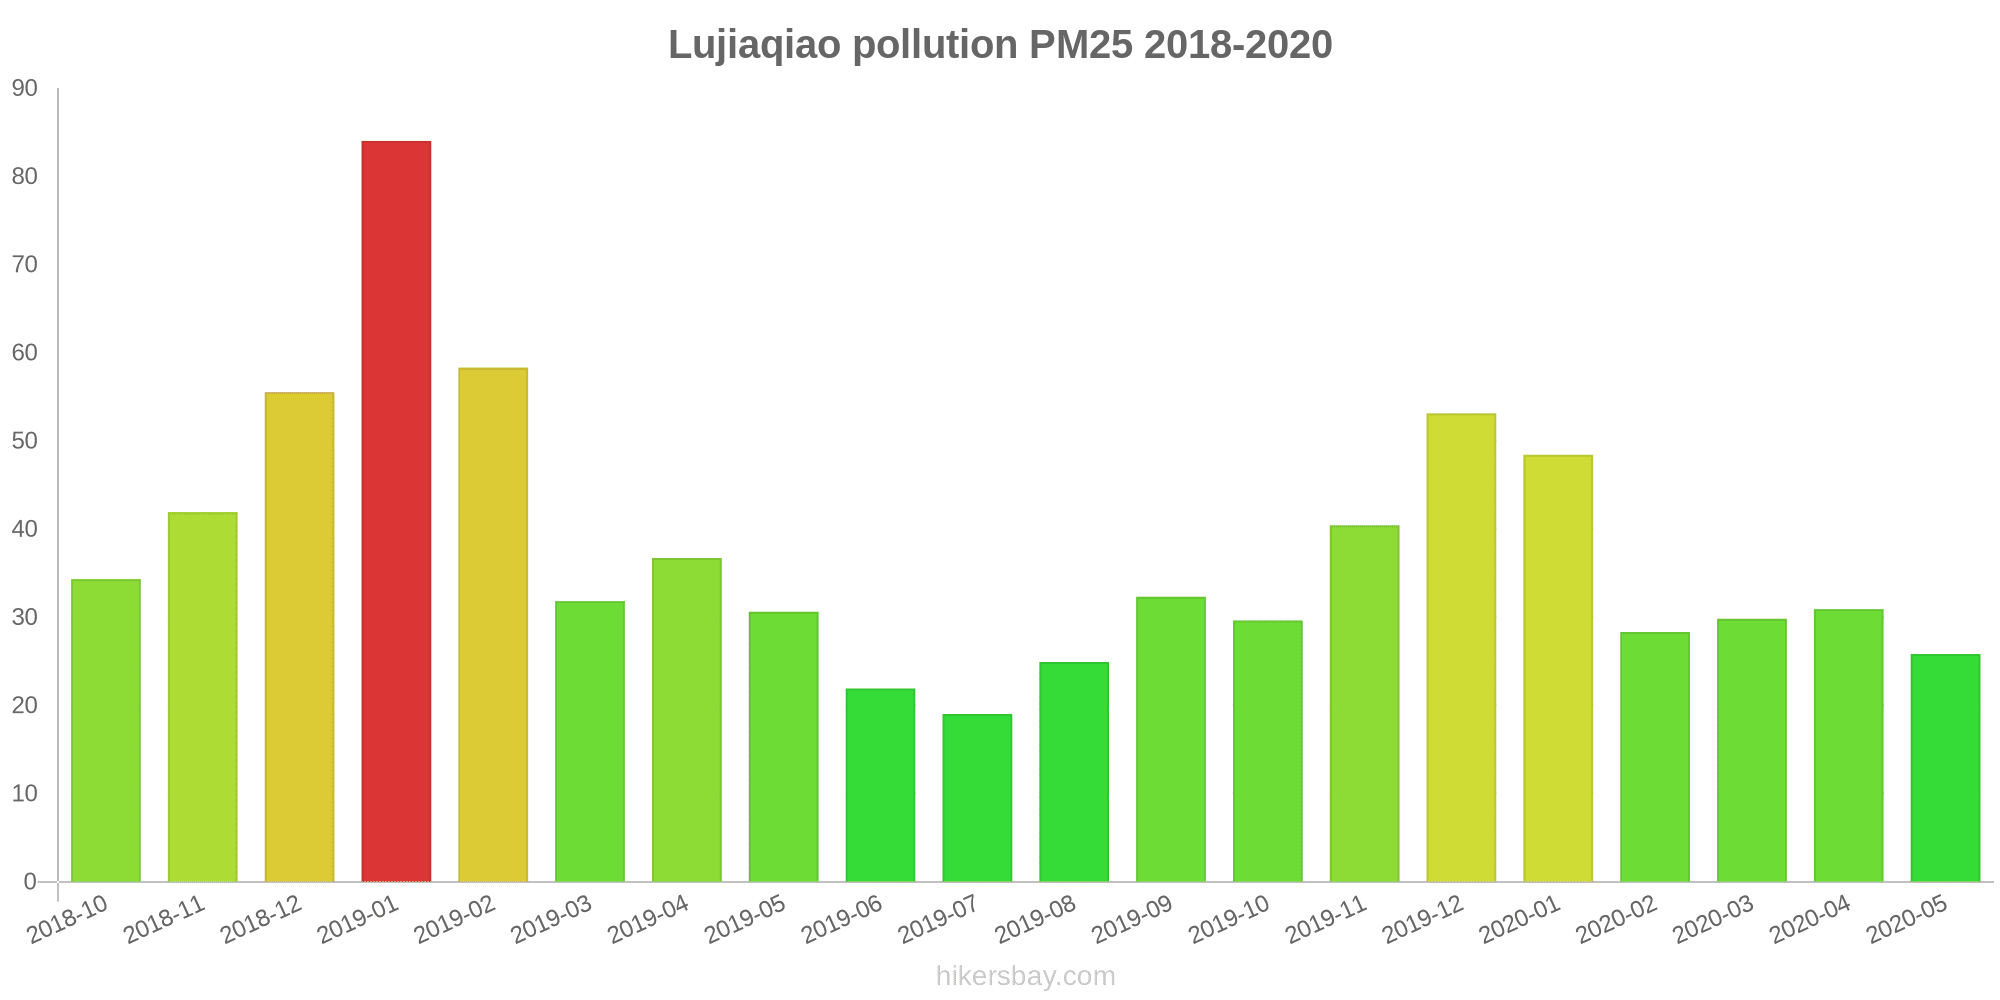
Air pollution in Lujiaqiao from October 2018 to May 2020
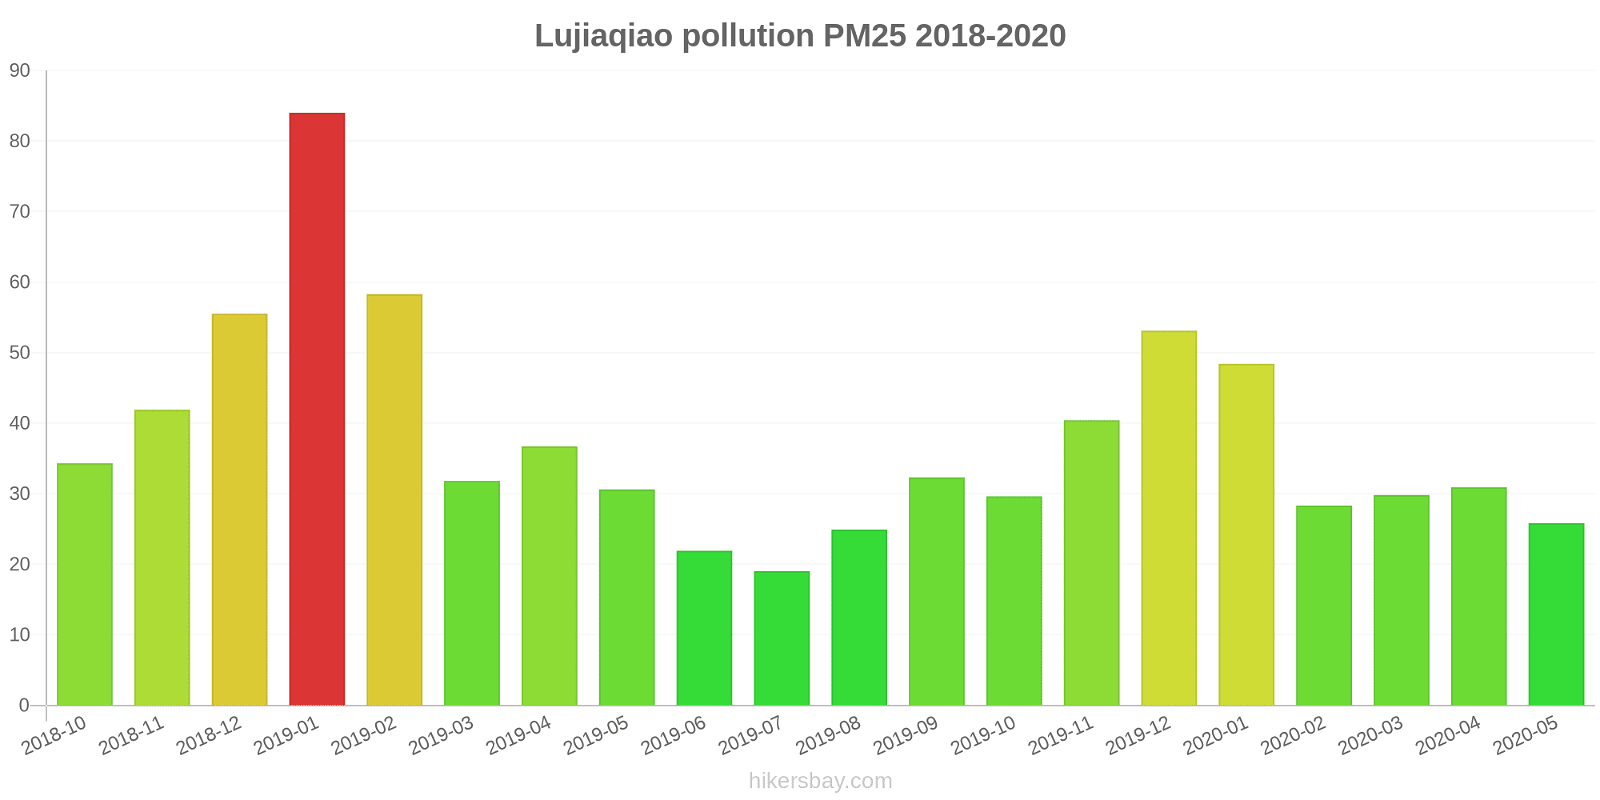
index
2020-05
2020-04
2020-03
2020-02
2020-01
2019-12
2019-11
2019-10
2019-09
2019-08
2019-07
2019-06
2019-05
2019-04
2019-03
2019-02
2019-01
2018-12
2018-11
2018-10
pm25
26 (Moderate)
31 (Moderate)
30 (Moderate)
28 (Moderate)
48 (Unhealthy for Sensitive Groups)
53 (Unhealthy for Sensitive Groups)
40 (Unhealthy for Sensitive Groups)
30 (Moderate)
32 (Moderate)
25 (Moderate)
19 (Moderate)
22 (Moderate)
31 (Moderate)
37 (Unhealthy for Sensitive Groups)
32 (Moderate)
58 (Unhealthy)
84 (Very Unhealthy)
56 (Unhealthy)
42 (Unhealthy for Sensitive Groups)
34 (Moderate)
co
825 (Good)
1 (Good)
886 (Good)
748 (Good)
1 (Good)
1 (Good)
972 (Good)
915 (Good)
938 (Good)
1 (Good)
904 (Good)
720 (Good)
617 (Good)
720 (Good)
616 (Good)
915 (Good)
1 (Good)
1 (Good)
990 (Good)
831 (Good)
no2
13 (Good)
20 (Good)
12 (Good)
7.3 (Good)
22 (Good)
35 (Good)
32 (Good)
23 (Good)
23 (Good)
13 (Good)
8.4 (Good)
9.9 (Good)
18 (Good)
16 (Good)
25 (Good)
23 (Good)
43 (Moderate)
39 (Good)
36 (Good)
35 (Good)
o3
124 (Unhealthy for Sensitive Groups)
134 (Unhealthy for Sensitive Groups)
97 (Moderate)
81 (Moderate)
55 (Good)
74 (Moderate)
104 (Moderate)
120 (Unhealthy for Sensitive Groups)
187 (Very Unhealthy)
167 (Unhealthy)
135 (Unhealthy for Sensitive Groups)
154 (Unhealthy)
134 (Unhealthy for Sensitive Groups)
109 (Moderate)
101 (Moderate)
54 (Good)
50 (Good)
38 (Good)
77 (Moderate)
102 (Moderate)
pm10
54 (Unhealthy for Sensitive Groups)
61 (Unhealthy for Sensitive Groups)
51 (Unhealthy for Sensitive Groups)
37 (Moderate)
54 (Unhealthy for Sensitive Groups)
74 (Unhealthy for Sensitive Groups)
75 (Unhealthy for Sensitive Groups)
56 (Unhealthy for Sensitive Groups)
67 (Unhealthy for Sensitive Groups)
52 (Unhealthy for Sensitive Groups)
36 (Moderate)
37 (Moderate)
63 (Unhealthy for Sensitive Groups)
52 (Unhealthy for Sensitive Groups)
61 (Unhealthy for Sensitive Groups)
67 (Unhealthy for Sensitive Groups)
99 (Unhealthy)
71 (Unhealthy for Sensitive Groups)
62 (Unhealthy for Sensitive Groups)
65 (Unhealthy for Sensitive Groups)
so2
11 (Good)
12 (Good)
8.5 (Good)
6.5 (Good)
6.9 (Good)
13 (Good)
11 (Good)
7.8 (Good)
8 (Good)
5.5 (Good)
5.5 (Good)
5.3 (Good)
6.9 (Good)
4.9 (Good)
5.8 (Good)
7.8 (Good)
9.7 (Good)
9.3 (Good)
9 (Good)
8 (Good)
data source »
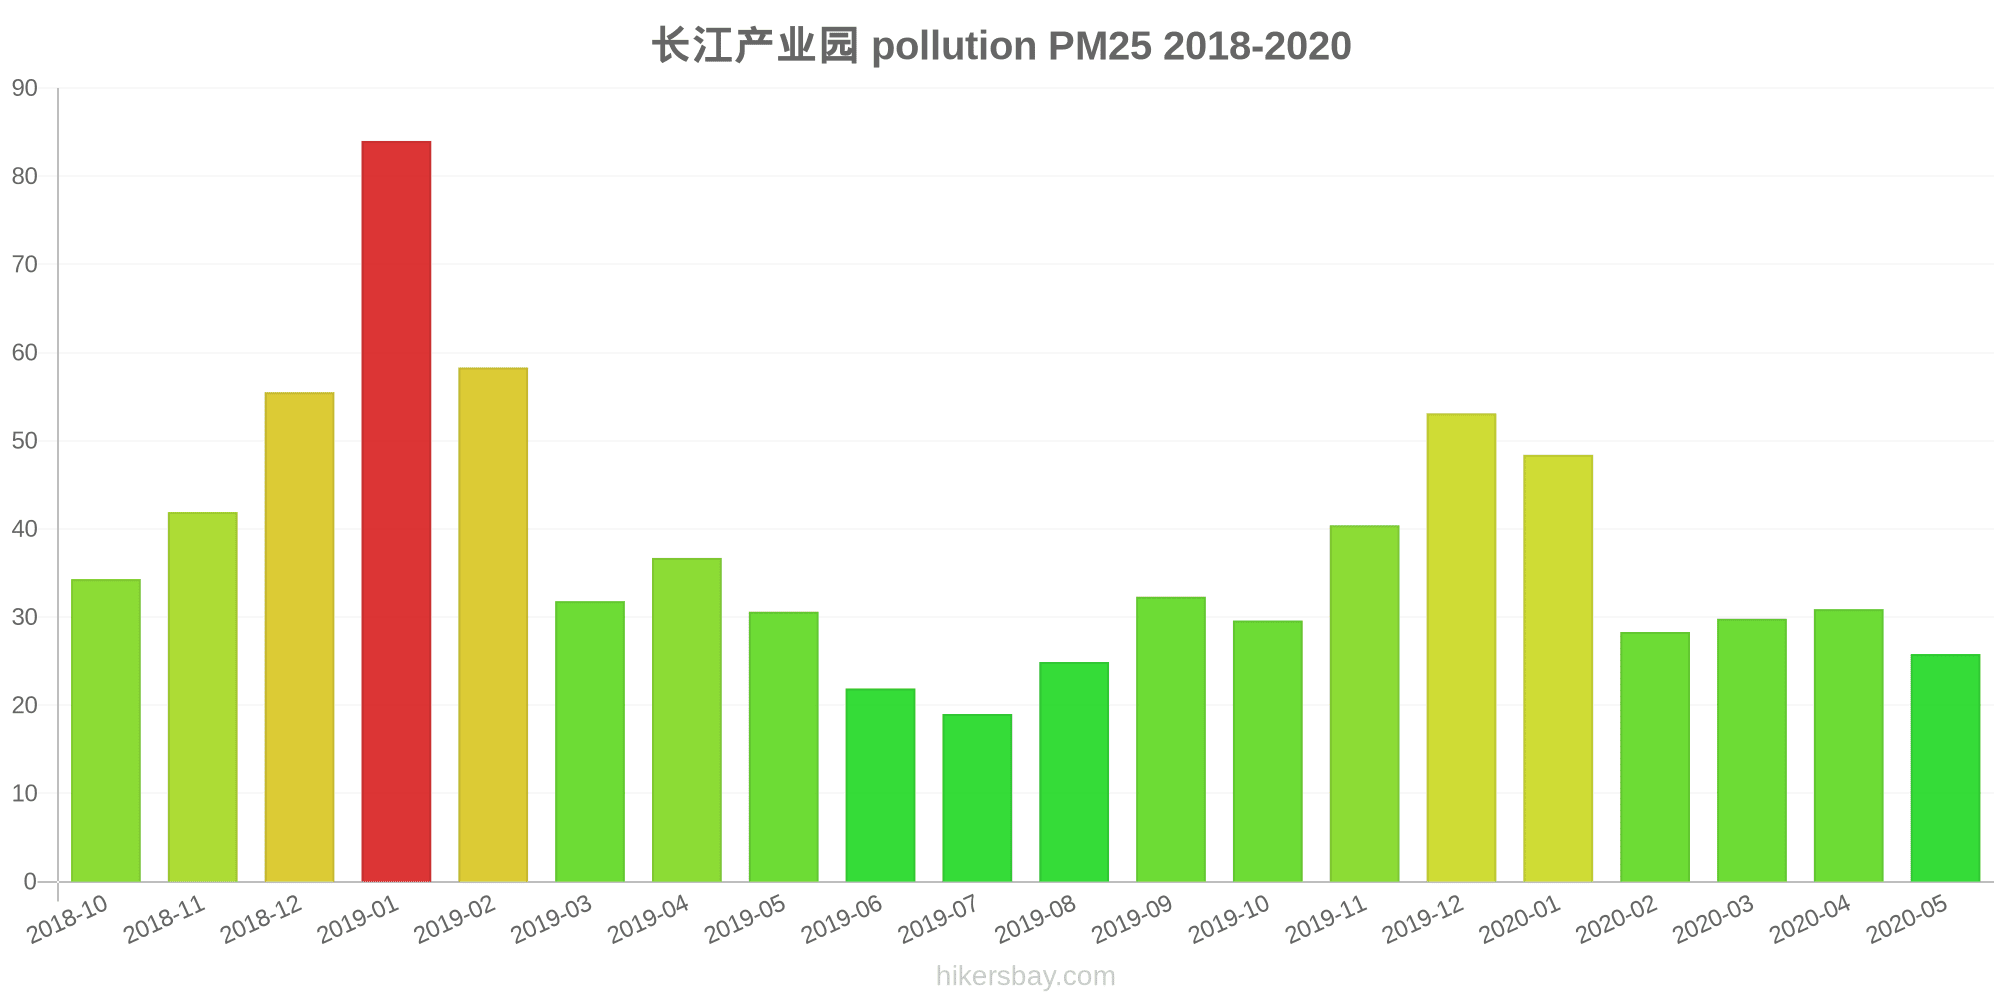
长江产业园
Friday, May 27, 2022, 12:00 PM
PM10 179 (Very bad Hazardous)
particulate matter (PM10) suspended dust
PM2,5 35 (Unhealthy for Sensitive Groups)
particulate matter (PM2.5) dust
O3 0.04 (Good)
ozone (O3)
NO2 0 (Good)
nitrogen dioxide (NO2)
SO2 0 (Good)
sulfur dioxide (SO2)
长江产业园
index
2022-05-27
pm10
56
pm25
56
o3
0.03
no2
0
so2
0
长江产业园
2018-10 2020-05
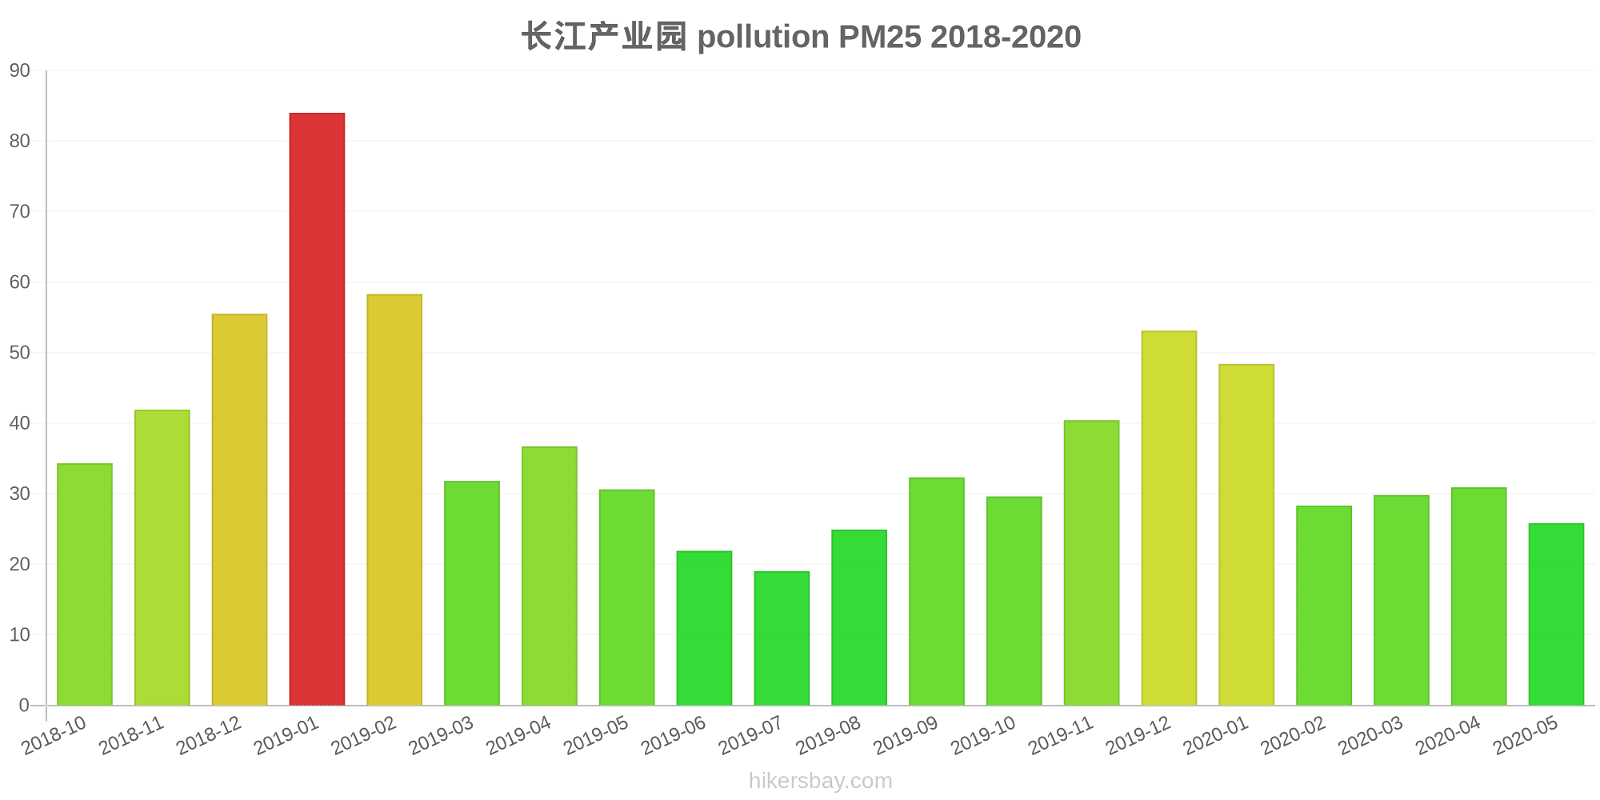
index
2020-05
2020-04
2020-03
2020-02
2020-01
2019-12
2019-11
2019-10
2019-09
2019-08
2019-07
2019-06
2019-05
2019-04
2019-03
2019-02
2019-01
2018-12
2018-11
2018-10
pm25
26
31
30
28
48
53
40
30
32
25
19
22
31
37
32
58
84
56
42
34
co
825
1
886
748
1
1
972
915
938
1
904
720
617
720
616
915
1
1
990
831
no2
13
20
12
7.3
22
35
32
23
23
13
8.4
9.9
18
16
25
23
43
39
36
35
o3
124
134
97
81
55
74
104
120
187
167
135
154
134
109
101
54
50
38
77
102
pm10
54
61
51
37
54
74
75
56
67
52
36
37
63
52
61
67
99
71
62
65
so2
11
12
8.5
6.5
6.9
13
11
7.8
8
5.5
5.5
5.3
6.9
4.9
5.8
7.8
9.7
9.3
9
8
* Pollution data source:
https://openaq.org
(ChinaAQIData)
The data is licensed under CC-By 4.0
PM10 179 (Very bad Hazardous)
PM2,5 35 (Unhealthy for Sensitive Groups)
O3 0 (Good)
NO2 0 (Good)
SO2 0 (Good)
Data on air pollution from recent days in Lujiaqiao
| index | 2022-05-27 |
|---|---|
| pm10 | 56 Unhealthy for Sensitive Groups |
| pm25 | 56 Unhealthy |
| o3 | 0 Good |
| no2 | 0 Good |
| so2 | 0 Good |
| index | 2020-05 | 2020-04 | 2020-03 | 2020-02 | 2020-01 | 2019-12 | 2019-11 | 2019-10 | 2019-09 | 2019-08 | 2019-07 | 2019-06 | 2019-05 | 2019-04 | 2019-03 | 2019-02 | 2019-01 | 2018-12 | 2018-11 | 2018-10 |
|---|---|---|---|---|---|---|---|---|---|---|---|---|---|---|---|---|---|---|---|---|
| pm25 | 26 (Moderate) | 31 (Moderate) | 30 (Moderate) | 28 (Moderate) | 48 (Unhealthy for Sensitive Groups) | 53 (Unhealthy for Sensitive Groups) | 40 (Unhealthy for Sensitive Groups) | 30 (Moderate) | 32 (Moderate) | 25 (Moderate) | 19 (Moderate) | 22 (Moderate) | 31 (Moderate) | 37 (Unhealthy for Sensitive Groups) | 32 (Moderate) | 58 (Unhealthy) | 84 (Very Unhealthy) | 56 (Unhealthy) | 42 (Unhealthy for Sensitive Groups) | 34 (Moderate) |
| co | 825 (Good) | 1 (Good) | 886 (Good) | 748 (Good) | 1 (Good) | 1 (Good) | 972 (Good) | 915 (Good) | 938 (Good) | 1 (Good) | 904 (Good) | 720 (Good) | 617 (Good) | 720 (Good) | 616 (Good) | 915 (Good) | 1 (Good) | 1 (Good) | 990 (Good) | 831 (Good) |
| no2 | 13 (Good) | 20 (Good) | 12 (Good) | 7.3 (Good) | 22 (Good) | 35 (Good) | 32 (Good) | 23 (Good) | 23 (Good) | 13 (Good) | 8.4 (Good) | 9.9 (Good) | 18 (Good) | 16 (Good) | 25 (Good) | 23 (Good) | 43 (Moderate) | 39 (Good) | 36 (Good) | 35 (Good) |
| o3 | 124 (Unhealthy for Sensitive Groups) | 134 (Unhealthy for Sensitive Groups) | 97 (Moderate) | 81 (Moderate) | 55 (Good) | 74 (Moderate) | 104 (Moderate) | 120 (Unhealthy for Sensitive Groups) | 187 (Very Unhealthy) | 167 (Unhealthy) | 135 (Unhealthy for Sensitive Groups) | 154 (Unhealthy) | 134 (Unhealthy for Sensitive Groups) | 109 (Moderate) | 101 (Moderate) | 54 (Good) | 50 (Good) | 38 (Good) | 77 (Moderate) | 102 (Moderate) |
| pm10 | 54 (Unhealthy for Sensitive Groups) | 61 (Unhealthy for Sensitive Groups) | 51 (Unhealthy for Sensitive Groups) | 37 (Moderate) | 54 (Unhealthy for Sensitive Groups) | 74 (Unhealthy for Sensitive Groups) | 75 (Unhealthy for Sensitive Groups) | 56 (Unhealthy for Sensitive Groups) | 67 (Unhealthy for Sensitive Groups) | 52 (Unhealthy for Sensitive Groups) | 36 (Moderate) | 37 (Moderate) | 63 (Unhealthy for Sensitive Groups) | 52 (Unhealthy for Sensitive Groups) | 61 (Unhealthy for Sensitive Groups) | 67 (Unhealthy for Sensitive Groups) | 99 (Unhealthy) | 71 (Unhealthy for Sensitive Groups) | 62 (Unhealthy for Sensitive Groups) | 65 (Unhealthy for Sensitive Groups) |
| so2 | 11 (Good) | 12 (Good) | 8.5 (Good) | 6.5 (Good) | 6.9 (Good) | 13 (Good) | 11 (Good) | 7.8 (Good) | 8 (Good) | 5.5 (Good) | 5.5 (Good) | 5.3 (Good) | 6.9 (Good) | 4.9 (Good) | 5.8 (Good) | 7.8 (Good) | 9.7 (Good) | 9.3 (Good) | 9 (Good) | 8 (Good) |
PM10 179 (Very bad Hazardous)
particulate matter (PM10) suspended dustPM2,5 35 (Unhealthy for Sensitive Groups)
particulate matter (PM2.5) dustO3 0.04 (Good)
ozone (O3)NO2 0 (Good)
nitrogen dioxide (NO2)SO2 0 (Good)
sulfur dioxide (SO2)长江产业园
| index | 2022-05-27 |
|---|---|
| pm10 | 56 |
| pm25 | 56 |
| o3 | 0.03 |
| no2 | 0 |
| so2 | 0 |
长江产业园
| index | 2020-05 | 2020-04 | 2020-03 | 2020-02 | 2020-01 | 2019-12 | 2019-11 | 2019-10 | 2019-09 | 2019-08 | 2019-07 | 2019-06 | 2019-05 | 2019-04 | 2019-03 | 2019-02 | 2019-01 | 2018-12 | 2018-11 | 2018-10 |
|---|---|---|---|---|---|---|---|---|---|---|---|---|---|---|---|---|---|---|---|---|
| pm25 | 26 | 31 | 30 | 28 | 48 | 53 | 40 | 30 | 32 | 25 | 19 | 22 | 31 | 37 | 32 | 58 | 84 | 56 | 42 | 34 |
| co | 825 | 1 | 886 | 748 | 1 | 1 | 972 | 915 | 938 | 1 | 904 | 720 | 617 | 720 | 616 | 915 | 1 | 1 | 990 | 831 |
| no2 | 13 | 20 | 12 | 7.3 | 22 | 35 | 32 | 23 | 23 | 13 | 8.4 | 9.9 | 18 | 16 | 25 | 23 | 43 | 39 | 36 | 35 |
| o3 | 124 | 134 | 97 | 81 | 55 | 74 | 104 | 120 | 187 | 167 | 135 | 154 | 134 | 109 | 101 | 54 | 50 | 38 | 77 | 102 |
| pm10 | 54 | 61 | 51 | 37 | 54 | 74 | 75 | 56 | 67 | 52 | 36 | 37 | 63 | 52 | 61 | 67 | 99 | 71 | 62 | 65 |
| so2 | 11 | 12 | 8.5 | 6.5 | 6.9 | 13 | 11 | 7.8 | 8 | 5.5 | 5.5 | 5.3 | 6.9 | 4.9 | 5.8 | 7.8 | 9.7 | 9.3 | 9 | 8 |