Air Pollution in Meijiazui: Real-time Air Quality Index and smog alert.
Pollution and air quality forecast for Meijiazui. Today is Tuesday, June 2, 2026. The following air pollution values have been recorded for Meijiazui:- particulate matter (PM10) suspended dust - 179 (Very bad Hazardous)
- particulate matter (PM2.5) dust - 35 (Unhealthy for Sensitive Groups)
- ozone (O3) - 0 (Good)
- nitrogen dioxide (NO2) - 0 (Good)
- sulfur dioxide (SO2) - 0 (Good)

What is the air quality in Meijiazui today? Is the air polluted in Meijiazui?. Is there smog?
What is the level of PM10 today in Meijiazui? (particulate matter (PM10) suspended dust)
The current level of particulate matter PM10 in Meijiazui is:
179 (Very bad Hazardous)
The highest PM10 values usually occur in month: 100 (January 2019).
The lowest value of particulate matter PM10 pollution in Meijiazui is usually recorded in: June (35).
What is the current level of PM2.5 in Meijiazui? (particulate matter (PM2.5) dust)
Today's PM2.5 level is:
35 (Unhealthy for Sensitive Groups)
For comparison, the highest level of PM2.5 in Meijiazui in the last 7 days was: 56 (Friday, May 27, 2022) and the lowest: 56 (Friday, May 27, 2022).
The highest PM2.5 values were recorded: 70 (January 2019).
The lowest level of particulate matter PM2.5 pollution occurs in month: July (14).
How is the O3 level today in Meijiazui? (ozone (O3))
0 (Good)
How high is the level of NO2? (nitrogen dioxide (NO2))
0 (Good)
What is the level of SO2 pollution? (sulfur dioxide (SO2))
0 (Good)
Current data Friday, May 27, 2022, 12:00 PM
PM10 179 (Very bad Hazardous)
PM2,5 35 (Unhealthy for Sensitive Groups)
O3 0 (Good)
NO2 0 (Good)
SO2 0 (Good)
Data on air pollution from recent days in Meijiazui
index
2022-05-27
pm10
56
Unhealthy for Sensitive Groups
pm25
56
Unhealthy
o3
0
Good
no2
0
Good
so2
0
Good
data source »
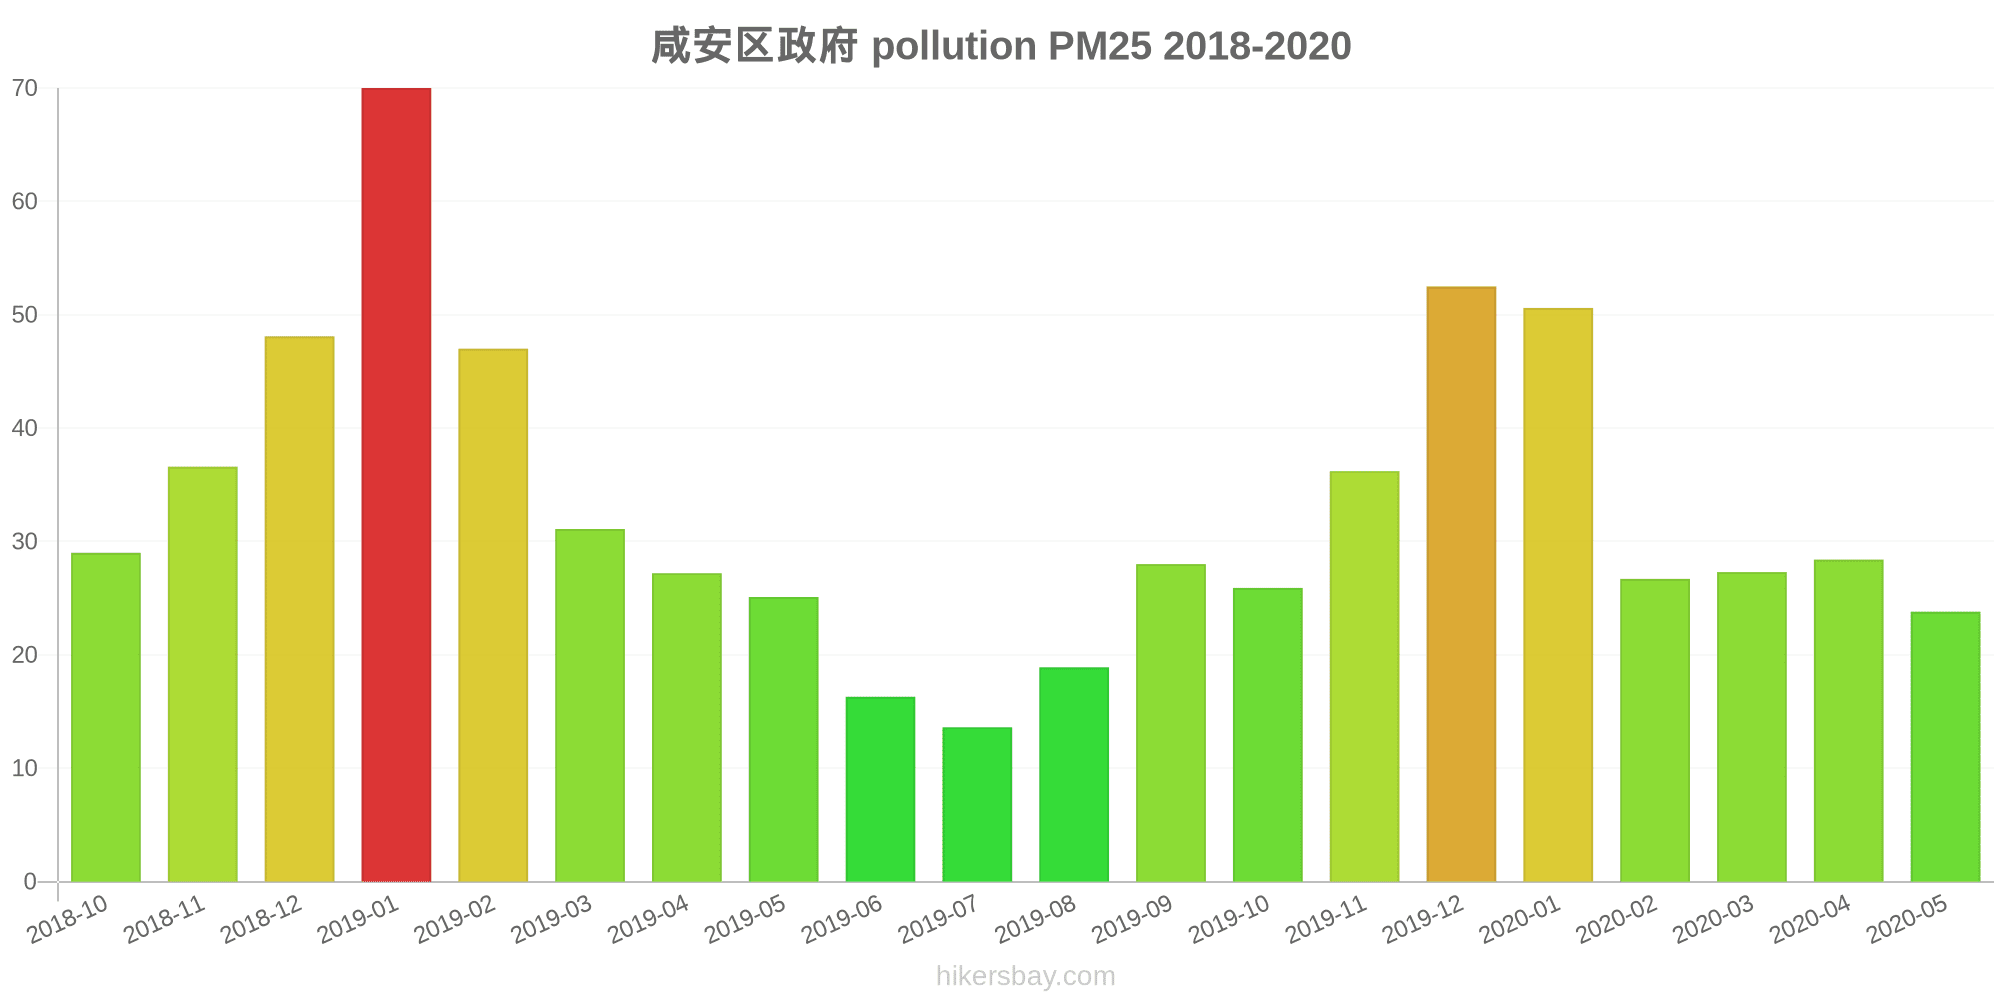
Air pollution in Meijiazui from October 2018 to May 2020

index
2020-05
2020-04
2020-03
2020-02
2020-01
2019-12
2019-11
2019-10
2019-09
2019-08
2019-07
2019-06
2019-05
2019-04
2019-03
2019-02
2019-01
2018-12
2018-11
2018-10
pm25
24 (Moderate)
28 (Moderate)
27 (Moderate)
27 (Moderate)
51 (Unhealthy for Sensitive Groups)
53 (Unhealthy for Sensitive Groups)
36 (Unhealthy for Sensitive Groups)
26 (Moderate)
28 (Moderate)
19 (Moderate)
14 (Moderate)
16 (Moderate)
25 (Moderate)
27 (Moderate)
31 (Moderate)
47 (Unhealthy for Sensitive Groups)
70 (Unhealthy)
48 (Unhealthy for Sensitive Groups)
37 (Unhealthy for Sensitive Groups)
29 (Moderate)
co
812 (Good)
858 (Good)
810 (Good)
560 (Good)
1 (Good)
1 (Good)
932 (Good)
834 (Good)
879 (Good)
947 (Good)
742 (Good)
766 (Good)
636 (Good)
744 (Good)
631 (Good)
944 (Good)
1 (Good)
1 (Good)
909 (Good)
801 (Good)
no2
9.9 (Good)
21 (Good)
13 (Good)
9.8 (Good)
22 (Good)
36 (Good)
29 (Good)
20 (Good)
21 (Good)
13 (Good)
11 (Good)
11 (Good)
18 (Good)
20 (Good)
24 (Good)
21 (Good)
36 (Good)
34 (Good)
29 (Good)
24 (Good)
o3
119 (Moderate)
131 (Unhealthy for Sensitive Groups)
92 (Moderate)
78 (Moderate)
53 (Good)
67 (Good)
103 (Moderate)
113 (Moderate)
179 (Unhealthy)
164 (Unhealthy)
125 (Unhealthy for Sensitive Groups)
151 (Unhealthy)
145 (Unhealthy for Sensitive Groups)
131 (Unhealthy for Sensitive Groups)
115 (Moderate)
61 (Good)
56 (Good)
48 (Good)
93 (Moderate)
118 (Moderate)
pm10
44 (Moderate)
54 (Unhealthy for Sensitive Groups)
47 (Moderate)
36 (Moderate)
55 (Unhealthy for Sensitive Groups)
69 (Unhealthy for Sensitive Groups)
74 (Unhealthy for Sensitive Groups)
54 (Unhealthy for Sensitive Groups)
64 (Unhealthy for Sensitive Groups)
51 (Unhealthy for Sensitive Groups)
36 (Moderate)
35 (Moderate)
61 (Unhealthy for Sensitive Groups)
53 (Unhealthy for Sensitive Groups)
59 (Unhealthy for Sensitive Groups)
60 (Unhealthy for Sensitive Groups)
100 (Unhealthy)
70 (Unhealthy for Sensitive Groups)
60 (Unhealthy for Sensitive Groups)
56 (Unhealthy for Sensitive Groups)
so2
8.7 (Good)
10 (Good)
9 (Good)
7.4 (Good)
7.5 (Good)
10 (Good)
11 (Good)
9.3 (Good)
11 (Good)
6.4 (Good)
4 (Good)
4.2 (Good)
4.9 (Good)
5.2 (Good)
6.9 (Good)
6.3 (Good)
5.8 (Good)
7 (Good)
7.1 (Good)
6.8 (Good)
data source »
咸安区政府
Friday, May 27, 2022, 12:00 PM
PM10 179 (Very bad Hazardous)
particulate matter (PM10) suspended dust
PM2,5 35 (Unhealthy for Sensitive Groups)
particulate matter (PM2.5) dust
O3 0.04 (Good)
ozone (O3)
NO2 0 (Good)
nitrogen dioxide (NO2)
SO2 0 (Good)
sulfur dioxide (SO2)
咸安区政府
index
2022-05-27
pm10
56
pm25
56
o3
0.03
no2
0
so2
0
咸安区政府
2018-10 2020-05

index
2020-05
2020-04
2020-03
2020-02
2020-01
2019-12
2019-11
2019-10
2019-09
2019-08
2019-07
2019-06
2019-05
2019-04
2019-03
2019-02
2019-01
2018-12
2018-11
2018-10
pm25
24
28
27
27
51
53
36
26
28
19
14
16
25
27
31
47
70
48
37
29
co
812
858
810
560
1
1
932
834
879
947
742
766
636
744
631
944
1
1
909
801
no2
9.9
21
13
9.8
22
36
29
20
21
13
11
11
18
20
24
21
36
34
29
24
o3
119
131
92
78
53
67
103
113
179
164
125
151
145
131
115
61
56
48
93
118
pm10
44
54
47
36
55
69
74
54
64
51
36
35
61
53
59
60
100
70
60
56
so2
8.7
10
9
7.4
7.5
10
11
9.3
11
6.4
4
4.2
4.9
5.2
6.9
6.3
5.8
7
7.1
6.8
* Pollution data source:
https://openaq.org
(ChinaAQIData)
The data is licensed under CC-By 4.0
PM10 179 (Very bad Hazardous)
PM2,5 35 (Unhealthy for Sensitive Groups)
O3 0 (Good)
NO2 0 (Good)
SO2 0 (Good)
Data on air pollution from recent days in Meijiazui
| index | 2022-05-27 |
|---|---|
| pm10 | 56 Unhealthy for Sensitive Groups |
| pm25 | 56 Unhealthy |
| o3 | 0 Good |
| no2 | 0 Good |
| so2 | 0 Good |

| index | 2020-05 | 2020-04 | 2020-03 | 2020-02 | 2020-01 | 2019-12 | 2019-11 | 2019-10 | 2019-09 | 2019-08 | 2019-07 | 2019-06 | 2019-05 | 2019-04 | 2019-03 | 2019-02 | 2019-01 | 2018-12 | 2018-11 | 2018-10 |
|---|---|---|---|---|---|---|---|---|---|---|---|---|---|---|---|---|---|---|---|---|
| pm25 | 24 (Moderate) | 28 (Moderate) | 27 (Moderate) | 27 (Moderate) | 51 (Unhealthy for Sensitive Groups) | 53 (Unhealthy for Sensitive Groups) | 36 (Unhealthy for Sensitive Groups) | 26 (Moderate) | 28 (Moderate) | 19 (Moderate) | 14 (Moderate) | 16 (Moderate) | 25 (Moderate) | 27 (Moderate) | 31 (Moderate) | 47 (Unhealthy for Sensitive Groups) | 70 (Unhealthy) | 48 (Unhealthy for Sensitive Groups) | 37 (Unhealthy for Sensitive Groups) | 29 (Moderate) |
| co | 812 (Good) | 858 (Good) | 810 (Good) | 560 (Good) | 1 (Good) | 1 (Good) | 932 (Good) | 834 (Good) | 879 (Good) | 947 (Good) | 742 (Good) | 766 (Good) | 636 (Good) | 744 (Good) | 631 (Good) | 944 (Good) | 1 (Good) | 1 (Good) | 909 (Good) | 801 (Good) |
| no2 | 9.9 (Good) | 21 (Good) | 13 (Good) | 9.8 (Good) | 22 (Good) | 36 (Good) | 29 (Good) | 20 (Good) | 21 (Good) | 13 (Good) | 11 (Good) | 11 (Good) | 18 (Good) | 20 (Good) | 24 (Good) | 21 (Good) | 36 (Good) | 34 (Good) | 29 (Good) | 24 (Good) |
| o3 | 119 (Moderate) | 131 (Unhealthy for Sensitive Groups) | 92 (Moderate) | 78 (Moderate) | 53 (Good) | 67 (Good) | 103 (Moderate) | 113 (Moderate) | 179 (Unhealthy) | 164 (Unhealthy) | 125 (Unhealthy for Sensitive Groups) | 151 (Unhealthy) | 145 (Unhealthy for Sensitive Groups) | 131 (Unhealthy for Sensitive Groups) | 115 (Moderate) | 61 (Good) | 56 (Good) | 48 (Good) | 93 (Moderate) | 118 (Moderate) |
| pm10 | 44 (Moderate) | 54 (Unhealthy for Sensitive Groups) | 47 (Moderate) | 36 (Moderate) | 55 (Unhealthy for Sensitive Groups) | 69 (Unhealthy for Sensitive Groups) | 74 (Unhealthy for Sensitive Groups) | 54 (Unhealthy for Sensitive Groups) | 64 (Unhealthy for Sensitive Groups) | 51 (Unhealthy for Sensitive Groups) | 36 (Moderate) | 35 (Moderate) | 61 (Unhealthy for Sensitive Groups) | 53 (Unhealthy for Sensitive Groups) | 59 (Unhealthy for Sensitive Groups) | 60 (Unhealthy for Sensitive Groups) | 100 (Unhealthy) | 70 (Unhealthy for Sensitive Groups) | 60 (Unhealthy for Sensitive Groups) | 56 (Unhealthy for Sensitive Groups) |
| so2 | 8.7 (Good) | 10 (Good) | 9 (Good) | 7.4 (Good) | 7.5 (Good) | 10 (Good) | 11 (Good) | 9.3 (Good) | 11 (Good) | 6.4 (Good) | 4 (Good) | 4.2 (Good) | 4.9 (Good) | 5.2 (Good) | 6.9 (Good) | 6.3 (Good) | 5.8 (Good) | 7 (Good) | 7.1 (Good) | 6.8 (Good) |
PM10 179 (Very bad Hazardous)
particulate matter (PM10) suspended dustPM2,5 35 (Unhealthy for Sensitive Groups)
particulate matter (PM2.5) dustO3 0.04 (Good)
ozone (O3)NO2 0 (Good)
nitrogen dioxide (NO2)SO2 0 (Good)
sulfur dioxide (SO2)咸安区政府
| index | 2022-05-27 |
|---|---|
| pm10 | 56 |
| pm25 | 56 |
| o3 | 0.03 |
| no2 | 0 |
| so2 | 0 |
咸安区政府
| index | 2020-05 | 2020-04 | 2020-03 | 2020-02 | 2020-01 | 2019-12 | 2019-11 | 2019-10 | 2019-09 | 2019-08 | 2019-07 | 2019-06 | 2019-05 | 2019-04 | 2019-03 | 2019-02 | 2019-01 | 2018-12 | 2018-11 | 2018-10 |
|---|---|---|---|---|---|---|---|---|---|---|---|---|---|---|---|---|---|---|---|---|
| pm25 | 24 | 28 | 27 | 27 | 51 | 53 | 36 | 26 | 28 | 19 | 14 | 16 | 25 | 27 | 31 | 47 | 70 | 48 | 37 | 29 |
| co | 812 | 858 | 810 | 560 | 1 | 1 | 932 | 834 | 879 | 947 | 742 | 766 | 636 | 744 | 631 | 944 | 1 | 1 | 909 | 801 |
| no2 | 9.9 | 21 | 13 | 9.8 | 22 | 36 | 29 | 20 | 21 | 13 | 11 | 11 | 18 | 20 | 24 | 21 | 36 | 34 | 29 | 24 |
| o3 | 119 | 131 | 92 | 78 | 53 | 67 | 103 | 113 | 179 | 164 | 125 | 151 | 145 | 131 | 115 | 61 | 56 | 48 | 93 | 118 |
| pm10 | 44 | 54 | 47 | 36 | 55 | 69 | 74 | 54 | 64 | 51 | 36 | 35 | 61 | 53 | 59 | 60 | 100 | 70 | 60 | 56 |
| so2 | 8.7 | 10 | 9 | 7.4 | 7.5 | 10 | 11 | 9.3 | 11 | 6.4 | 4 | 4.2 | 4.9 | 5.2 | 6.9 | 6.3 | 5.8 | 7 | 7.1 | 6.8 |