Air Pollution in Zhongling: Real-time Air Quality Index and smog alert.
Pollution and air quality forecast for Zhongling. Today is Tuesday, June 2, 2026. The following air pollution values have been recorded for Zhongling:- particulate matter (PM10) suspended dust - 179 (Very bad Hazardous)
- particulate matter (PM2.5) dust - 35 (Unhealthy for Sensitive Groups)
- ozone (O3) - 0 (Good)
- nitrogen dioxide (NO2) - 0 (Good)
- sulfur dioxide (SO2) - 0 (Good)

What is the air quality in Zhongling today? Is the air polluted in Zhongling?. Is there smog?
What is the level of PM10 today in Zhongling? (particulate matter (PM10) suspended dust)
The current level of particulate matter PM10 in Zhongling is:
179 (Very bad Hazardous)
The highest PM10 values usually occur in month: 87 (January 2019).
The lowest value of particulate matter PM10 pollution in Zhongling is usually recorded in: July (34).
What is the current level of PM2.5 in Zhongling? (particulate matter (PM2.5) dust)
Today's PM2.5 level is:
35 (Unhealthy for Sensitive Groups)
For comparison, the highest level of PM2.5 in Zhongling in the last 7 days was: 56 (Friday, May 27, 2022) and the lowest: 56 (Friday, May 27, 2022).
The highest PM2.5 values were recorded: 50 (January 2019).
The lowest level of particulate matter PM2.5 pollution occurs in month: July (15).
How is the O3 level today in Zhongling? (ozone (O3))
0 (Good)
How high is the level of NO2? (nitrogen dioxide (NO2))
0 (Good)
What is the level of SO2 pollution? (sulfur dioxide (SO2))
0 (Good)
Current data Friday, May 27, 2022, 12:00 PM
PM10 179 (Very bad Hazardous)
PM2,5 35 (Unhealthy for Sensitive Groups)
O3 0 (Good)
NO2 0 (Good)
SO2 0 (Good)
Data on air pollution from recent days in Zhongling
index
2022-05-27
pm10
56
Unhealthy for Sensitive Groups
pm25
56
Unhealthy
o3
0
Good
no2
0
Good
so2
0
Good
data source »
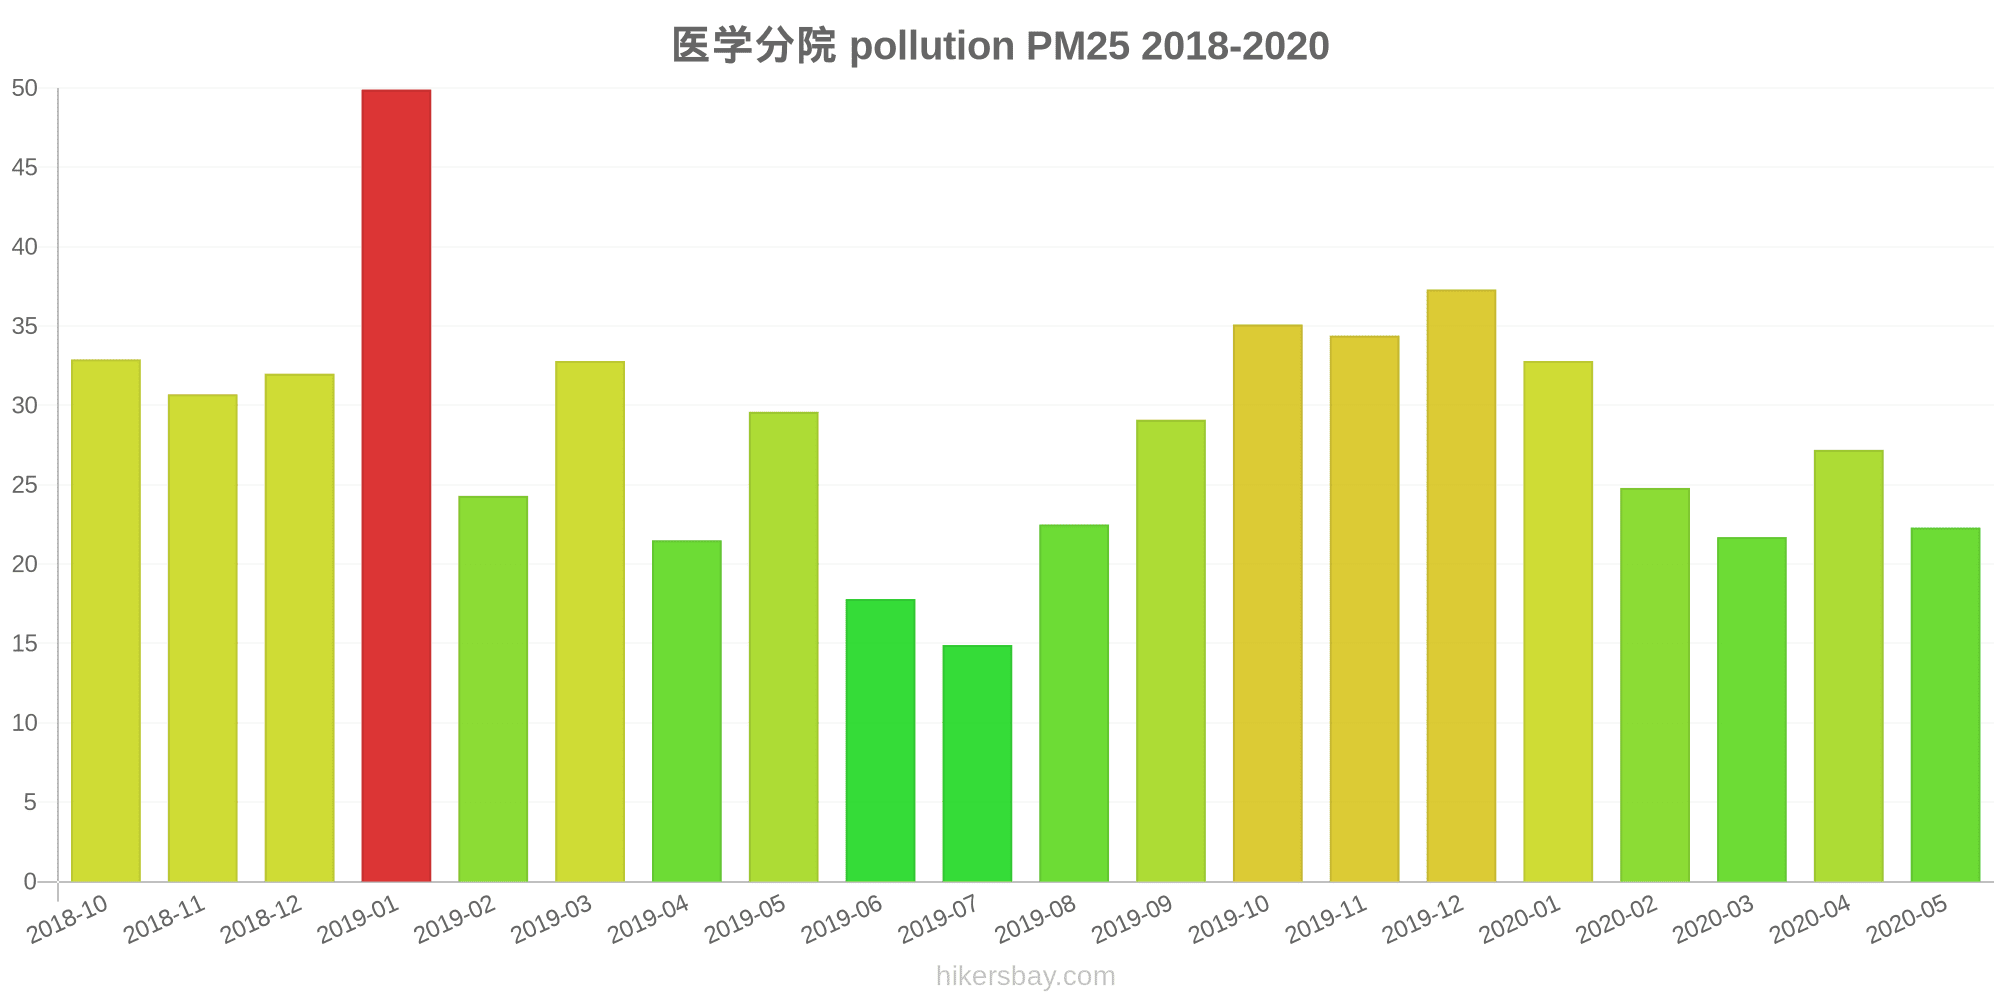
Air pollution in Zhongling from October 2018 to May 2020

index
2020-05
2020-04
2020-03
2020-02
2020-01
2019-12
2019-11
2019-10
2019-09
2019-08
2019-07
2019-06
2019-05
2019-04
2019-03
2019-02
2019-01
2018-12
2018-11
2018-10
pm25
22 (Moderate)
27 (Moderate)
22 (Moderate)
25 (Moderate)
33 (Moderate)
37 (Unhealthy for Sensitive Groups)
34 (Moderate)
35 (Unhealthy for Sensitive Groups)
29 (Moderate)
23 (Moderate)
15 (Moderate)
18 (Moderate)
30 (Moderate)
22 (Moderate)
33 (Moderate)
24 (Moderate)
50 (Unhealthy for Sensitive Groups)
32 (Moderate)
31 (Moderate)
33 (Moderate)
co
605 (Good)
495 (Good)
633 (Good)
608 (Good)
857 (Good)
741 (Good)
632 (Good)
662 (Good)
733 (Good)
647 (Good)
566 (Good)
729 (Good)
918 (Good)
878 (Good)
921 (Good)
941 (Good)
1 (Good)
861 (Good)
672 (Good)
669 (Good)
no2
13 (Good)
21 (Good)
18 (Good)
12 (Good)
22 (Good)
29 (Good)
25 (Good)
18 (Good)
12 (Good)
7.9 (Good)
6.5 (Good)
6.7 (Good)
8.5 (Good)
7.8 (Good)
14 (Good)
6 (Good)
22 (Good)
16 (Good)
20 (Good)
17 (Good)
o3
124 (Unhealthy for Sensitive Groups)
142 (Unhealthy for Sensitive Groups)
89 (Moderate)
86 (Moderate)
62 (Good)
87 (Moderate)
127 (Unhealthy for Sensitive Groups)
145 (Unhealthy for Sensitive Groups)
170 (Unhealthy)
139 (Unhealthy for Sensitive Groups)
98 (Moderate)
106 (Moderate)
121 (Unhealthy for Sensitive Groups)
86 (Moderate)
75 (Moderate)
49 (Good)
64 (Good)
54 (Good)
75 (Moderate)
111 (Moderate)
pm10
47 (Moderate)
56 (Unhealthy for Sensitive Groups)
42 (Moderate)
41 (Moderate)
56 (Unhealthy for Sensitive Groups)
76 (Unhealthy for Sensitive Groups)
81 (Unhealthy)
74 (Unhealthy for Sensitive Groups)
59 (Unhealthy for Sensitive Groups)
46 (Moderate)
34 (Moderate)
38 (Moderate)
58 (Unhealthy for Sensitive Groups)
43 (Moderate)
60 (Unhealthy for Sensitive Groups)
46 (Moderate)
87 (Unhealthy)
58 (Unhealthy for Sensitive Groups)
57 (Unhealthy for Sensitive Groups)
62 (Unhealthy for Sensitive Groups)
so2
5.5 (Good)
8.3 (Good)
6.3 (Good)
5.8 (Good)
5.8 (Good)
9.4 (Good)
9.1 (Good)
8 (Good)
7.8 (Good)
5.5 (Good)
4.3 (Good)
5.2 (Good)
7.4 (Good)
5.2 (Good)
5.9 (Good)
3.9 (Good)
4.9 (Good)
9.4 (Good)
12 (Good)
21 (Good)
data source »
医学分院
Friday, May 27, 2022, 12:00 PM
PM10 179 (Very bad Hazardous)
particulate matter (PM10) suspended dust
PM2,5 35 (Unhealthy for Sensitive Groups)
particulate matter (PM2.5) dust
O3 0.04 (Good)
ozone (O3)
NO2 0 (Good)
nitrogen dioxide (NO2)
SO2 0 (Good)
sulfur dioxide (SO2)
医学分院
index
2022-05-27
pm10
56
pm25
56
o3
0.03
no2
0
so2
0
医学分院
2018-10 2020-05

index
2020-05
2020-04
2020-03
2020-02
2020-01
2019-12
2019-11
2019-10
2019-09
2019-08
2019-07
2019-06
2019-05
2019-04
2019-03
2019-02
2019-01
2018-12
2018-11
2018-10
pm25
22
27
22
25
33
37
34
35
29
23
15
18
30
22
33
24
50
32
31
33
co
605
495
633
608
857
741
632
662
733
647
566
729
918
878
921
941
1
861
672
669
no2
13
21
18
12
22
29
25
18
12
7.9
6.5
6.7
8.5
7.8
14
6
22
16
20
17
o3
124
142
89
86
62
87
127
145
170
139
98
106
121
86
75
49
64
54
75
111
pm10
47
56
42
41
56
76
81
74
59
46
34
38
58
43
60
46
87
58
57
62
so2
5.5
8.3
6.3
5.8
5.8
9.4
9.1
8
7.8
5.5
4.3
5.2
7.4
5.2
5.9
3.9
4.9
9.4
12
21
* Pollution data source:
https://openaq.org
(ChinaAQIData)
The data is licensed under CC-By 4.0
PM10 179 (Very bad Hazardous)
PM2,5 35 (Unhealthy for Sensitive Groups)
O3 0 (Good)
NO2 0 (Good)
SO2 0 (Good)
Data on air pollution from recent days in Zhongling
| index | 2022-05-27 |
|---|---|
| pm10 | 56 Unhealthy for Sensitive Groups |
| pm25 | 56 Unhealthy |
| o3 | 0 Good |
| no2 | 0 Good |
| so2 | 0 Good |

| index | 2020-05 | 2020-04 | 2020-03 | 2020-02 | 2020-01 | 2019-12 | 2019-11 | 2019-10 | 2019-09 | 2019-08 | 2019-07 | 2019-06 | 2019-05 | 2019-04 | 2019-03 | 2019-02 | 2019-01 | 2018-12 | 2018-11 | 2018-10 |
|---|---|---|---|---|---|---|---|---|---|---|---|---|---|---|---|---|---|---|---|---|
| pm25 | 22 (Moderate) | 27 (Moderate) | 22 (Moderate) | 25 (Moderate) | 33 (Moderate) | 37 (Unhealthy for Sensitive Groups) | 34 (Moderate) | 35 (Unhealthy for Sensitive Groups) | 29 (Moderate) | 23 (Moderate) | 15 (Moderate) | 18 (Moderate) | 30 (Moderate) | 22 (Moderate) | 33 (Moderate) | 24 (Moderate) | 50 (Unhealthy for Sensitive Groups) | 32 (Moderate) | 31 (Moderate) | 33 (Moderate) |
| co | 605 (Good) | 495 (Good) | 633 (Good) | 608 (Good) | 857 (Good) | 741 (Good) | 632 (Good) | 662 (Good) | 733 (Good) | 647 (Good) | 566 (Good) | 729 (Good) | 918 (Good) | 878 (Good) | 921 (Good) | 941 (Good) | 1 (Good) | 861 (Good) | 672 (Good) | 669 (Good) |
| no2 | 13 (Good) | 21 (Good) | 18 (Good) | 12 (Good) | 22 (Good) | 29 (Good) | 25 (Good) | 18 (Good) | 12 (Good) | 7.9 (Good) | 6.5 (Good) | 6.7 (Good) | 8.5 (Good) | 7.8 (Good) | 14 (Good) | 6 (Good) | 22 (Good) | 16 (Good) | 20 (Good) | 17 (Good) |
| o3 | 124 (Unhealthy for Sensitive Groups) | 142 (Unhealthy for Sensitive Groups) | 89 (Moderate) | 86 (Moderate) | 62 (Good) | 87 (Moderate) | 127 (Unhealthy for Sensitive Groups) | 145 (Unhealthy for Sensitive Groups) | 170 (Unhealthy) | 139 (Unhealthy for Sensitive Groups) | 98 (Moderate) | 106 (Moderate) | 121 (Unhealthy for Sensitive Groups) | 86 (Moderate) | 75 (Moderate) | 49 (Good) | 64 (Good) | 54 (Good) | 75 (Moderate) | 111 (Moderate) |
| pm10 | 47 (Moderate) | 56 (Unhealthy for Sensitive Groups) | 42 (Moderate) | 41 (Moderate) | 56 (Unhealthy for Sensitive Groups) | 76 (Unhealthy for Sensitive Groups) | 81 (Unhealthy) | 74 (Unhealthy for Sensitive Groups) | 59 (Unhealthy for Sensitive Groups) | 46 (Moderate) | 34 (Moderate) | 38 (Moderate) | 58 (Unhealthy for Sensitive Groups) | 43 (Moderate) | 60 (Unhealthy for Sensitive Groups) | 46 (Moderate) | 87 (Unhealthy) | 58 (Unhealthy for Sensitive Groups) | 57 (Unhealthy for Sensitive Groups) | 62 (Unhealthy for Sensitive Groups) |
| so2 | 5.5 (Good) | 8.3 (Good) | 6.3 (Good) | 5.8 (Good) | 5.8 (Good) | 9.4 (Good) | 9.1 (Good) | 8 (Good) | 7.8 (Good) | 5.5 (Good) | 4.3 (Good) | 5.2 (Good) | 7.4 (Good) | 5.2 (Good) | 5.9 (Good) | 3.9 (Good) | 4.9 (Good) | 9.4 (Good) | 12 (Good) | 21 (Good) |
PM10 179 (Very bad Hazardous)
particulate matter (PM10) suspended dustPM2,5 35 (Unhealthy for Sensitive Groups)
particulate matter (PM2.5) dustO3 0.04 (Good)
ozone (O3)NO2 0 (Good)
nitrogen dioxide (NO2)SO2 0 (Good)
sulfur dioxide (SO2)医学分院
| index | 2022-05-27 |
|---|---|
| pm10 | 56 |
| pm25 | 56 |
| o3 | 0.03 |
| no2 | 0 |
| so2 | 0 |
医学分院
| index | 2020-05 | 2020-04 | 2020-03 | 2020-02 | 2020-01 | 2019-12 | 2019-11 | 2019-10 | 2019-09 | 2019-08 | 2019-07 | 2019-06 | 2019-05 | 2019-04 | 2019-03 | 2019-02 | 2019-01 | 2018-12 | 2018-11 | 2018-10 |
|---|---|---|---|---|---|---|---|---|---|---|---|---|---|---|---|---|---|---|---|---|
| pm25 | 22 | 27 | 22 | 25 | 33 | 37 | 34 | 35 | 29 | 23 | 15 | 18 | 30 | 22 | 33 | 24 | 50 | 32 | 31 | 33 |
| co | 605 | 495 | 633 | 608 | 857 | 741 | 632 | 662 | 733 | 647 | 566 | 729 | 918 | 878 | 921 | 941 | 1 | 861 | 672 | 669 |
| no2 | 13 | 21 | 18 | 12 | 22 | 29 | 25 | 18 | 12 | 7.9 | 6.5 | 6.7 | 8.5 | 7.8 | 14 | 6 | 22 | 16 | 20 | 17 |
| o3 | 124 | 142 | 89 | 86 | 62 | 87 | 127 | 145 | 170 | 139 | 98 | 106 | 121 | 86 | 75 | 49 | 64 | 54 | 75 | 111 |
| pm10 | 47 | 56 | 42 | 41 | 56 | 76 | 81 | 74 | 59 | 46 | 34 | 38 | 58 | 43 | 60 | 46 | 87 | 58 | 57 | 62 |
| so2 | 5.5 | 8.3 | 6.3 | 5.8 | 5.8 | 9.4 | 9.1 | 8 | 7.8 | 5.5 | 4.3 | 5.2 | 7.4 | 5.2 | 5.9 | 3.9 | 4.9 | 9.4 | 12 | 21 |