Air Pollution in Luojialing Zhangjia: Real-time Air Quality Index and smog alert.
Pollution and air quality forecast for Luojialing Zhangjia. Today is Tuesday, June 2, 2026. The following air pollution values have been recorded for Luojialing Zhangjia:- particulate matter (PM10) suspended dust - 179 (Very bad Hazardous)
- particulate matter (PM2.5) dust - 35 (Unhealthy for Sensitive Groups)
- ozone (O3) - 0 (Good)
- nitrogen dioxide (NO2) - 0 (Good)
- sulfur dioxide (SO2) - 0 (Good)

What is the air quality in Luojialing Zhangjia today? Is the air polluted in Luojialing Zhangjia?. Is there smog?
What is the level of PM10 today in Luojialing Zhangjia? (particulate matter (PM10) suspended dust)
The current level of particulate matter PM10 in Luojialing Zhangjia is:
179 (Very bad Hazardous)
The highest PM10 values usually occur in month: 79 (January 2019).
The lowest value of particulate matter PM10 pollution in Luojialing Zhangjia is usually recorded in: July (30).
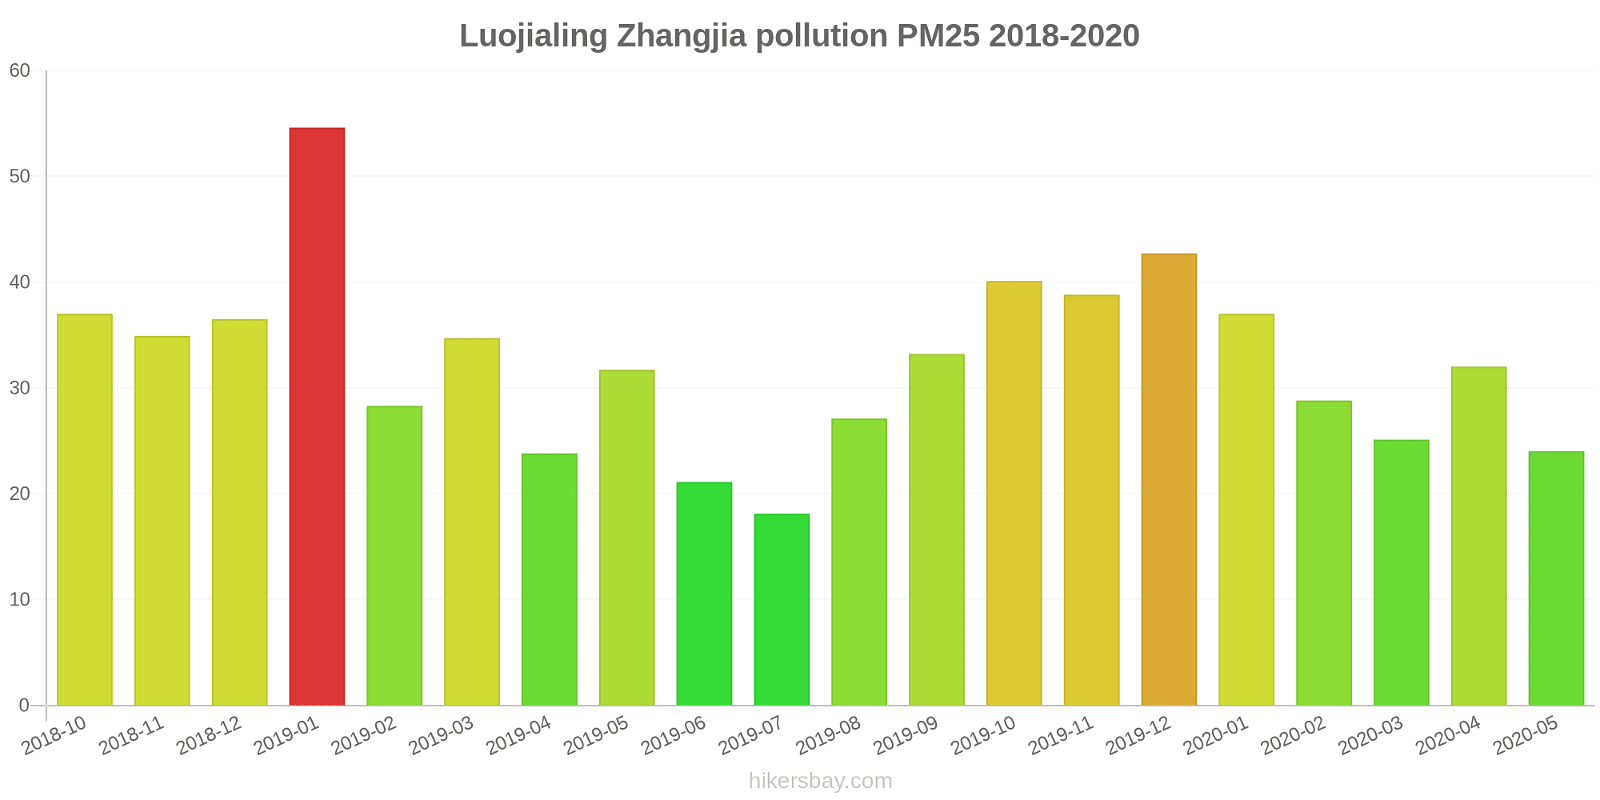
What is the current level of PM2.5 in Luojialing Zhangjia? (particulate matter (PM2.5) dust)
Today's PM2.5 level is:
35 (Unhealthy for Sensitive Groups)
For comparison, the highest level of PM2.5 in Luojialing Zhangjia in the last 7 days was: 56 (Friday, May 27, 2022) and the lowest: 56 (Friday, May 27, 2022).
The highest PM2.5 values were recorded: 55 (January 2019).
The lowest level of particulate matter PM2.5 pollution occurs in month: July (18).
How is the O3 level today in Luojialing Zhangjia? (ozone (O3))
0 (Good)
How high is the level of NO2? (nitrogen dioxide (NO2))
0 (Good)
What is the level of SO2 pollution? (sulfur dioxide (SO2))
0 (Good)
Current data Friday, May 27, 2022, 12:00 PM
PM10 179 (Very bad Hazardous)
PM2,5 35 (Unhealthy for Sensitive Groups)
O3 0 (Good)
NO2 0 (Good)
SO2 0 (Good)
Data on air pollution from recent days in Luojialing Zhangjia
index
2022-05-27
pm10
56
Unhealthy for Sensitive Groups
pm25
56
Unhealthy
o3
0
Good
no2
0
Good
so2
0
Good
data source »
Air pollution in Luojialing Zhangjia from October 2018 to May 2020
index
2020-05
2020-04
2020-03
2020-02
2020-01
2019-12
2019-11
2019-10
2019-09
2019-08
2019-07
2019-06
2019-05
2019-04
2019-03
2019-02
2019-01
2018-12
2018-11
2018-10
pm25
24 (Moderate)
32 (Moderate)
25 (Moderate)
29 (Moderate)
37 (Unhealthy for Sensitive Groups)
43 (Unhealthy for Sensitive Groups)
39 (Unhealthy for Sensitive Groups)
40 (Unhealthy for Sensitive Groups)
33 (Moderate)
27 (Moderate)
18 (Moderate)
21 (Moderate)
32 (Moderate)
24 (Moderate)
35 (Moderate)
28 (Moderate)
55 (Unhealthy for Sensitive Groups)
37 (Unhealthy for Sensitive Groups)
35 (Moderate)
37 (Unhealthy for Sensitive Groups)
co
513 (Good)
563 (Good)
670 (Good)
574 (Good)
1 (Good)
802 (Good)
684 (Good)
767 (Good)
696 (Good)
630 (Good)
674 (Good)
756 (Good)
944 (Good)
847 (Good)
937 (Good)
791 (Good)
1 (Good)
766 (Good)
591 (Good)
639 (Good)
no2
12 (Good)
21 (Good)
18 (Good)
13 (Good)
25 (Good)
34 (Good)
28 (Good)
23 (Good)
16 (Good)
11 (Good)
9.1 (Good)
11 (Good)
12 (Good)
12 (Good)
20 (Good)
8.9 (Good)
31 (Good)
24 (Good)
20 (Good)
17 (Good)
o3
123 (Unhealthy for Sensitive Groups)
139 (Unhealthy for Sensitive Groups)
86 (Moderate)
84 (Moderate)
61 (Good)
85 (Moderate)
125 (Unhealthy for Sensitive Groups)
142 (Unhealthy for Sensitive Groups)
169 (Unhealthy)
136 (Unhealthy for Sensitive Groups)
90 (Moderate)
100 (Moderate)
115 (Moderate)
82 (Moderate)
78 (Moderate)
51 (Good)
62 (Good)
49 (Good)
77 (Moderate)
110 (Moderate)
pm10
46 (Moderate)
54 (Unhealthy for Sensitive Groups)
41 (Moderate)
41 (Moderate)
52 (Unhealthy for Sensitive Groups)
68 (Unhealthy for Sensitive Groups)
72 (Unhealthy for Sensitive Groups)
68 (Unhealthy for Sensitive Groups)
57 (Unhealthy for Sensitive Groups)
44 (Moderate)
30 (Moderate)
36 (Moderate)
54 (Unhealthy for Sensitive Groups)
40 (Moderate)
54 (Unhealthy for Sensitive Groups)
40 (Moderate)
79 (Unhealthy for Sensitive Groups)
55 (Unhealthy for Sensitive Groups)
54 (Unhealthy for Sensitive Groups)
60 (Unhealthy for Sensitive Groups)
so2
6.6 (Good)
8.3 (Good)
7.5 (Good)
7.3 (Good)
7.4 (Good)
10 (Good)
10 (Good)
9.4 (Good)
10 (Good)
7.6 (Good)
6.2 (Good)
7.2 (Good)
8 (Good)
7.1 (Good)
9.3 (Good)
6.6 (Good)
7.6 (Good)
8.3 (Good)
12 (Good)
20 (Good)
data source »
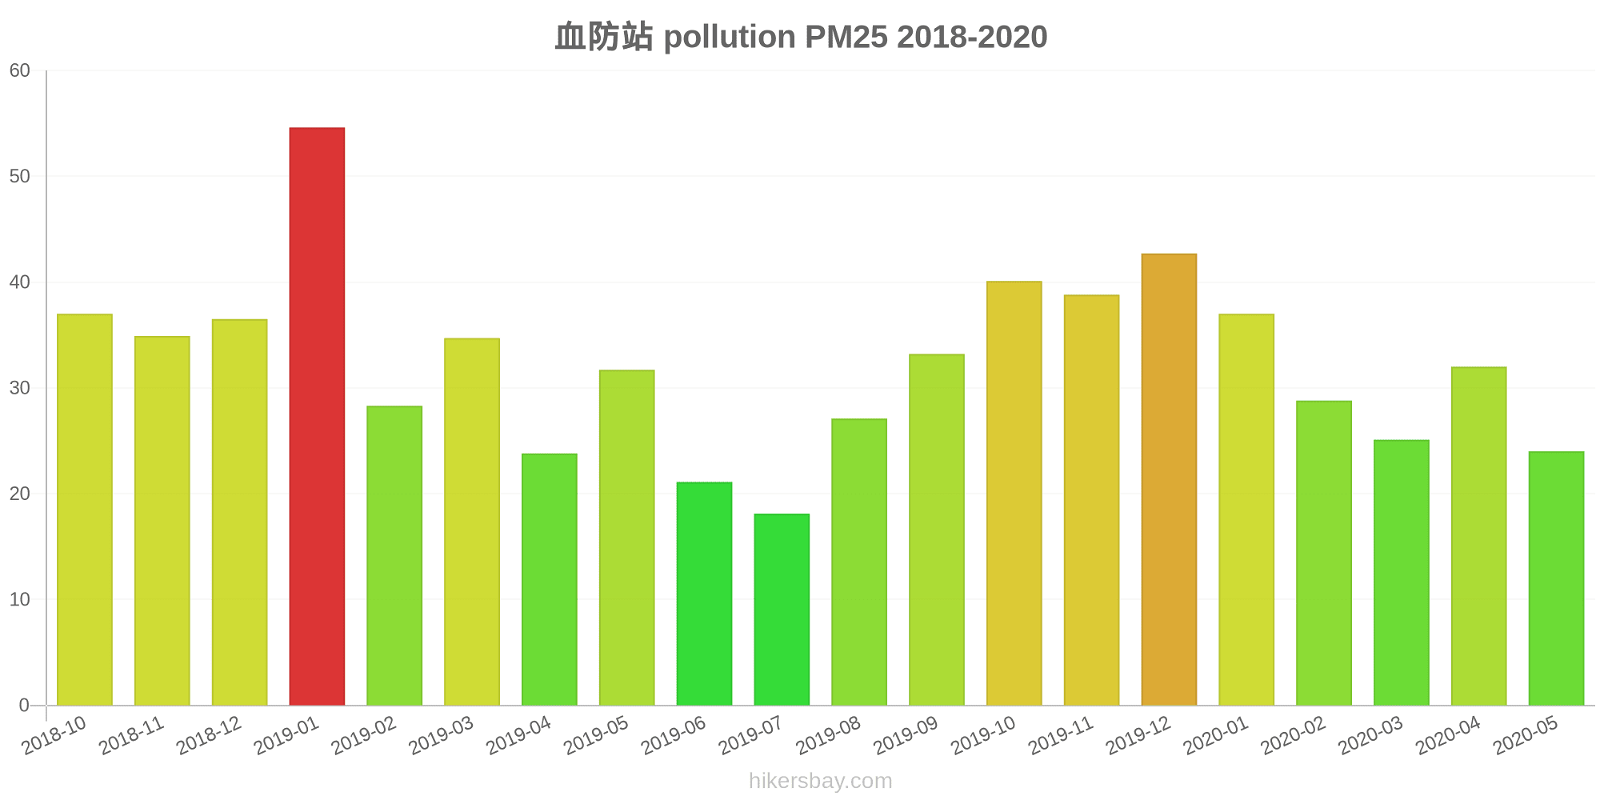
血防站
Friday, May 27, 2022, 12:00 PM
PM10 179 (Very bad Hazardous)
particulate matter (PM10) suspended dust
PM2,5 35 (Unhealthy for Sensitive Groups)
particulate matter (PM2.5) dust
O3 0.04 (Good)
ozone (O3)
NO2 0 (Good)
nitrogen dioxide (NO2)
SO2 0 (Good)
sulfur dioxide (SO2)
血防站
index
2022-05-27
pm10
56
pm25
56
o3
0.03
no2
0
so2
0
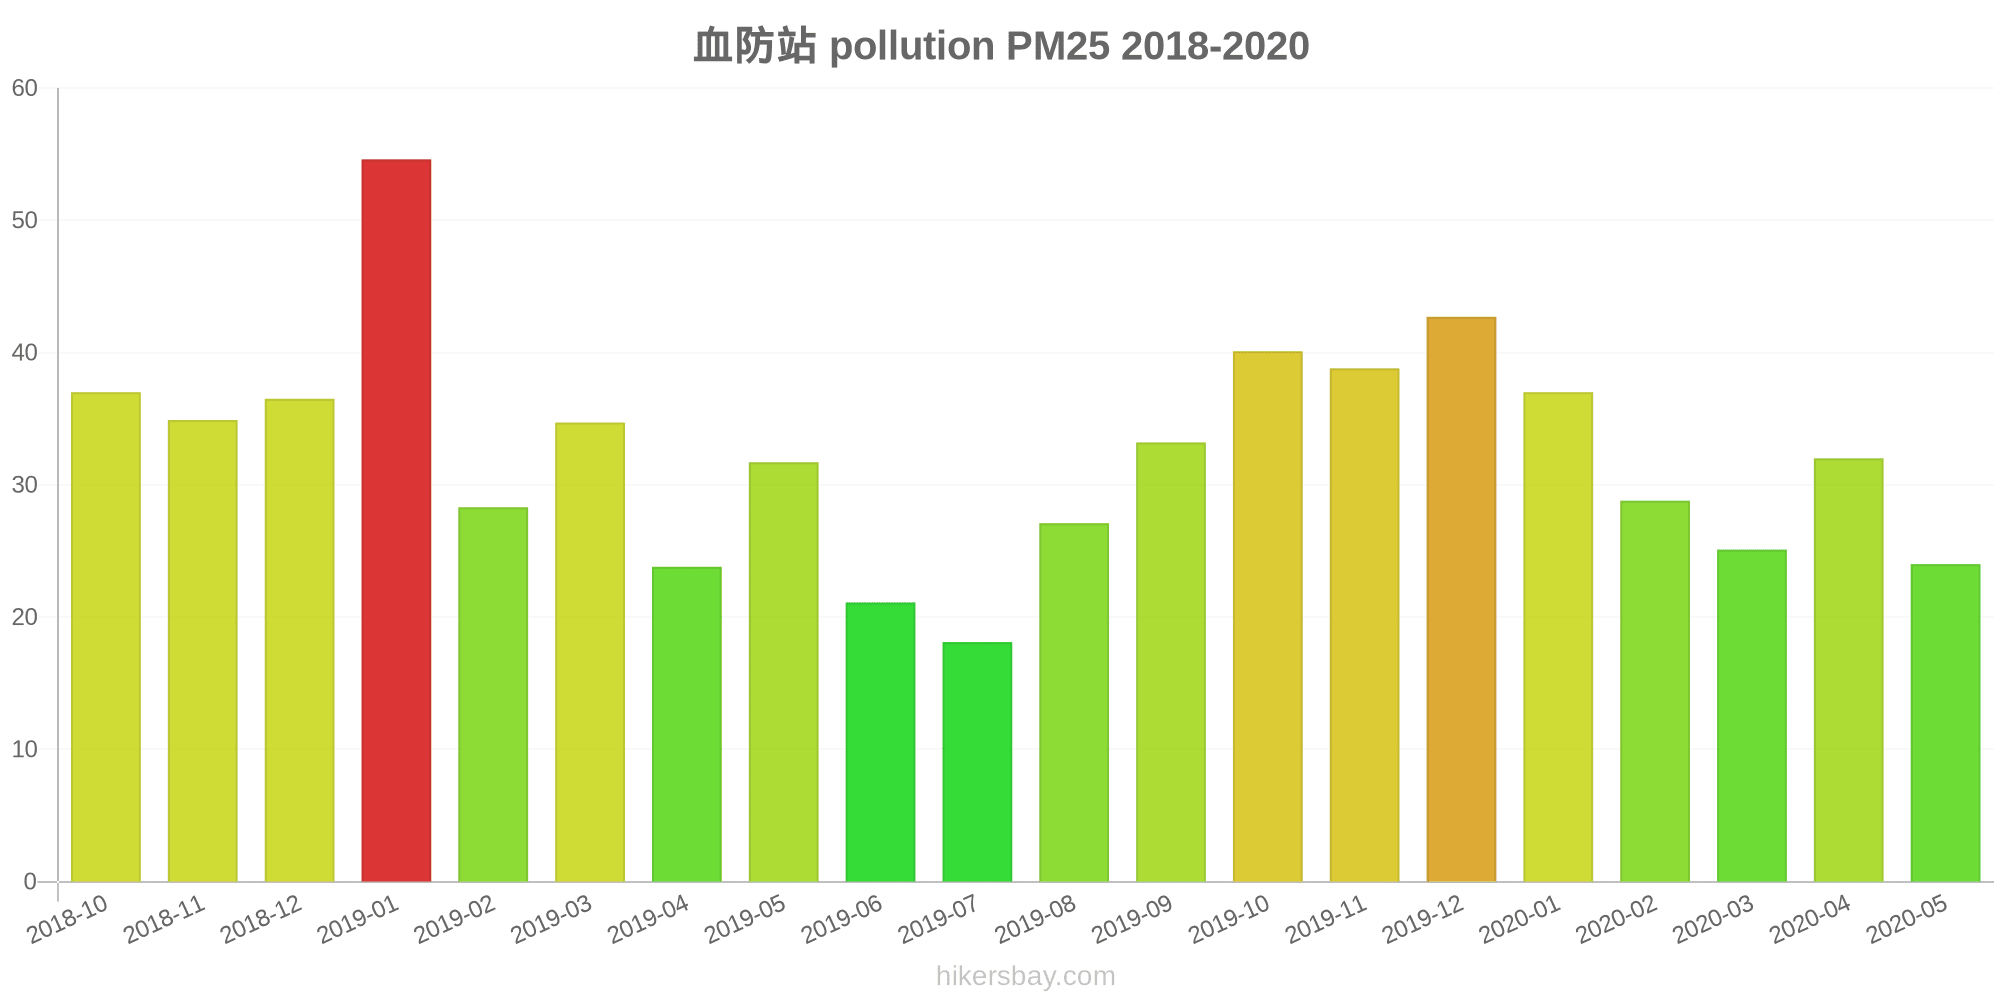
血防站
2018-10 2020-05
index
2020-05
2020-04
2020-03
2020-02
2020-01
2019-12
2019-11
2019-10
2019-09
2019-08
2019-07
2019-06
2019-05
2019-04
2019-03
2019-02
2019-01
2018-12
2018-11
2018-10
pm25
24
32
25
29
37
43
39
40
33
27
18
21
32
24
35
28
55
37
35
37
co
513
563
670
574
1
802
684
767
696
630
674
756
944
847
937
791
1
766
591
639
no2
12
21
18
13
25
34
28
23
16
11
9.1
11
12
12
20
8.9
31
24
20
17
o3
123
139
86
84
61
85
125
142
169
136
90
100
115
82
78
51
62
49
77
110
pm10
46
54
41
41
52
68
72
68
57
44
30
36
54
40
54
40
79
55
54
60
so2
6.6
8.3
7.5
7.3
7.4
10
10
9.4
10
7.6
6.2
7.2
8
7.1
9.3
6.6
7.6
8.3
12
20
* Pollution data source:
https://openaq.org
(ChinaAQIData)
The data is licensed under CC-By 4.0
PM10 179 (Very bad Hazardous)
PM2,5 35 (Unhealthy for Sensitive Groups)
O3 0 (Good)
NO2 0 (Good)
SO2 0 (Good)
Data on air pollution from recent days in Luojialing Zhangjia
| index | 2022-05-27 |
|---|---|
| pm10 | 56 Unhealthy for Sensitive Groups |
| pm25 | 56 Unhealthy |
| o3 | 0 Good |
| no2 | 0 Good |
| so2 | 0 Good |

| index | 2020-05 | 2020-04 | 2020-03 | 2020-02 | 2020-01 | 2019-12 | 2019-11 | 2019-10 | 2019-09 | 2019-08 | 2019-07 | 2019-06 | 2019-05 | 2019-04 | 2019-03 | 2019-02 | 2019-01 | 2018-12 | 2018-11 | 2018-10 |
|---|---|---|---|---|---|---|---|---|---|---|---|---|---|---|---|---|---|---|---|---|
| pm25 | 24 (Moderate) | 32 (Moderate) | 25 (Moderate) | 29 (Moderate) | 37 (Unhealthy for Sensitive Groups) | 43 (Unhealthy for Sensitive Groups) | 39 (Unhealthy for Sensitive Groups) | 40 (Unhealthy for Sensitive Groups) | 33 (Moderate) | 27 (Moderate) | 18 (Moderate) | 21 (Moderate) | 32 (Moderate) | 24 (Moderate) | 35 (Moderate) | 28 (Moderate) | 55 (Unhealthy for Sensitive Groups) | 37 (Unhealthy for Sensitive Groups) | 35 (Moderate) | 37 (Unhealthy for Sensitive Groups) |
| co | 513 (Good) | 563 (Good) | 670 (Good) | 574 (Good) | 1 (Good) | 802 (Good) | 684 (Good) | 767 (Good) | 696 (Good) | 630 (Good) | 674 (Good) | 756 (Good) | 944 (Good) | 847 (Good) | 937 (Good) | 791 (Good) | 1 (Good) | 766 (Good) | 591 (Good) | 639 (Good) |
| no2 | 12 (Good) | 21 (Good) | 18 (Good) | 13 (Good) | 25 (Good) | 34 (Good) | 28 (Good) | 23 (Good) | 16 (Good) | 11 (Good) | 9.1 (Good) | 11 (Good) | 12 (Good) | 12 (Good) | 20 (Good) | 8.9 (Good) | 31 (Good) | 24 (Good) | 20 (Good) | 17 (Good) |
| o3 | 123 (Unhealthy for Sensitive Groups) | 139 (Unhealthy for Sensitive Groups) | 86 (Moderate) | 84 (Moderate) | 61 (Good) | 85 (Moderate) | 125 (Unhealthy for Sensitive Groups) | 142 (Unhealthy for Sensitive Groups) | 169 (Unhealthy) | 136 (Unhealthy for Sensitive Groups) | 90 (Moderate) | 100 (Moderate) | 115 (Moderate) | 82 (Moderate) | 78 (Moderate) | 51 (Good) | 62 (Good) | 49 (Good) | 77 (Moderate) | 110 (Moderate) |
| pm10 | 46 (Moderate) | 54 (Unhealthy for Sensitive Groups) | 41 (Moderate) | 41 (Moderate) | 52 (Unhealthy for Sensitive Groups) | 68 (Unhealthy for Sensitive Groups) | 72 (Unhealthy for Sensitive Groups) | 68 (Unhealthy for Sensitive Groups) | 57 (Unhealthy for Sensitive Groups) | 44 (Moderate) | 30 (Moderate) | 36 (Moderate) | 54 (Unhealthy for Sensitive Groups) | 40 (Moderate) | 54 (Unhealthy for Sensitive Groups) | 40 (Moderate) | 79 (Unhealthy for Sensitive Groups) | 55 (Unhealthy for Sensitive Groups) | 54 (Unhealthy for Sensitive Groups) | 60 (Unhealthy for Sensitive Groups) |
| so2 | 6.6 (Good) | 8.3 (Good) | 7.5 (Good) | 7.3 (Good) | 7.4 (Good) | 10 (Good) | 10 (Good) | 9.4 (Good) | 10 (Good) | 7.6 (Good) | 6.2 (Good) | 7.2 (Good) | 8 (Good) | 7.1 (Good) | 9.3 (Good) | 6.6 (Good) | 7.6 (Good) | 8.3 (Good) | 12 (Good) | 20 (Good) |
PM10 179 (Very bad Hazardous)
particulate matter (PM10) suspended dustPM2,5 35 (Unhealthy for Sensitive Groups)
particulate matter (PM2.5) dustO3 0.04 (Good)
ozone (O3)NO2 0 (Good)
nitrogen dioxide (NO2)SO2 0 (Good)
sulfur dioxide (SO2)血防站
| index | 2022-05-27 |
|---|---|
| pm10 | 56 |
| pm25 | 56 |
| o3 | 0.03 |
| no2 | 0 |
| so2 | 0 |
血防站
| index | 2020-05 | 2020-04 | 2020-03 | 2020-02 | 2020-01 | 2019-12 | 2019-11 | 2019-10 | 2019-09 | 2019-08 | 2019-07 | 2019-06 | 2019-05 | 2019-04 | 2019-03 | 2019-02 | 2019-01 | 2018-12 | 2018-11 | 2018-10 |
|---|---|---|---|---|---|---|---|---|---|---|---|---|---|---|---|---|---|---|---|---|
| pm25 | 24 | 32 | 25 | 29 | 37 | 43 | 39 | 40 | 33 | 27 | 18 | 21 | 32 | 24 | 35 | 28 | 55 | 37 | 35 | 37 |
| co | 513 | 563 | 670 | 574 | 1 | 802 | 684 | 767 | 696 | 630 | 674 | 756 | 944 | 847 | 937 | 791 | 1 | 766 | 591 | 639 |
| no2 | 12 | 21 | 18 | 13 | 25 | 34 | 28 | 23 | 16 | 11 | 9.1 | 11 | 12 | 12 | 20 | 8.9 | 31 | 24 | 20 | 17 |
| o3 | 123 | 139 | 86 | 84 | 61 | 85 | 125 | 142 | 169 | 136 | 90 | 100 | 115 | 82 | 78 | 51 | 62 | 49 | 77 | 110 |
| pm10 | 46 | 54 | 41 | 41 | 52 | 68 | 72 | 68 | 57 | 44 | 30 | 36 | 54 | 40 | 54 | 40 | 79 | 55 | 54 | 60 |
| so2 | 6.6 | 8.3 | 7.5 | 7.3 | 7.4 | 10 | 10 | 9.4 | 10 | 7.6 | 6.2 | 7.2 | 8 | 7.1 | 9.3 | 6.6 | 7.6 | 8.3 | 12 | 20 |