Air Pollution in Wangcheng: Real-time Air Quality Index and smog alert.
Pollution and air quality forecast for Wangcheng. Today is Wednesday, June 10, 2026. The following air pollution values have been recorded for Wangcheng:- particulate matter (PM2.5) dust - 61 (Unhealthy)
- nitrogen dioxide (NO2) - 22 (Good)
- particulate matter (PM10) suspended dust - 69 (Unhealthy for Sensitive Groups)
- carbon monoxide (CO) - 219 (Good)
- ozone (O3) - 0 (Good)
- sulfur dioxide (SO2) - 8 (Good)

What is the air quality in Wangcheng today? Is the air polluted in Wangcheng?. Is there smog?
What is the current level of PM2.5 in Wangcheng? (particulate matter (PM2.5) dust)
Today's PM2.5 level is:
61 (Unhealthy)
For comparison, the highest level of PM2.5 in Wangcheng in the last 7 days was: 28 (Friday, May 27, 2022) and the lowest: 28 (Friday, May 27, 2022).
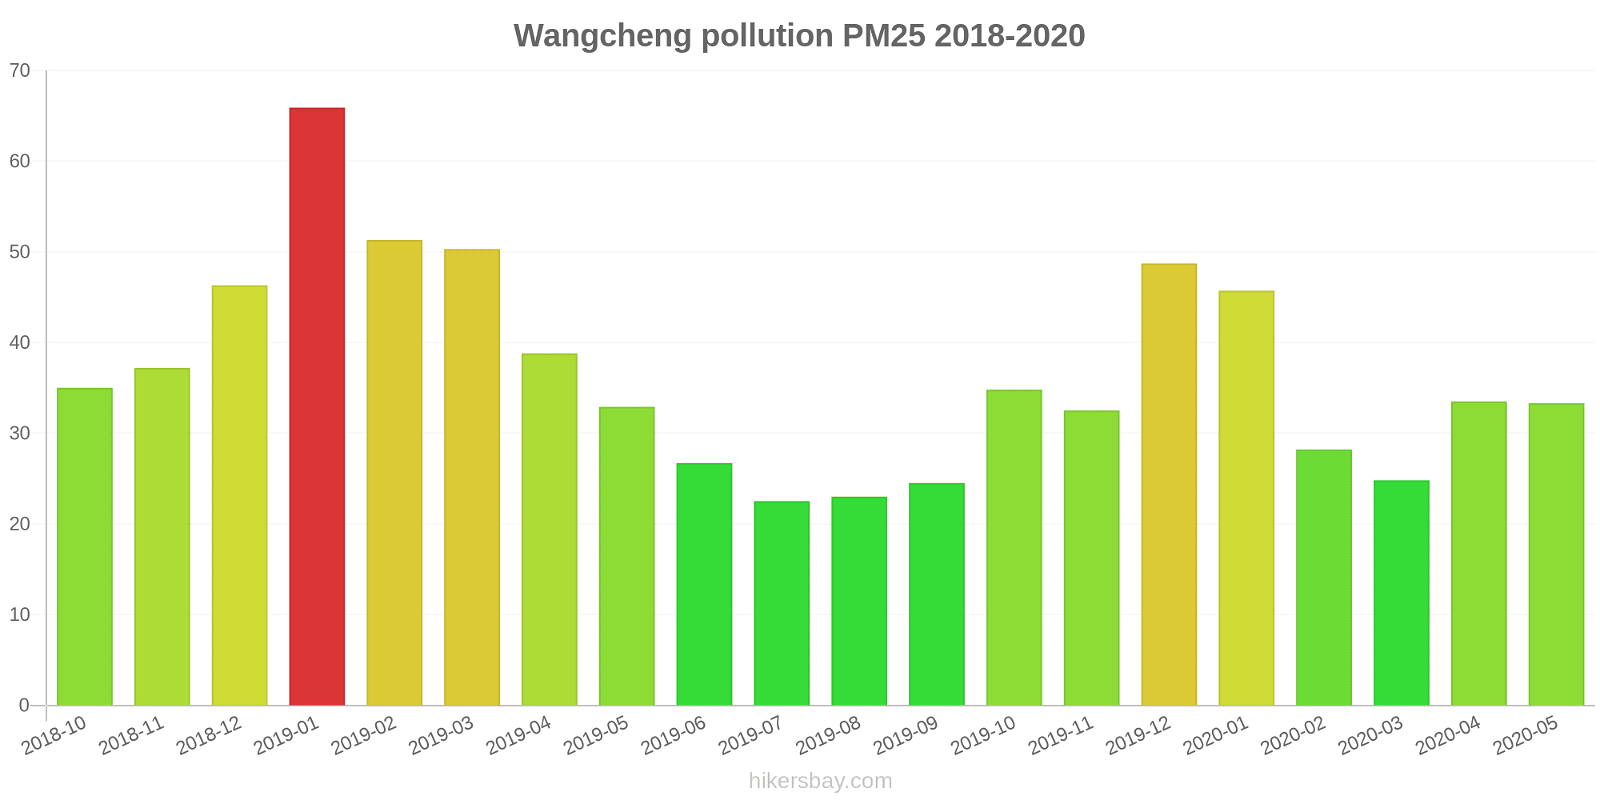
The highest PM2.5 values were recorded: 66 (January 2019).
The lowest level of particulate matter PM2.5 pollution occurs in month: July (23).
How high is the level of NO2? (nitrogen dioxide (NO2))
22 (Good)
What is the level of PM10 today in Wangcheng? (particulate matter (PM10) suspended dust)
The current level of particulate matter PM10 in Wangcheng is:
69 (Unhealthy for Sensitive Groups)
The highest PM10 values usually occur in month: 92 (January 2019).
The lowest value of particulate matter PM10 pollution in Wangcheng is usually recorded in: August (32).
How high is the CO level? (carbon monoxide (CO))
219 (Good)
How is the O3 level today in Wangcheng? (ozone (O3))
0 (Good)
What is the level of SO2 pollution? (sulfur dioxide (SO2))
8 (Good)
Current data Friday, May 27, 2022, 3:00 PM
PM2,5 61 (Unhealthy)
NO2 22 (Good)
PM10 69 (Unhealthy for Sensitive Groups)
CO 219 (Good)
O3 0 (Good)
SO2 8 (Good)
Data on air pollution from recent days in Wangcheng
index
2022-05-27
pm25
28
Moderate
no2
22
Good
pm10
35
Moderate
co
579
Good
o3
22
Good
so2
5
Good
data source »
Air pollution in Wangcheng from October 2018 to May 2020
index
2020-05
2020-04
2020-03
2020-02
2020-01
2019-12
2019-11
2019-10
2019-09
2019-08
2019-07
2019-06
2019-05
2019-04
2019-03
2019-02
2019-01
2018-12
2018-11
2018-10
pm25
33 (Moderate)
34 (Moderate)
25 (Moderate)
28 (Moderate)
46 (Unhealthy for Sensitive Groups)
49 (Unhealthy for Sensitive Groups)
33 (Moderate)
35 (Moderate)
25 (Moderate)
23 (Moderate)
23 (Moderate)
27 (Moderate)
33 (Moderate)
39 (Unhealthy for Sensitive Groups)
50 (Unhealthy for Sensitive Groups)
51 (Unhealthy for Sensitive Groups)
66 (Unhealthy)
46 (Unhealthy for Sensitive Groups)
37 (Unhealthy for Sensitive Groups)
35 (Unhealthy for Sensitive Groups)
co
666 (Good)
587 (Good)
688 (Good)
628 (Good)
889 (Good)
923 (Good)
639 (Good)
728 (Good)
685 (Good)
551 (Good)
436 (Good)
571 (Good)
647 (Good)
705 (Good)
770 (Good)
805 (Good)
1 (Good)
857 (Good)
769 (Good)
765 (Good)
no2
25 (Good)
35 (Good)
32 (Good)
18 (Good)
33 (Good)
54 (Moderate)
42 (Moderate)
39 (Good)
29 (Good)
18 (Good)
18 (Good)
17 (Good)
23 (Good)
29 (Good)
35 (Good)
27 (Good)
49 (Moderate)
48 (Moderate)
46 (Moderate)
43 (Moderate)
o3
158 (Unhealthy)
156 (Unhealthy)
106 (Moderate)
101 (Moderate)
74 (Moderate)
70 (Moderate)
101 (Moderate)
124 (Unhealthy for Sensitive Groups)
160 (Unhealthy)
154 (Unhealthy)
161 (Unhealthy)
184 (Very Unhealthy)
178 (Unhealthy)
143 (Unhealthy for Sensitive Groups)
130 (Unhealthy for Sensitive Groups)
87 (Moderate)
57 (Good)
54 (Good)
81 (Moderate)
125 (Unhealthy for Sensitive Groups)
pm10
50 (Moderate)
58 (Unhealthy for Sensitive Groups)
44 (Moderate)
38 (Moderate)
55 (Unhealthy for Sensitive Groups)
66 (Unhealthy for Sensitive Groups)
65 (Unhealthy for Sensitive Groups)
62 (Unhealthy for Sensitive Groups)
39 (Moderate)
32 (Moderate)
32 (Moderate)
35 (Moderate)
57 (Unhealthy for Sensitive Groups)
59 (Unhealthy for Sensitive Groups)
89 (Unhealthy)
69 (Unhealthy for Sensitive Groups)
92 (Unhealthy)
71 (Unhealthy for Sensitive Groups)
61 (Unhealthy for Sensitive Groups)
66 (Unhealthy for Sensitive Groups)
so2
5.8 (Good)
7.5 (Good)
6.4 (Good)
6.6 (Good)
7 (Good)
8.9 (Good)
7.1 (Good)
6.7 (Good)
5.7 (Good)
4 (Good)
3.1 (Good)
5 (Good)
7.5 (Good)
7.1 (Good)
7.7 (Good)
5.3 (Good)
6.5 (Good)
7.2 (Good)
6 (Good)
7.6 (Good)
data source »
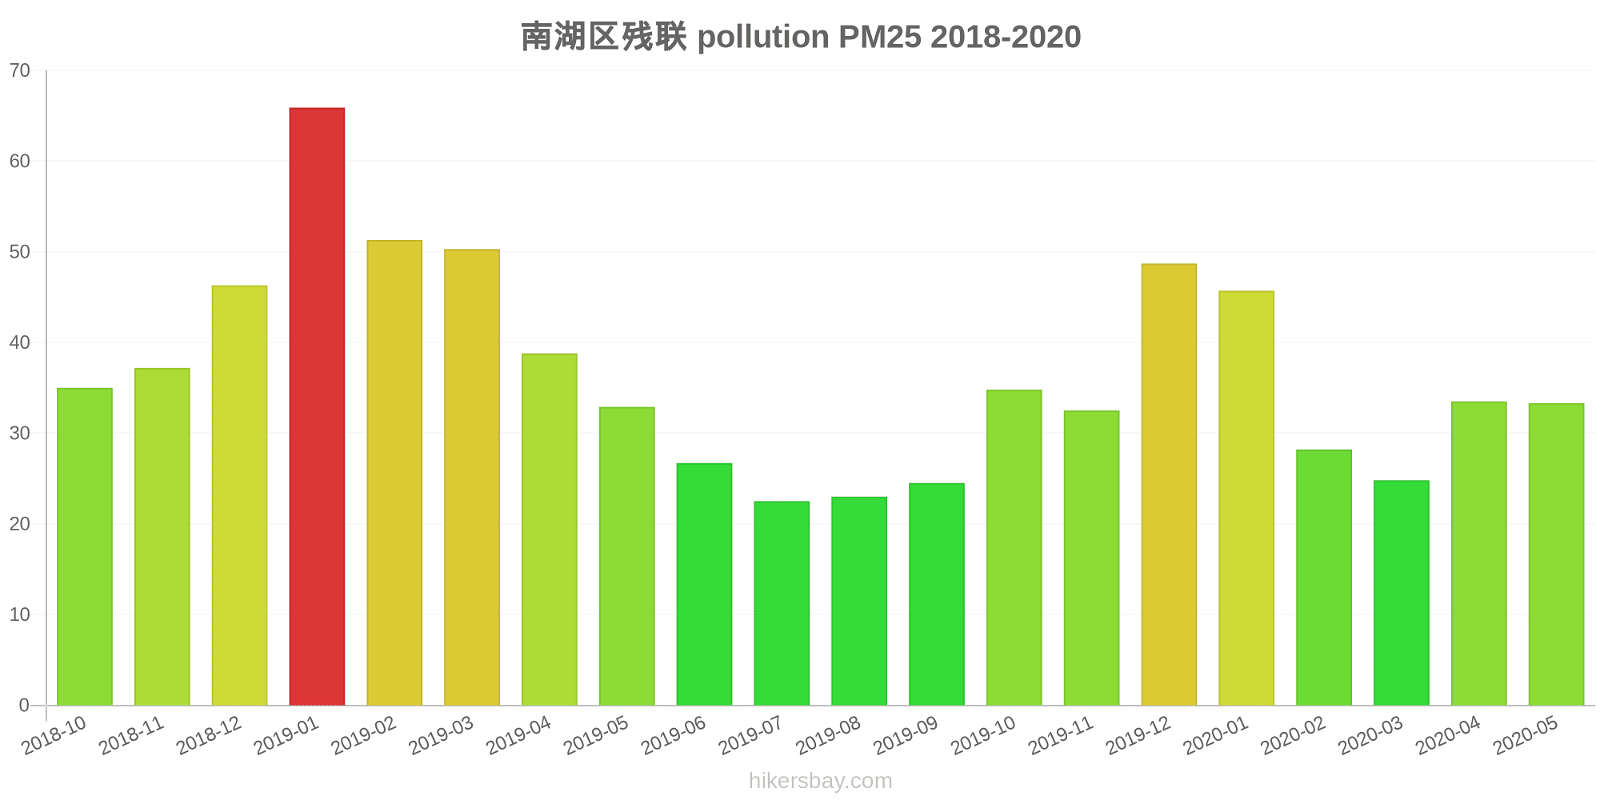
南湖区残联
Friday, May 27, 2022, 3:00 PM
PM2,5 61 (Unhealthy)
particulate matter (PM2.5) dust
NO2 22 (Good)
nitrogen dioxide (NO2)
PM10 69 (Unhealthy for Sensitive Groups)
particulate matter (PM10) suspended dust
CO 219 (Good)
carbon monoxide (CO)
O3 0.05 (Good)
ozone (O3)
SO2 7.7 (Good)
sulfur dioxide (SO2)
南湖区残联
index
2022-05-27
pm25
28
no2
22
pm10
35
co
579
o3
22
so2
4.6
南湖区残联
2018-10 2020-05
index
2020-05
2020-04
2020-03
2020-02
2020-01
2019-12
2019-11
2019-10
2019-09
2019-08
2019-07
2019-06
2019-05
2019-04
2019-03
2019-02
2019-01
2018-12
2018-11
2018-10
pm25
33
34
25
28
46
49
33
35
25
23
23
27
33
39
50
51
66
46
37
35
co
666
587
688
628
889
923
639
728
685
551
436
571
647
705
770
805
1
857
769
765
no2
25
35
32
18
33
54
42
39
29
18
18
17
23
29
35
27
49
48
46
43
o3
158
156
106
101
74
70
101
124
160
154
161
184
178
143
130
87
57
54
81
125
pm10
50
58
44
38
55
66
65
62
39
32
32
35
57
59
89
69
92
71
61
66
so2
5.8
7.5
6.4
6.6
7
8.9
7.1
6.7
5.7
4
3.1
5
7.5
7.1
7.7
5.3
6.5
7.2
6
7.6
* Pollution data source:
https://openaq.org
(ChinaAQIData)
The data is licensed under CC-By 4.0
PM2,5 61 (Unhealthy)
NO2 22 (Good)
PM10 69 (Unhealthy for Sensitive Groups)
CO 219 (Good)
O3 0 (Good)
SO2 8 (Good)
Data on air pollution from recent days in Wangcheng
| index | 2022-05-27 |
|---|---|
| pm25 | 28 Moderate |
| no2 | 22 Good |
| pm10 | 35 Moderate |
| co | 579 Good |
| o3 | 22 Good |
| so2 | 5 Good |

| index | 2020-05 | 2020-04 | 2020-03 | 2020-02 | 2020-01 | 2019-12 | 2019-11 | 2019-10 | 2019-09 | 2019-08 | 2019-07 | 2019-06 | 2019-05 | 2019-04 | 2019-03 | 2019-02 | 2019-01 | 2018-12 | 2018-11 | 2018-10 |
|---|---|---|---|---|---|---|---|---|---|---|---|---|---|---|---|---|---|---|---|---|
| pm25 | 33 (Moderate) | 34 (Moderate) | 25 (Moderate) | 28 (Moderate) | 46 (Unhealthy for Sensitive Groups) | 49 (Unhealthy for Sensitive Groups) | 33 (Moderate) | 35 (Moderate) | 25 (Moderate) | 23 (Moderate) | 23 (Moderate) | 27 (Moderate) | 33 (Moderate) | 39 (Unhealthy for Sensitive Groups) | 50 (Unhealthy for Sensitive Groups) | 51 (Unhealthy for Sensitive Groups) | 66 (Unhealthy) | 46 (Unhealthy for Sensitive Groups) | 37 (Unhealthy for Sensitive Groups) | 35 (Unhealthy for Sensitive Groups) |
| co | 666 (Good) | 587 (Good) | 688 (Good) | 628 (Good) | 889 (Good) | 923 (Good) | 639 (Good) | 728 (Good) | 685 (Good) | 551 (Good) | 436 (Good) | 571 (Good) | 647 (Good) | 705 (Good) | 770 (Good) | 805 (Good) | 1 (Good) | 857 (Good) | 769 (Good) | 765 (Good) |
| no2 | 25 (Good) | 35 (Good) | 32 (Good) | 18 (Good) | 33 (Good) | 54 (Moderate) | 42 (Moderate) | 39 (Good) | 29 (Good) | 18 (Good) | 18 (Good) | 17 (Good) | 23 (Good) | 29 (Good) | 35 (Good) | 27 (Good) | 49 (Moderate) | 48 (Moderate) | 46 (Moderate) | 43 (Moderate) |
| o3 | 158 (Unhealthy) | 156 (Unhealthy) | 106 (Moderate) | 101 (Moderate) | 74 (Moderate) | 70 (Moderate) | 101 (Moderate) | 124 (Unhealthy for Sensitive Groups) | 160 (Unhealthy) | 154 (Unhealthy) | 161 (Unhealthy) | 184 (Very Unhealthy) | 178 (Unhealthy) | 143 (Unhealthy for Sensitive Groups) | 130 (Unhealthy for Sensitive Groups) | 87 (Moderate) | 57 (Good) | 54 (Good) | 81 (Moderate) | 125 (Unhealthy for Sensitive Groups) |
| pm10 | 50 (Moderate) | 58 (Unhealthy for Sensitive Groups) | 44 (Moderate) | 38 (Moderate) | 55 (Unhealthy for Sensitive Groups) | 66 (Unhealthy for Sensitive Groups) | 65 (Unhealthy for Sensitive Groups) | 62 (Unhealthy for Sensitive Groups) | 39 (Moderate) | 32 (Moderate) | 32 (Moderate) | 35 (Moderate) | 57 (Unhealthy for Sensitive Groups) | 59 (Unhealthy for Sensitive Groups) | 89 (Unhealthy) | 69 (Unhealthy for Sensitive Groups) | 92 (Unhealthy) | 71 (Unhealthy for Sensitive Groups) | 61 (Unhealthy for Sensitive Groups) | 66 (Unhealthy for Sensitive Groups) |
| so2 | 5.8 (Good) | 7.5 (Good) | 6.4 (Good) | 6.6 (Good) | 7 (Good) | 8.9 (Good) | 7.1 (Good) | 6.7 (Good) | 5.7 (Good) | 4 (Good) | 3.1 (Good) | 5 (Good) | 7.5 (Good) | 7.1 (Good) | 7.7 (Good) | 5.3 (Good) | 6.5 (Good) | 7.2 (Good) | 6 (Good) | 7.6 (Good) |
PM2,5 61 (Unhealthy)
particulate matter (PM2.5) dustNO2 22 (Good)
nitrogen dioxide (NO2)PM10 69 (Unhealthy for Sensitive Groups)
particulate matter (PM10) suspended dustCO 219 (Good)
carbon monoxide (CO)O3 0.05 (Good)
ozone (O3)SO2 7.7 (Good)
sulfur dioxide (SO2)南湖区残联
| index | 2022-05-27 |
|---|---|
| pm25 | 28 |
| no2 | 22 |
| pm10 | 35 |
| co | 579 |
| o3 | 22 |
| so2 | 4.6 |
南湖区残联

| index | 2020-05 | 2020-04 | 2020-03 | 2020-02 | 2020-01 | 2019-12 | 2019-11 | 2019-10 | 2019-09 | 2019-08 | 2019-07 | 2019-06 | 2019-05 | 2019-04 | 2019-03 | 2019-02 | 2019-01 | 2018-12 | 2018-11 | 2018-10 |
|---|---|---|---|---|---|---|---|---|---|---|---|---|---|---|---|---|---|---|---|---|
| pm25 | 33 | 34 | 25 | 28 | 46 | 49 | 33 | 35 | 25 | 23 | 23 | 27 | 33 | 39 | 50 | 51 | 66 | 46 | 37 | 35 |
| co | 666 | 587 | 688 | 628 | 889 | 923 | 639 | 728 | 685 | 551 | 436 | 571 | 647 | 705 | 770 | 805 | 1 | 857 | 769 | 765 |
| no2 | 25 | 35 | 32 | 18 | 33 | 54 | 42 | 39 | 29 | 18 | 18 | 17 | 23 | 29 | 35 | 27 | 49 | 48 | 46 | 43 |
| o3 | 158 | 156 | 106 | 101 | 74 | 70 | 101 | 124 | 160 | 154 | 161 | 184 | 178 | 143 | 130 | 87 | 57 | 54 | 81 | 125 |
| pm10 | 50 | 58 | 44 | 38 | 55 | 66 | 65 | 62 | 39 | 32 | 32 | 35 | 57 | 59 | 89 | 69 | 92 | 71 | 61 | 66 |
| so2 | 5.8 | 7.5 | 6.4 | 6.6 | 7 | 8.9 | 7.1 | 6.7 | 5.7 | 4 | 3.1 | 5 | 7.5 | 7.1 | 7.7 | 5.3 | 6.5 | 7.2 | 6 | 7.6 |