Air Pollution in Lügongqiao: Real-time Air Quality Index and smog alert.
Pollution and air quality forecast for Lügongqiao. Today is Wednesday, June 10, 2026. The following air pollution values have been recorded for Lügongqiao:- particulate matter (PM2.5) dust - 61 (Unhealthy)
- nitrogen dioxide (NO2) - 22 (Good)
- particulate matter (PM10) suspended dust - 69 (Unhealthy for Sensitive Groups)
- carbon monoxide (CO) - 219 (Good)
- ozone (O3) - 0 (Good)
- sulfur dioxide (SO2) - 8 (Good)

What is the air quality in Lügongqiao today? Is the air polluted in Lügongqiao?. Is there smog?
What is the current level of PM2.5 in Lügongqiao? (particulate matter (PM2.5) dust)
Today's PM2.5 level is:
61 (Unhealthy)
For comparison, the highest level of PM2.5 in Lügongqiao in the last 7 days was: 28 (Friday, May 27, 2022) and the lowest: 28 (Friday, May 27, 2022).
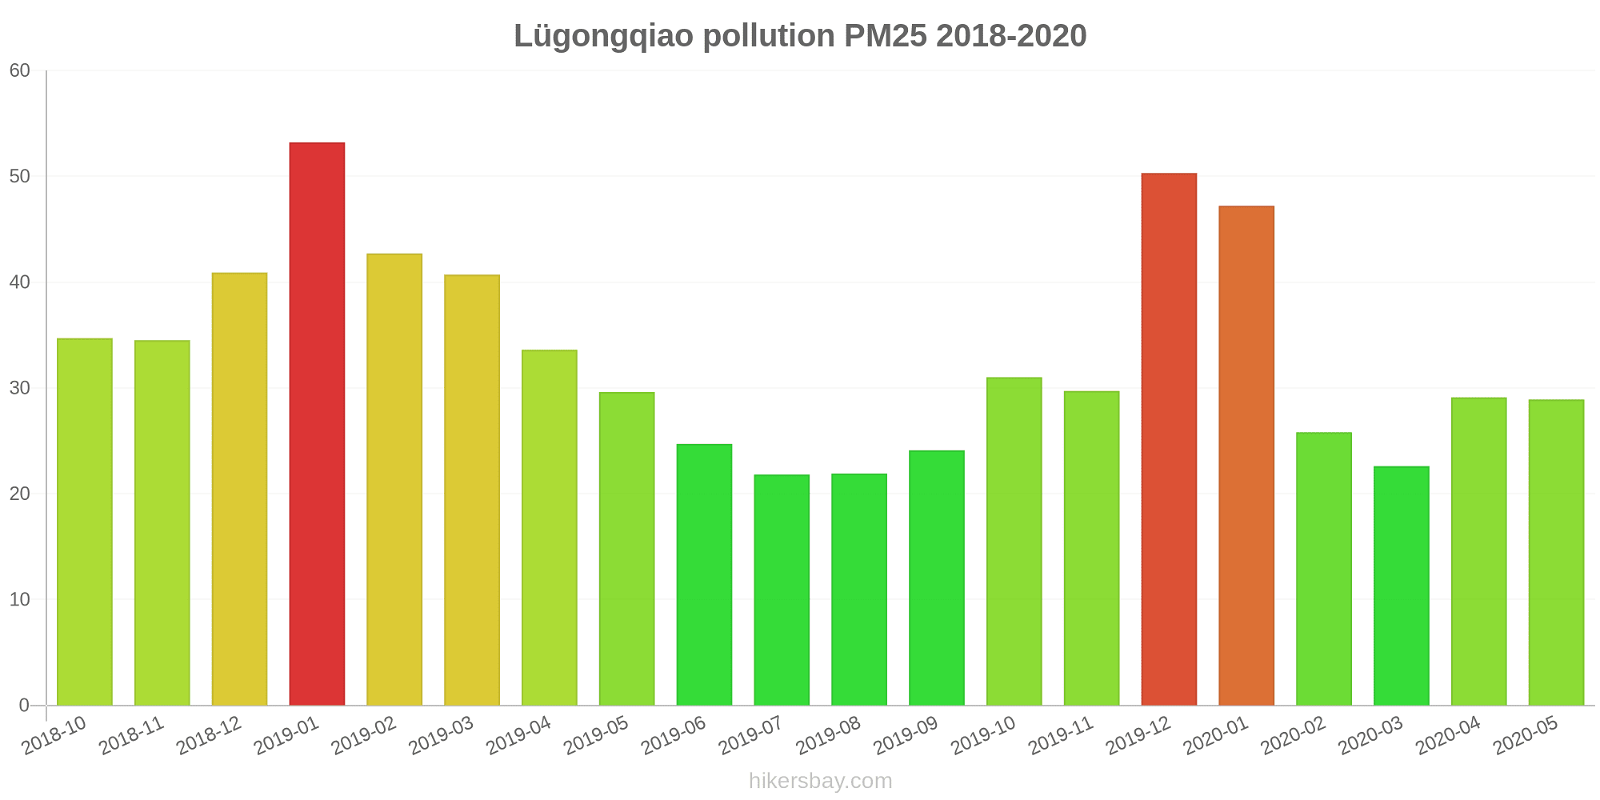
The highest PM2.5 values were recorded: 53 (January 2019).
The lowest level of particulate matter PM2.5 pollution occurs in month: July (22).
How high is the level of NO2? (nitrogen dioxide (NO2))
22 (Good)
What is the level of PM10 today in Lügongqiao? (particulate matter (PM10) suspended dust)
The current level of particulate matter PM10 in Lügongqiao is:
69 (Unhealthy for Sensitive Groups)
The highest PM10 values usually occur in month: 93 (January 2019).
The lowest value of particulate matter PM10 pollution in Lügongqiao is usually recorded in: August (30).
How high is the CO level? (carbon monoxide (CO))
219 (Good)
How is the O3 level today in Lügongqiao? (ozone (O3))
0 (Good)
What is the level of SO2 pollution? (sulfur dioxide (SO2))
8 (Good)
Current data Friday, May 27, 2022, 3:00 PM
PM2,5 61 (Unhealthy)
NO2 22 (Good)
PM10 69 (Unhealthy for Sensitive Groups)
CO 219 (Good)
O3 0 (Good)
SO2 8 (Good)
Data on air pollution from recent days in Lügongqiao
index
2022-05-27
pm25
28
Moderate
no2
22
Good
pm10
35
Moderate
co
579
Good
o3
22
Good
so2
5
Good
data source »
Air pollution in Lügongqiao from October 2018 to May 2020
index
2020-05
2020-04
2020-03
2020-02
2020-01
2019-12
2019-11
2019-10
2019-09
2019-08
2019-07
2019-06
2019-05
2019-04
2019-03
2019-02
2019-01
2018-12
2018-11
2018-10
pm25
29 (Moderate)
29 (Moderate)
23 (Moderate)
26 (Moderate)
47 (Unhealthy for Sensitive Groups)
50 (Unhealthy for Sensitive Groups)
30 (Moderate)
31 (Moderate)
24 (Moderate)
22 (Moderate)
22 (Moderate)
25 (Moderate)
30 (Moderate)
34 (Moderate)
41 (Unhealthy for Sensitive Groups)
43 (Unhealthy for Sensitive Groups)
53 (Unhealthy for Sensitive Groups)
41 (Unhealthy for Sensitive Groups)
35 (Moderate)
35 (Moderate)
co
847 (Good)
639 (Good)
703 (Good)
746 (Good)
1 (Good)
889 (Good)
653 (Good)
759 (Good)
739 (Good)
710 (Good)
643 (Good)
701 (Good)
619 (Good)
689 (Good)
860 (Good)
942 (Good)
911 (Good)
854 (Good)
892 (Good)
837 (Good)
no2
30 (Good)
39 (Good)
35 (Good)
17 (Good)
34 (Good)
57 (Moderate)
46 (Moderate)
40 (Moderate)
29 (Good)
21 (Good)
23 (Good)
20 (Good)
27 (Good)
34 (Good)
36 (Good)
29 (Good)
51 (Moderate)
48 (Moderate)
48 (Moderate)
51 (Moderate)
o3
161 (Unhealthy)
159 (Unhealthy)
109 (Moderate)
103 (Moderate)
71 (Moderate)
65 (Good)
86 (Moderate)
114 (Moderate)
149 (Unhealthy for Sensitive Groups)
145 (Unhealthy for Sensitive Groups)
157 (Unhealthy)
179 (Unhealthy)
165 (Unhealthy)
138 (Unhealthy for Sensitive Groups)
124 (Unhealthy for Sensitive Groups)
80 (Moderate)
61 (Good)
59 (Good)
92 (Moderate)
125 (Unhealthy for Sensitive Groups)
pm10
51 (Unhealthy for Sensitive Groups)
60 (Unhealthy for Sensitive Groups)
45 (Moderate)
41 (Moderate)
62 (Unhealthy for Sensitive Groups)
80 (Unhealthy)
70 (Unhealthy for Sensitive Groups)
63 (Unhealthy for Sensitive Groups)
40 (Moderate)
30 (Moderate)
30 (Moderate)
31 (Moderate)
50 (Unhealthy for Sensitive Groups)
50 (Moderate)
61 (Unhealthy for Sensitive Groups)
54 (Unhealthy for Sensitive Groups)
93 (Unhealthy)
82 (Unhealthy)
66 (Unhealthy for Sensitive Groups)
69 (Unhealthy for Sensitive Groups)
so2
8.8 (Good)
7.4 (Good)
8.6 (Good)
7 (Good)
8.3 (Good)
8.2 (Good)
8.7 (Good)
8.9 (Good)
7.6 (Good)
5.3 (Good)
3.8 (Good)
6.4 (Good)
8.2 (Good)
9.5 (Good)
7.6 (Good)
5.8 (Good)
8.7 (Good)
7.6 (Good)
6.3 (Good)
6.5 (Good)
data source »
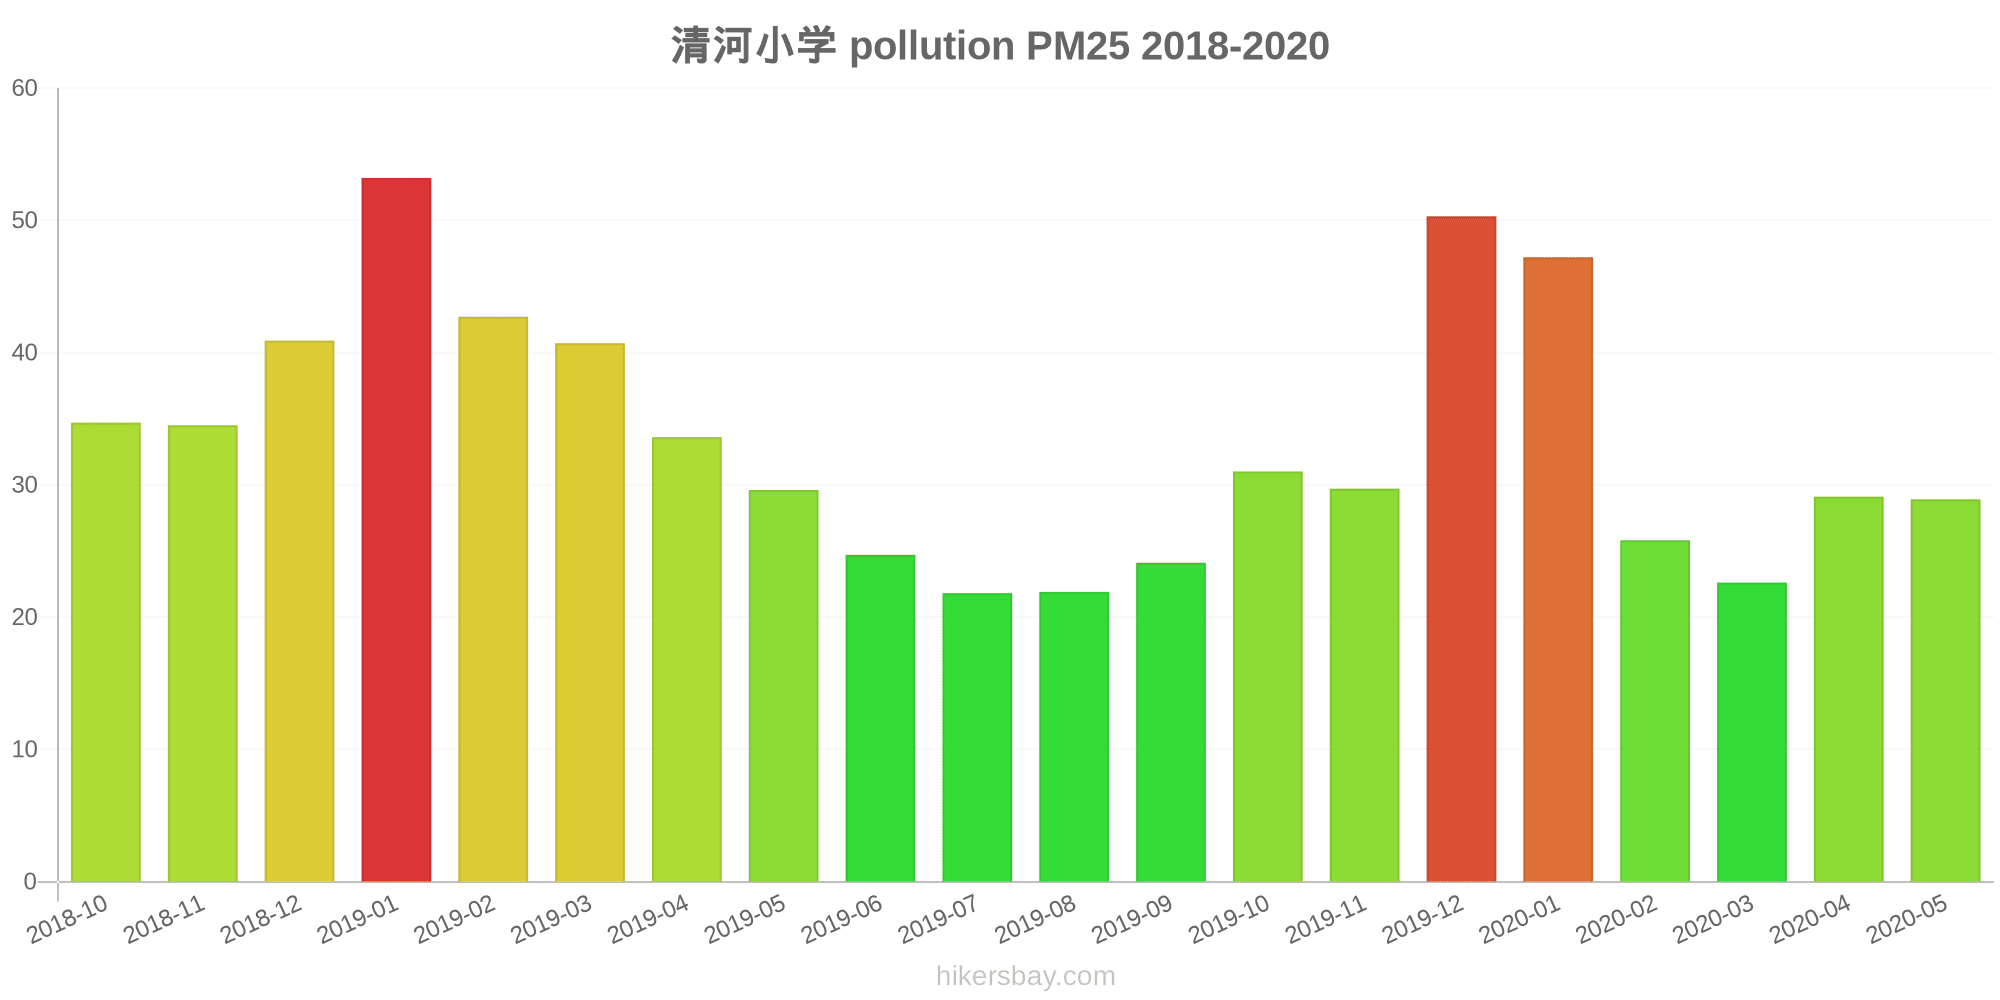
清河小学
Friday, May 27, 2022, 3:00 PM
PM2,5 61 (Unhealthy)
particulate matter (PM2.5) dust
NO2 22 (Good)
nitrogen dioxide (NO2)
PM10 69 (Unhealthy for Sensitive Groups)
particulate matter (PM10) suspended dust
CO 219 (Good)
carbon monoxide (CO)
O3 0.05 (Good)
ozone (O3)
SO2 7.7 (Good)
sulfur dioxide (SO2)
清河小学
index
2022-05-27
pm25
28
no2
22
pm10
35
co
579
o3
22
so2
4.6
清河小学
2018-10 2020-05

index
2020-05
2020-04
2020-03
2020-02
2020-01
2019-12
2019-11
2019-10
2019-09
2019-08
2019-07
2019-06
2019-05
2019-04
2019-03
2019-02
2019-01
2018-12
2018-11
2018-10
pm25
29
29
23
26
47
50
30
31
24
22
22
25
30
34
41
43
53
41
35
35
co
847
639
703
746
1
889
653
759
739
710
643
701
619
689
860
942
911
854
892
837
no2
30
39
35
17
34
57
46
40
29
21
23
20
27
34
36
29
51
48
48
51
o3
161
159
109
103
71
65
86
114
149
145
157
179
165
138
124
80
61
59
92
125
pm10
51
60
45
41
62
80
70
63
40
30
30
31
50
50
61
54
93
82
66
69
so2
8.8
7.4
8.6
7
8.3
8.2
8.7
8.9
7.6
5.3
3.8
6.4
8.2
9.5
7.6
5.8
8.7
7.6
6.3
6.5
* Pollution data source:
https://openaq.org
(ChinaAQIData)
The data is licensed under CC-By 4.0
PM2,5 61 (Unhealthy)
NO2 22 (Good)
PM10 69 (Unhealthy for Sensitive Groups)
CO 219 (Good)
O3 0 (Good)
SO2 8 (Good)
Data on air pollution from recent days in Lügongqiao
| index | 2022-05-27 |
|---|---|
| pm25 | 28 Moderate |
| no2 | 22 Good |
| pm10 | 35 Moderate |
| co | 579 Good |
| o3 | 22 Good |
| so2 | 5 Good |

| index | 2020-05 | 2020-04 | 2020-03 | 2020-02 | 2020-01 | 2019-12 | 2019-11 | 2019-10 | 2019-09 | 2019-08 | 2019-07 | 2019-06 | 2019-05 | 2019-04 | 2019-03 | 2019-02 | 2019-01 | 2018-12 | 2018-11 | 2018-10 |
|---|---|---|---|---|---|---|---|---|---|---|---|---|---|---|---|---|---|---|---|---|
| pm25 | 29 (Moderate) | 29 (Moderate) | 23 (Moderate) | 26 (Moderate) | 47 (Unhealthy for Sensitive Groups) | 50 (Unhealthy for Sensitive Groups) | 30 (Moderate) | 31 (Moderate) | 24 (Moderate) | 22 (Moderate) | 22 (Moderate) | 25 (Moderate) | 30 (Moderate) | 34 (Moderate) | 41 (Unhealthy for Sensitive Groups) | 43 (Unhealthy for Sensitive Groups) | 53 (Unhealthy for Sensitive Groups) | 41 (Unhealthy for Sensitive Groups) | 35 (Moderate) | 35 (Moderate) |
| co | 847 (Good) | 639 (Good) | 703 (Good) | 746 (Good) | 1 (Good) | 889 (Good) | 653 (Good) | 759 (Good) | 739 (Good) | 710 (Good) | 643 (Good) | 701 (Good) | 619 (Good) | 689 (Good) | 860 (Good) | 942 (Good) | 911 (Good) | 854 (Good) | 892 (Good) | 837 (Good) |
| no2 | 30 (Good) | 39 (Good) | 35 (Good) | 17 (Good) | 34 (Good) | 57 (Moderate) | 46 (Moderate) | 40 (Moderate) | 29 (Good) | 21 (Good) | 23 (Good) | 20 (Good) | 27 (Good) | 34 (Good) | 36 (Good) | 29 (Good) | 51 (Moderate) | 48 (Moderate) | 48 (Moderate) | 51 (Moderate) |
| o3 | 161 (Unhealthy) | 159 (Unhealthy) | 109 (Moderate) | 103 (Moderate) | 71 (Moderate) | 65 (Good) | 86 (Moderate) | 114 (Moderate) | 149 (Unhealthy for Sensitive Groups) | 145 (Unhealthy for Sensitive Groups) | 157 (Unhealthy) | 179 (Unhealthy) | 165 (Unhealthy) | 138 (Unhealthy for Sensitive Groups) | 124 (Unhealthy for Sensitive Groups) | 80 (Moderate) | 61 (Good) | 59 (Good) | 92 (Moderate) | 125 (Unhealthy for Sensitive Groups) |
| pm10 | 51 (Unhealthy for Sensitive Groups) | 60 (Unhealthy for Sensitive Groups) | 45 (Moderate) | 41 (Moderate) | 62 (Unhealthy for Sensitive Groups) | 80 (Unhealthy) | 70 (Unhealthy for Sensitive Groups) | 63 (Unhealthy for Sensitive Groups) | 40 (Moderate) | 30 (Moderate) | 30 (Moderate) | 31 (Moderate) | 50 (Unhealthy for Sensitive Groups) | 50 (Moderate) | 61 (Unhealthy for Sensitive Groups) | 54 (Unhealthy for Sensitive Groups) | 93 (Unhealthy) | 82 (Unhealthy) | 66 (Unhealthy for Sensitive Groups) | 69 (Unhealthy for Sensitive Groups) |
| so2 | 8.8 (Good) | 7.4 (Good) | 8.6 (Good) | 7 (Good) | 8.3 (Good) | 8.2 (Good) | 8.7 (Good) | 8.9 (Good) | 7.6 (Good) | 5.3 (Good) | 3.8 (Good) | 6.4 (Good) | 8.2 (Good) | 9.5 (Good) | 7.6 (Good) | 5.8 (Good) | 8.7 (Good) | 7.6 (Good) | 6.3 (Good) | 6.5 (Good) |
PM2,5 61 (Unhealthy)
particulate matter (PM2.5) dustNO2 22 (Good)
nitrogen dioxide (NO2)PM10 69 (Unhealthy for Sensitive Groups)
particulate matter (PM10) suspended dustCO 219 (Good)
carbon monoxide (CO)O3 0.05 (Good)
ozone (O3)SO2 7.7 (Good)
sulfur dioxide (SO2)清河小学
| index | 2022-05-27 |
|---|---|
| pm25 | 28 |
| no2 | 22 |
| pm10 | 35 |
| co | 579 |
| o3 | 22 |
| so2 | 4.6 |
清河小学
| index | 2020-05 | 2020-04 | 2020-03 | 2020-02 | 2020-01 | 2019-12 | 2019-11 | 2019-10 | 2019-09 | 2019-08 | 2019-07 | 2019-06 | 2019-05 | 2019-04 | 2019-03 | 2019-02 | 2019-01 | 2018-12 | 2018-11 | 2018-10 |
|---|---|---|---|---|---|---|---|---|---|---|---|---|---|---|---|---|---|---|---|---|
| pm25 | 29 | 29 | 23 | 26 | 47 | 50 | 30 | 31 | 24 | 22 | 22 | 25 | 30 | 34 | 41 | 43 | 53 | 41 | 35 | 35 |
| co | 847 | 639 | 703 | 746 | 1 | 889 | 653 | 759 | 739 | 710 | 643 | 701 | 619 | 689 | 860 | 942 | 911 | 854 | 892 | 837 |
| no2 | 30 | 39 | 35 | 17 | 34 | 57 | 46 | 40 | 29 | 21 | 23 | 20 | 27 | 34 | 36 | 29 | 51 | 48 | 48 | 51 |
| o3 | 161 | 159 | 109 | 103 | 71 | 65 | 86 | 114 | 149 | 145 | 157 | 179 | 165 | 138 | 124 | 80 | 61 | 59 | 92 | 125 |
| pm10 | 51 | 60 | 45 | 41 | 62 | 80 | 70 | 63 | 40 | 30 | 30 | 31 | 50 | 50 | 61 | 54 | 93 | 82 | 66 | 69 |
| so2 | 8.8 | 7.4 | 8.6 | 7 | 8.3 | 8.2 | 8.7 | 8.9 | 7.6 | 5.3 | 3.8 | 6.4 | 8.2 | 9.5 | 7.6 | 5.8 | 8.7 | 7.6 | 6.3 | 6.5 |