Air Pollution in Chouchuan: Real-time Air Quality Index and smog alert.
Pollution and air quality forecast for Chouchuan. Today is Tuesday, June 2, 2026. The following air pollution values have been recorded for Chouchuan:- particulate matter (PM10) suspended dust - 179 (Very bad Hazardous)
- particulate matter (PM2.5) dust - 35 (Unhealthy for Sensitive Groups)
- ozone (O3) - 0 (Good)
- nitrogen dioxide (NO2) - 0 (Good)
- sulfur dioxide (SO2) - 0 (Good)

What is the air quality in Chouchuan today? Is the air polluted in Chouchuan?. Is there smog?
What is the level of PM10 today in Chouchuan? (particulate matter (PM10) suspended dust)
The current level of particulate matter PM10 in Chouchuan is:
179 (Very bad Hazardous)
The highest PM10 values usually occur in month: 82 (December 2019).
The lowest value of particulate matter PM10 pollution in Chouchuan is usually recorded in: July (35).
What is the current level of PM2.5 in Chouchuan? (particulate matter (PM2.5) dust)
Today's PM2.5 level is:
35 (Unhealthy for Sensitive Groups)
For comparison, the highest level of PM2.5 in Chouchuan in the last 7 days was: 56 (Friday, May 27, 2022) and the lowest: 56 (Friday, May 27, 2022).
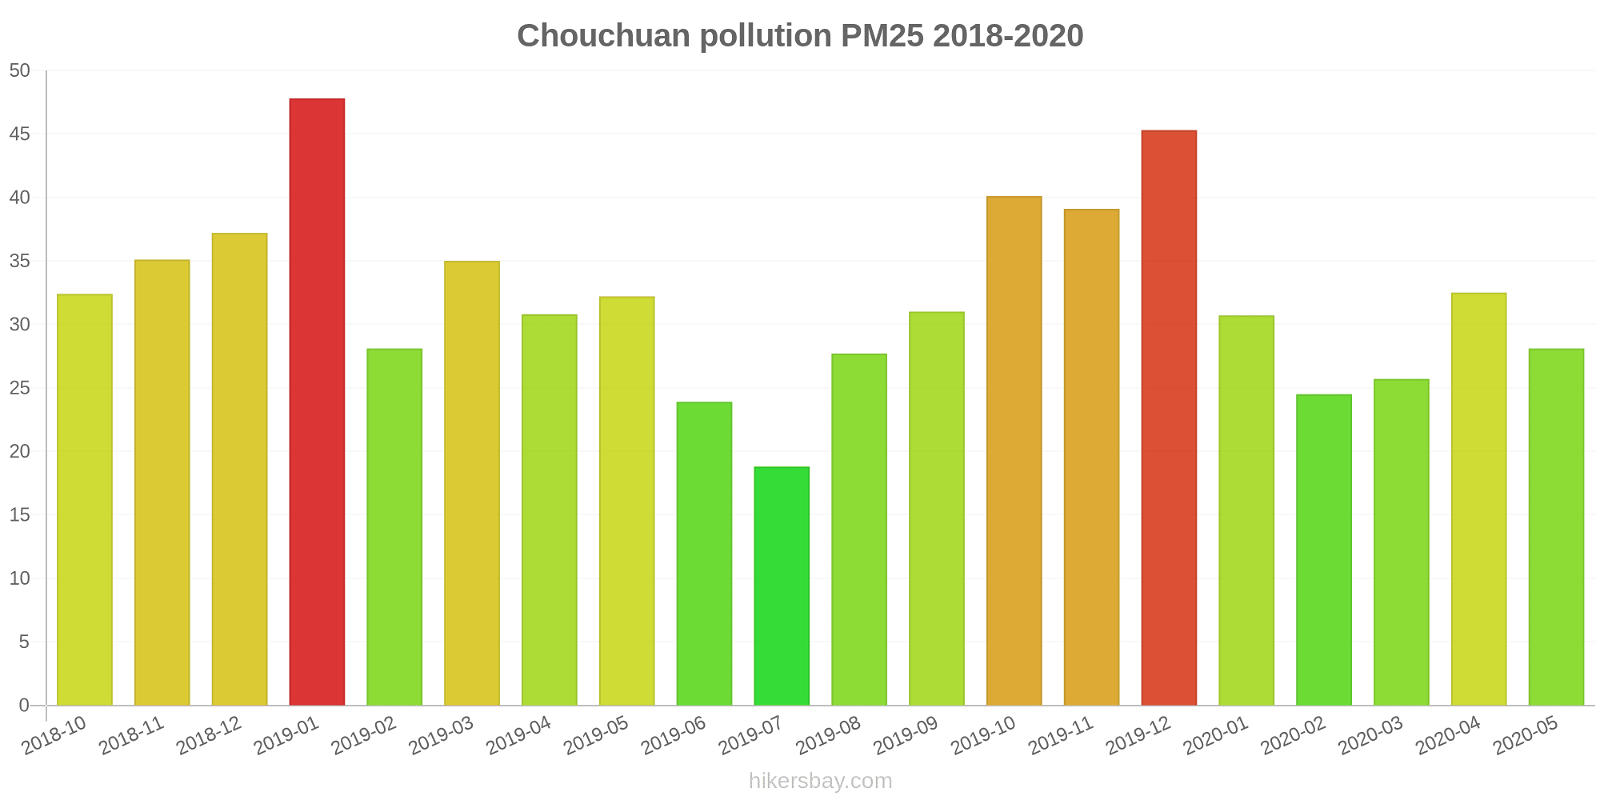
The highest PM2.5 values were recorded: 48 (January 2019).
The lowest level of particulate matter PM2.5 pollution occurs in month: July (19).
How is the O3 level today in Chouchuan? (ozone (O3))
0 (Good)
How high is the level of NO2? (nitrogen dioxide (NO2))
0 (Good)
What is the level of SO2 pollution? (sulfur dioxide (SO2))
0 (Good)
Current data Friday, May 27, 2022, 12:00 PM
PM10 179 (Very bad Hazardous)
PM2,5 35 (Unhealthy for Sensitive Groups)
O3 0 (Good)
NO2 0 (Good)
SO2 0 (Good)
Data on air pollution from recent days in Chouchuan
index
2022-05-27
pm10
56
Unhealthy for Sensitive Groups
pm25
56
Unhealthy
o3
0
Good
no2
0
Good
so2
0
Good
data source »
Air pollution in Chouchuan from October 2018 to May 2020
index
2020-05
2020-04
2020-03
2020-02
2020-01
2019-12
2019-11
2019-10
2019-09
2019-08
2019-07
2019-06
2019-05
2019-04
2019-03
2019-02
2019-01
2018-12
2018-11
2018-10
pm25
28 (Moderate)
33 (Moderate)
26 (Moderate)
25 (Moderate)
31 (Moderate)
45 (Unhealthy for Sensitive Groups)
39 (Unhealthy for Sensitive Groups)
40 (Unhealthy for Sensitive Groups)
31 (Moderate)
28 (Moderate)
19 (Moderate)
24 (Moderate)
32 (Moderate)
31 (Moderate)
35 (Unhealthy for Sensitive Groups)
28 (Moderate)
48 (Unhealthy for Sensitive Groups)
37 (Unhealthy for Sensitive Groups)
35 (Unhealthy for Sensitive Groups)
32 (Moderate)
co
550 (Good)
549 (Good)
489 (Good)
486 (Good)
694 (Good)
818 (Good)
586 (Good)
674 (Good)
613 (Good)
545 (Good)
551 (Good)
580 (Good)
749 (Good)
804 (Good)
755 (Good)
937 (Good)
1 (Good)
815 (Good)
858 (Good)
936 (Good)
no2
16 (Good)
26 (Good)
20 (Good)
8.8 (Good)
21 (Good)
39 (Good)
34 (Good)
27 (Good)
20 (Good)
16 (Good)
13 (Good)
12 (Good)
20 (Good)
25 (Good)
30 (Good)
15 (Good)
27 (Good)
26 (Good)
30 (Good)
31 (Good)
o3
117 (Moderate)
124 (Unhealthy for Sensitive Groups)
88 (Moderate)
90 (Moderate)
68 (Good)
62 (Good)
100 (Moderate)
130 (Unhealthy for Sensitive Groups)
160 (Unhealthy)
146 (Unhealthy for Sensitive Groups)
104 (Moderate)
108 (Moderate)
120 (Unhealthy for Sensitive Groups)
104 (Moderate)
100 (Moderate)
55 (Good)
70 (Good)
49 (Good)
69 (Good)
94 (Moderate)
pm10
53 (Unhealthy for Sensitive Groups)
61 (Unhealthy for Sensitive Groups)
46 (Moderate)
42 (Moderate)
51 (Unhealthy for Sensitive Groups)
82 (Unhealthy)
81 (Unhealthy)
77 (Unhealthy for Sensitive Groups)
63 (Unhealthy for Sensitive Groups)
52 (Unhealthy for Sensitive Groups)
35 (Moderate)
42 (Moderate)
58 (Unhealthy for Sensitive Groups)
51 (Unhealthy for Sensitive Groups)
59 (Unhealthy for Sensitive Groups)
45 (Moderate)
72 (Unhealthy for Sensitive Groups)
60 (Unhealthy for Sensitive Groups)
60 (Unhealthy for Sensitive Groups)
65 (Unhealthy for Sensitive Groups)
so2
18 (Good)
21 (Good)
18 (Good)
9.8 (Good)
9.5 (Good)
22 (Good)
28 (Good)
26 (Good)
22 (Good)
13 (Good)
7 (Good)
12 (Good)
20 (Good)
18 (Good)
22 (Good)
12 (Good)
17 (Good)
21 (Good)
25 (Good)
27 (Good)
data source »
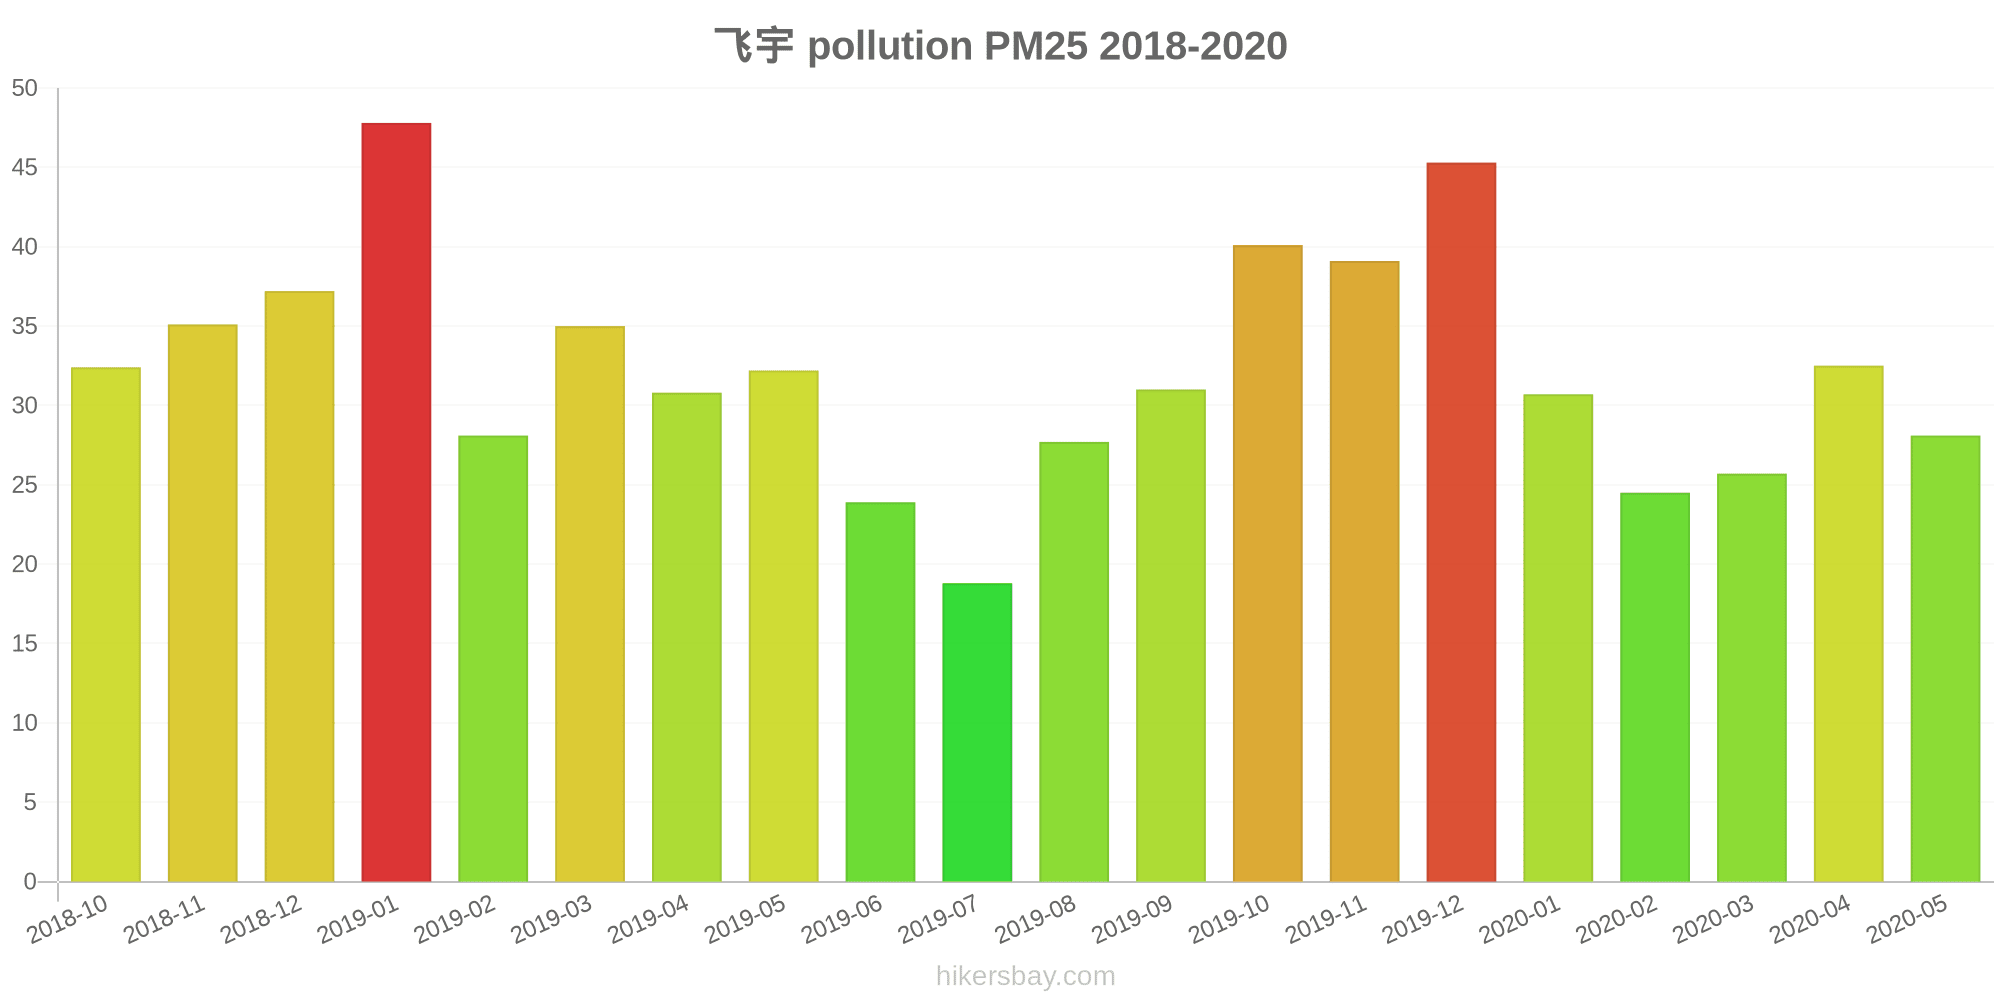
飞宇
Friday, May 27, 2022, 12:00 PM
PM10 179 (Very bad Hazardous)
particulate matter (PM10) suspended dust
PM2,5 35 (Unhealthy for Sensitive Groups)
particulate matter (PM2.5) dust
O3 0.04 (Good)
ozone (O3)
NO2 0 (Good)
nitrogen dioxide (NO2)
SO2 0 (Good)
sulfur dioxide (SO2)
飞宇
index
2022-05-27
pm10
56
pm25
56
o3
0.03
no2
0
so2
0
飞宇
2018-10 2020-05

index
2020-05
2020-04
2020-03
2020-02
2020-01
2019-12
2019-11
2019-10
2019-09
2019-08
2019-07
2019-06
2019-05
2019-04
2019-03
2019-02
2019-01
2018-12
2018-11
2018-10
pm25
28
33
26
25
31
45
39
40
31
28
19
24
32
31
35
28
48
37
35
32
co
550
549
489
486
694
818
586
674
613
545
551
580
749
804
755
937
1
815
858
936
no2
16
26
20
8.8
21
39
34
27
20
16
13
12
20
25
30
15
27
26
30
31
o3
117
124
88
90
68
62
100
130
160
146
104
108
120
104
100
55
70
49
69
94
pm10
53
61
46
42
51
82
81
77
63
52
35
42
58
51
59
45
72
60
60
65
so2
18
21
18
9.8
9.5
22
28
26
22
13
7
12
20
18
22
12
17
21
25
27
* Pollution data source:
https://openaq.org
(ChinaAQIData)
The data is licensed under CC-By 4.0
PM10 179 (Very bad Hazardous)
PM2,5 35 (Unhealthy for Sensitive Groups)
O3 0 (Good)
NO2 0 (Good)
SO2 0 (Good)
Data on air pollution from recent days in Chouchuan
| index | 2022-05-27 |
|---|---|
| pm10 | 56 Unhealthy for Sensitive Groups |
| pm25 | 56 Unhealthy |
| o3 | 0 Good |
| no2 | 0 Good |
| so2 | 0 Good |

| index | 2020-05 | 2020-04 | 2020-03 | 2020-02 | 2020-01 | 2019-12 | 2019-11 | 2019-10 | 2019-09 | 2019-08 | 2019-07 | 2019-06 | 2019-05 | 2019-04 | 2019-03 | 2019-02 | 2019-01 | 2018-12 | 2018-11 | 2018-10 |
|---|---|---|---|---|---|---|---|---|---|---|---|---|---|---|---|---|---|---|---|---|
| pm25 | 28 (Moderate) | 33 (Moderate) | 26 (Moderate) | 25 (Moderate) | 31 (Moderate) | 45 (Unhealthy for Sensitive Groups) | 39 (Unhealthy for Sensitive Groups) | 40 (Unhealthy for Sensitive Groups) | 31 (Moderate) | 28 (Moderate) | 19 (Moderate) | 24 (Moderate) | 32 (Moderate) | 31 (Moderate) | 35 (Unhealthy for Sensitive Groups) | 28 (Moderate) | 48 (Unhealthy for Sensitive Groups) | 37 (Unhealthy for Sensitive Groups) | 35 (Unhealthy for Sensitive Groups) | 32 (Moderate) |
| co | 550 (Good) | 549 (Good) | 489 (Good) | 486 (Good) | 694 (Good) | 818 (Good) | 586 (Good) | 674 (Good) | 613 (Good) | 545 (Good) | 551 (Good) | 580 (Good) | 749 (Good) | 804 (Good) | 755 (Good) | 937 (Good) | 1 (Good) | 815 (Good) | 858 (Good) | 936 (Good) |
| no2 | 16 (Good) | 26 (Good) | 20 (Good) | 8.8 (Good) | 21 (Good) | 39 (Good) | 34 (Good) | 27 (Good) | 20 (Good) | 16 (Good) | 13 (Good) | 12 (Good) | 20 (Good) | 25 (Good) | 30 (Good) | 15 (Good) | 27 (Good) | 26 (Good) | 30 (Good) | 31 (Good) |
| o3 | 117 (Moderate) | 124 (Unhealthy for Sensitive Groups) | 88 (Moderate) | 90 (Moderate) | 68 (Good) | 62 (Good) | 100 (Moderate) | 130 (Unhealthy for Sensitive Groups) | 160 (Unhealthy) | 146 (Unhealthy for Sensitive Groups) | 104 (Moderate) | 108 (Moderate) | 120 (Unhealthy for Sensitive Groups) | 104 (Moderate) | 100 (Moderate) | 55 (Good) | 70 (Good) | 49 (Good) | 69 (Good) | 94 (Moderate) |
| pm10 | 53 (Unhealthy for Sensitive Groups) | 61 (Unhealthy for Sensitive Groups) | 46 (Moderate) | 42 (Moderate) | 51 (Unhealthy for Sensitive Groups) | 82 (Unhealthy) | 81 (Unhealthy) | 77 (Unhealthy for Sensitive Groups) | 63 (Unhealthy for Sensitive Groups) | 52 (Unhealthy for Sensitive Groups) | 35 (Moderate) | 42 (Moderate) | 58 (Unhealthy for Sensitive Groups) | 51 (Unhealthy for Sensitive Groups) | 59 (Unhealthy for Sensitive Groups) | 45 (Moderate) | 72 (Unhealthy for Sensitive Groups) | 60 (Unhealthy for Sensitive Groups) | 60 (Unhealthy for Sensitive Groups) | 65 (Unhealthy for Sensitive Groups) |
| so2 | 18 (Good) | 21 (Good) | 18 (Good) | 9.8 (Good) | 9.5 (Good) | 22 (Good) | 28 (Good) | 26 (Good) | 22 (Good) | 13 (Good) | 7 (Good) | 12 (Good) | 20 (Good) | 18 (Good) | 22 (Good) | 12 (Good) | 17 (Good) | 21 (Good) | 25 (Good) | 27 (Good) |
PM10 179 (Very bad Hazardous)
particulate matter (PM10) suspended dustPM2,5 35 (Unhealthy for Sensitive Groups)
particulate matter (PM2.5) dustO3 0.04 (Good)
ozone (O3)NO2 0 (Good)
nitrogen dioxide (NO2)SO2 0 (Good)
sulfur dioxide (SO2)飞宇
| index | 2022-05-27 |
|---|---|
| pm10 | 56 |
| pm25 | 56 |
| o3 | 0.03 |
| no2 | 0 |
| so2 | 0 |
飞宇
| index | 2020-05 | 2020-04 | 2020-03 | 2020-02 | 2020-01 | 2019-12 | 2019-11 | 2019-10 | 2019-09 | 2019-08 | 2019-07 | 2019-06 | 2019-05 | 2019-04 | 2019-03 | 2019-02 | 2019-01 | 2018-12 | 2018-11 | 2018-10 |
|---|---|---|---|---|---|---|---|---|---|---|---|---|---|---|---|---|---|---|---|---|
| pm25 | 28 | 33 | 26 | 25 | 31 | 45 | 39 | 40 | 31 | 28 | 19 | 24 | 32 | 31 | 35 | 28 | 48 | 37 | 35 | 32 |
| co | 550 | 549 | 489 | 486 | 694 | 818 | 586 | 674 | 613 | 545 | 551 | 580 | 749 | 804 | 755 | 937 | 1 | 815 | 858 | 936 |
| no2 | 16 | 26 | 20 | 8.8 | 21 | 39 | 34 | 27 | 20 | 16 | 13 | 12 | 20 | 25 | 30 | 15 | 27 | 26 | 30 | 31 |
| o3 | 117 | 124 | 88 | 90 | 68 | 62 | 100 | 130 | 160 | 146 | 104 | 108 | 120 | 104 | 100 | 55 | 70 | 49 | 69 | 94 |
| pm10 | 53 | 61 | 46 | 42 | 51 | 82 | 81 | 77 | 63 | 52 | 35 | 42 | 58 | 51 | 59 | 45 | 72 | 60 | 60 | 65 |
| so2 | 18 | 21 | 18 | 9.8 | 9.5 | 22 | 28 | 26 | 22 | 13 | 7 | 12 | 20 | 18 | 22 | 12 | 17 | 21 | 25 | 27 |